

Translate this page into:
Comparison of peritoneal transport characteristics at the second week and at six months of peritoneal dialysis commencement
This is an open-access article distributed under the terms of the Creative Commons Attribution-Noncommercial-Share Alike 3.0 Unported, which permits unrestricted use, distribution, and reproduction in any medium, provided the original work is properly cited.
This article was originally published by Medknow Publications & Media Pvt Ltd and was migrated to Scientific Scholar after the change of Publisher.
Abstract
Peritoneal equilibration test (PET) is an important tool for managing peritoneal dialysis (PD) prescription. The Kidney Disease Outcomes Quality Initiative (KDOQI) guidelines suggest that the first PET be performed 4-8 weeks after PD commencement. The main reason for this delay is because of the peritoneal membrane might change its character once it is exposed to the glucose based dialysate. In this study, we compared PET 2 weeks after PD commencement to PET after 6 months to evaluate the changes in the peritoneal membrane character with time. This study included 126 patients who underwent PD initiation between March 2007 and December 2011. The PET was performed as per the standard protocol at 2nd week and 6th month after PD initiation. Transport status was categorized as low, low average, high average, and high as per the standard definition. There was no change in transport character in 115 patients (91.2%) between the two PET measurements. When the Early PET at 2nd week and 6th month PET data were analyzed, no significant changes were observed in measured D/P creatinine (0.59 ± 0.14 vs. 0.62 ± 0.14 respectively P = 0.26) and D/D0 Glucose (0.46 ± 0.12 vs. 0.46 ± 0.11, P = 0.65). Using the Bland-Altman analysis the repeatability coefficients were 0.27 and 0.25 for creatinine and glucose values respectively. In our study, the PET performed at the 2nd week are similar to that of the 6th month PET in 91.2% of our patients and the test did not significantly change with time. In conclusion, we could do PET early at 2nd week to assess the peritoneal membrane character and this would help in proper dialysis prescription to the patients.
Keywords
Continuous ambulatory peritoneal dialysis
early peritoneal equilibration test
membrane transport
peritoneal equilibration test
standard peritoneal equilibration test

Introduction
Peritoneal equilibration test (PET) developed by Twardowski[1] characterizes the transport nature of the patient’s peritoneal membrane. The transport character not only helps to decide the dwell time, but also plays a crucial role in determining the morbidity and mortality of the patients on peritoneal dialysis (PD). Patients who are ’low (L) transporters’ need longer dwells and have an excellent prognosis compared to patients who are high (H) transporters who need shorter dwells and have poor long-term prognosis on PD.[23] Changes in the membrane character have been widely reported in the literature.[4–7] With time and after peritonitis episodes the membrane transport character changes to the H transporter status in patients who were L transporters initially.
As per the NKF-KDOQI guidelines, the PD should be initiated after 2 weeks of catheter placement. This break-in period is required for the wound to heal and to minimize the chances of leaks. Even after, the break in the period the incidence of dialysate leakage reported in the literature varies from 1.5% to 37% in continuous ambulatory peritoneal dialysis (CAPD) patients.[8–11] Pericatheter leak is one of the major catheter-related complications in the CAPD because it increases the risk of catheter infection and catheter malfunction.[912] Therefore, delaying CAPD for 2-4 weeks after catheter insertion has been the usual recommendation to minimize risk of pericatheter leakage.[91213]
Young-Il Jo et al.,[14] evaluated the pericatheter leak in 51 of his patients following immediate initiation of CAPD without a break in period. Immediately after insertion, they irrigated the catheter with 500 mL dialysis solution three times. After irrigation, PD was performed with 500 mL dialysis (1.5% glucose) solution with heparin (1000 U/L) every 3 h during the first 3 days. All patients stayed in a supine position with minimal ambulation during the first 3 days. PD was continued with 1 L dialysis solution every 4 h during the next 4 days, and four 2-L exchanges per day were performed starting 7 days after catheter insertion. They observed a pericatheter leakage in only one patient (1.9%) during the 12 months following catheter insertion. They concluded that immediate initiation of PD without a break-in period after percutaneous catheter placement rarely resulted in pericatheter leakage in CAPD patients. This is an intriguing observation.
Since most of our patients travel over 50-100 miles to reach our center, we found it difficult to keep them on outpatient hemodialysis during the break in period. Furthermore, care givers need to be trained in-house to do the dialysis at home. Therefore, our standard practice is to avoid break in period, retain the patient in the hospital for 2 weeks after the catheterization and train the care giver adequately.
We flush the catheter with 250 mL of the dialysis solution on the day of catheterization. PD is continued with gradually increasing volumes (500 mL, 1000 mL, 1500 mL, 2000 mL) with the patient in the supine position. The increment in volume is carried out every 3rd day in non-diabetics and every 4th day in diabetic patients and in those needing omentectomy. If any patient develop dialyzate leak, the dwell volume is decreased for few days and subsequently increased to facilitate proper wound healing.
Currently, the standard recommendation by NKF-KDOQI guidelines for the first PET measurement is 4-8 weeks after the PD commencement. Rocoo et al.,[15] found significant changes between the first PET performed <2 weeks in 34 patients and second PET performed 6 months later. However, they also performed the first PET in a different group of 17 patients at 4 weeks and second PET at 28 weeks and found no changes in membrane transport. Johnson et al.,[16] performed PET at 1 week and compared it with 4th week after PD initiation in 50 patients and found statistically significant changes in the peritoneal membrane transport. When 28 patients in this group underwent subsequent PET at 1 year, they did not find significant changes in membrane transport between the 4th week and 1 year status. Both the authors agreed that the initial equilibration test (at 1 week and <2 weeks) is preliminary and the test performed at 4 weeks correlated well with the later tests performed (at 6th month and at 1st year). Johnson et al., concluded that a true change had occurred in peritoneal transport rates between 1 week and 1 month post-PD initiation. The reasons believed to be responsible for the change in the membrane character in the early stages are due to the dialysate induced changes in the local inflammatory cytokine production, dextrose induced changes in the peritoneal blood flow, and peritoneal vascularity.[17–19]
The timing of the first assessment of the peritoneal membrane character by doing PET is of considerable interest. Not many studies are available where PET is performed between 2 week and 4 week after PD commencement that is compared to the subsequent PET. We prospectively looked on to the peritoneal membrane character at the 2nd week of PD commencement by doing an ’Early PET’ and compared with the ’second PET’ that was performed at the 6th month in our PD patients.
Materials and Methods
Study population
Patients who were initiated on PD in our hospital between March 2007 and December 2011 were included in the study. Patients were initiated on 250 mL exchanges on the same day of PD catheterization. The dwell volume was gradually increased and the full volume of two liters was achieved at the 2nd week, and the first PET was performed in all these patients. We also observed pericatheter leak incidence during our initiation protocol. The PD prescription was given according to their transport character at the end of 2nd week itself.
Patients were followed-up and the second PET was performed at the end of 6th month. The PET measurements and the transport character were defined as per the standard method described by Twardowski.[1] The dialysate sugar and creatinine values were obtained at the 0, 2nd and 4th h. The serum creatinine values were obtained at the 2nd and at 4th h. The 4th h D/P ratios of creatinine and the ratio of dialysate glucose concentration at 0 h and 4 h (D4/D0) were calculated in all patients. Peritoneal transport character was categorized as L, low average (LA), high average (HA), and H according to these values proposed by Twardowski. Patients who had peritonitis in the first 6 months and who did not undergo the second PET were excluded from the study.
Statistical analysis
Results were expressed as mean ± SD for continuous parametric data and frequencies and percentages for categorical data. The data were compared using the Chi-square test and the McNemar-Bowker test. Data were analyzed using the software package SPSS 17. A P value of < 0.05 was considered to be statistically significant. The levels of agreement between PET measurements (D/P creatinine and D/D0 sugar) at 2nd week and 6th month were determined using the Bland-Altman analysis. Repeatability coefficient was calculated as 1.96 SD of the differences between paired measurements.
Results
Patient characteristics
Total number of patients who were initiated on PD during the study period was 178. Fifty two patients were excluded from this study as they did not fulfill the inclusion criteria. Among these patients 20 patients did not undergo second PET as they were followed-up elsewhere, 10 had peritonitis during the 6 months of follow-up and 22 dropped out of the PD program due to transplant, death or converted to hemodialysis were excluded. Ultimately, 126 patients were included in this study.
A total of 102 (81%) were men and 19% were women. The age varied from 22 to 84 years, with a mean of 62 ± 10 years. Diabetic Nephropathy was the cause of end-stage renal disease in 64.3%. The first PET (’Early PET’) revealed the following transport characters-L in 17 (13.5%), LA in 87 (69%), HA in 20 (15.9%) and H in 2 (1.6%) patients.
Of the 126 patients, 115 patients (91.2%) had similar PET at 6th month. Only 11 patients (8.8%) had changes in their PET status compared to the first PET-4 changed from HA to LA, three changed from LA to L, and four changed from LA to HA [Table 1].

Comparison of the 4th h D/P creatinine and D4/D0 glucose values between the first and the 6th PET values between the unchanged and changed PET patients did not show any statistical significance. In the ’unchanged PET’ group of patients the mean creatinine and glucose values between the 2nd week PET (Early PET) and 6th month PET were 0.59 ± 0.14 vs. 0.62 ± 0.12 for creatinine (P = 0.26, NS) and 0.46 ± 0.12 vs. 0.46 ± 0.11 for sugar (P = 0.65). Similar values for patients with “changed PET” group of the patients were 0.56 ± 0.1 and 0.67 ± 0.1 for creatinine (P = 0.243, NS) and for sugar was 0.44 ± 0.1 and 0.37 ± 0.1 (P = 0.29, NS). The insignificant “P” value indicates that there were no statistically significant changes between the 2nd week PET (Early PET) and 6th month PET for sugar and creatinine values.
Data were also analyzed between 2nd week and 6th month PET using the Mcnemer bowker test. The P value was 0.22 indicating that there were no changes in the membrane characteristics. The levels of agreement between the PET measurements (D/P creatinine and D/D0 sugar) at 2nd week and 6th month were determined using the Bland-Altman analysis. This reveals a repeatability coefficient for creatinine and for sugar was 0.27 and 0.25 respectively that lies within 1.96 S.D indicating that there were no changes in the 2nd week and 6th month PET [Figure 1].
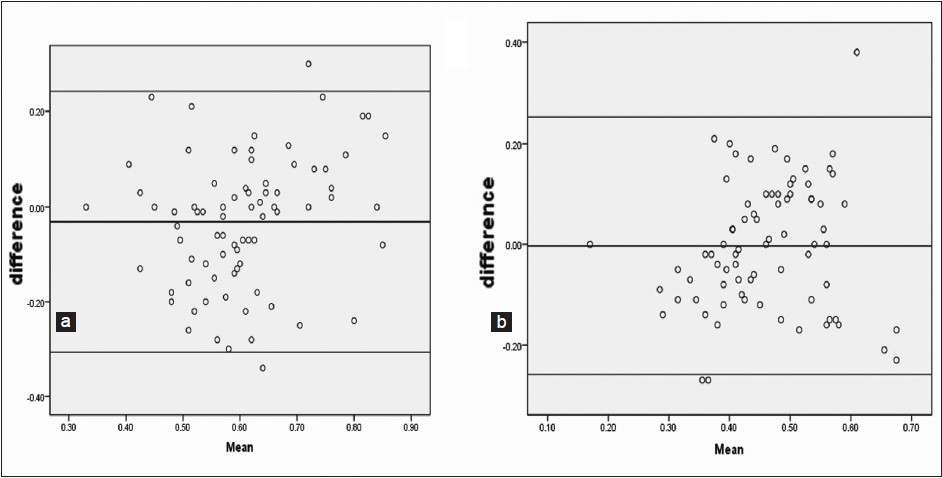
- Bland-Altman plot for (a) Creatinine (b) Sugar
Discussion
PET has gained significant importance ever since it was developed by Twardowski et al. The available guidelines recommend giving a break in period to allow wound healing and avoid peri-catheter leaks. The patient depends on hemodialysis toward control of uremia and fluid overload during this period. The guidelines also recommend waiting for 4-8 weeks to do the PET after starting the patient on PD. It is believed that in the initial days, there are local changes in the peritoneal membrane that alter the peritoneal blood flow and permeability that might influence the membrane transport. The factors responsible are the local cytokine production and dextrose in the dialysate.[17–19] During this waiting period, the patient who is initiated on dialysis is given an empirical dialysis prescription due to non-assessment of the membrane character.
Rej et al., noted high prevalence of LA and L transporters in Caucasians,[20] Cueto-Manzano et al.,[21] observed higher prevalence of LA and HA transporters in Mexican population. Chakravarthy et al., reported an increase in H transport status in Indian patients.[22] Abraham et al.,[23] analyzed 102 PD patients from four centers from India and found average transporters contributed to 91.1% (93 patients) and among them HA in 45 patients (44%) and LA in 48 patients (47%). Agarwal et al.,[24] analyzed the PET status in 41 patients and found 51% of patients were H transporters. In all these studies, the equilibration tests are performed as per the guidelines.
There are no studies that compare early PET results with that at a later date.
Our initial PET performed at 2 weeks showed the majority of our patients were average transporters. This is similar to the observations made by Abraham et al.,[23] In our study, 91.2% patients did not change their membrane transport character. Within this group analysis of the mean value for creatinine and sugar between the 2nd week and the 6th month values did not show significant variation. Even in the 11 patients in whom the membrane changed its character, the changes that are observed are confined to the adjacent transport status only. No major deviation was observed: No patient changed from L status to H status and vice versa. Even in this group when the mean values of creatinine and sugars were analyzed at 2 weeks and 6 months did not show significant variation.
The major advantage of our study is the large number of patients in our study population. This is in contrast to the previous studies. Rocco et al., studied 34 patients and 17 patients and Johnson et al., studied 50 patients. Both the groups performed the first PET earlier (<2 weeks and at 1st week) than our study and they had also proven that the 1st month PET correlated with the subsequent PET performed at 28 weeks and at the end of 1st year. Johnson et al., also concluded that the change in membrane character happens between 1 week and 4 weeks after PD initiation.
In conclusion, the results of our study indicate that PET done at 2nd week did not change significantly when compared to the PET carried out at 6th month. Hence early PET at 2nd week is a suitable option of doing the first PET measurement that allows a proper PD prescription to the patients.
Acknowledgment
We sincerely acknowledge Poorani D, Sangeetha S, Navya Mol Baby our PD nurses for their commitment and their efforts. We thank all our patients and their relatives for giving their consent for undergoing the PET evaluation and willingness to participate in the study. We thank Mr. Chandrasekaran R, Mrs. Annapoorani M and Ms. Sharmila S for their statistical assistance.
Source of Support: Nil
Conflict of Interest: None declared.
References
- The impact of peritoneal permeability and residual renal function on PD prescription. Perit Dial Int. 1996;16(Suppl 1):S147-52.
- [Google Scholar]
- Changes in peritoneal membrane transport rates in patients on long term CAPD. Adv Perit Dial. 1989;5:3-7.
- [Google Scholar]
- Changes of peritoneal membrane function during long-term CAPD. Adv Perit Dial. 1990;6:35-43.
- [Google Scholar]
- A prospective study of peritoneal transport in CAPD patients. Kidney Int. 1994;45:1739-44.
- [Google Scholar]
- Early and late peritoneal dialysate leaks in patients on CAPD. Adv Perit Dial. 1990;6:64-71.
- [Google Scholar]
- Survival and complications of 225 catheters used in continuous ambulatory peritoneal dialysis: One-center experience in Northern Greece. Perit Dial Int. 1999;19(Suppl 2):S167-71.
- [Google Scholar]
- Peritoneal access devices. In: Daugirdas JT, Blake PG, Ing TS, eds. Handbook of Dialysis (3rd ed). Philadelphia: Lippincott Williams and Wilkins; 2001. p. :309-32.
- [Google Scholar]
- Peritoneal dialysis access-related procedures by nephrologists. Semin Dial. 2004;17:398-406.
- [Google Scholar]
- Immediate initiation of CAPD following percutaneous catheter placement without break-in procedure. Perit Dial Int. 2007;27:179-83.
- [Google Scholar]
- Changes in peritoneal transport during the first month of peritoneal dialysis. Perit Dial Int. 1995;15:12-7.
- [Google Scholar]
- A comparison of peritoneal equilibration tests performed 1 and 4 weeks after PD commencement. Perit Dial Int. 2004;24:460-5.
- [Google Scholar]
- Contrasting effects of amphotericin B and the solvent sodium desoxycholate on peritoneal transport. Nephron. 1986;43:38-42.
- [Google Scholar]
- Altered permeability of the peritoneal membrane after using hypertonic peritoneal dialysis fluid. J Clin Invest. 1969;48:992-1001.
- [Google Scholar]
- Cytokine patterns in the effluent of continuous ambulatory peritoneal dialysis: Relationship to peritoneal permeability. Blood Purif. 1996;14:198-216.
- [Google Scholar]
- Ethnic variability in peritoneal equilibration test and urea kinetics. Am J Kidney Dis. 1997;30:374-81.
- [Google Scholar]
- Analysis of the peritoneal equilibration test in Mexico and factors influencing the peritoneal transport rate. Perit Dial Int. 1999;19:45-50.
- [Google Scholar]
- Pattern of peritoneal permeability in Indian CAPD population. J Indian Soc Perit Dial. 2002;4:19-23.
- [Google Scholar]
- Predictors of long-term survival on peritoneal dialysis in South India: A multicenter study. Perit Dial Int. 2010;30:29-34.
- [Google Scholar]
- Peritoneal equilibration test in Indian patients on continuous ambulatory peritoneal dialysis: Does it affect patient outcome? Adv Perit Dial. 2000;16:148-51.
- [Google Scholar]


