

Translate this page into:
Bone mineral density in patients with end-stage renal disease and its evolution after kidney transplantation
This is an open-access article distributed under the terms of the Creative Commons Attribution-Noncommercial-Share Alike 3.0 Unported, which permits unrestricted use, distribution, and reproduction in any medium, provided the original work is properly cited.
This article was originally published by Medknow Publications and was migrated to Scientific Scholar after the change of Publisher.
Abstract
Renal transplantation is associated with abnormalities of the structure and function of the musculoskeletal system. No data are available on bone health in Indian patients with end-stage renal disease (ESRD) and its evolution after transplantation. Consecutive ESRD patients who underwent living donor renal transplantation were studied prospectively. Bone mineral density (BMD) was measured at lumbar vertebrae using quantitative computed tomography (CT) scan before transplantation and after 3 and 6 months. T and Z scores were calculated by comparing with normal control data, and values were correlated with various clinical and biochemical parameters. Of the 56 patients enrolled (mean age, 33.7 years; 47 males), 40 completed the 6-month follow-up. The vertebral trabecular bone density at the time of transplantation was 172±53 mg/cc and the average Z score was 0.26±1.7. There was a significant decline in BMD at 3 months (11.8%; P<0.0001) and 6 months (16%; P<0.0001) after transplantation. Both T and Z scores showed a significant decline at 3 and 6 months. There was a significant decline in intact parathormone (iPTH) levels after transplantation, but 15 (37.5%) patients continued to have raised iPTH 6 months after transplantation. The iPTH levels at 6 months had significant correlation with BMD decline (r=0.43, P=0.006). We conclude that Indian ESRD patients have relatively well-preserved BMD, but the density declines rapidly after transplantation. A significant proportion of patients exhibit persistent hyperparathyroidism 6 months after transplantation, which correlates with bone loss.
Keywords
Bone mineral density
end-stage kidney disease
kidney transplantation
secondary hyperparathyroidism

Introduction
Decrease in bone mineral density (BMD) is a common occurrence in patients with chronic kidney disease (CKD), especially those on dialysis.[12] Despite correction in the kidney function following kidney transplantation, abnormalities persist in the structure and function of the musculoskeletal system.[3–7] Post transplant bone disease is a complex, multifactorial condition. According to pathogenesis and appearance time, this entity can be classified as being due to persistence of pretransplant disease, or de novo post-transplant bone disease after restoration of normal renal function.
A decline in BMD has been reported during the first 6-12 months after renal transplantation.[8–12] Bone loss occurs more in the trabecular bone (lumbar spine and femoral neck) than in the cortical bone (radius). Long-term kidney transplant recipients exhibit increased fracture risk; data from the United States Renal Data System (USRDS) database[13] showed hip fracture rates of 2.9/1000 in patients with end-stage renal disease (ESRD) and 3.3/1000 in patients after transplantation.[14]
Surveillance of BMD after transplantation and early identification of patients with osteopenia/osteoporosis might help initiate appropriate preventive measures to limit bone loss. It is also important to identify the risk factors associated with bone loss after transplantation. Traditionally, dual-energy X-ray absorptiometry (DEXA) scan has been used for estimation of BMD. In recent years, quantitative computerized tomography (qCT) has emerged as a superior alternative, with its advantage of three-dimensional volumetric measurement of bone density as well as the ability to selectively target the trabecular bone.[15] BMD studies have not been performed in Indian ESRD subjects, and data on complications of bone and mineral metabolism after transplantation are not available.
The aim of this study was to assess bone density by using qCT in Indian ESRD patients, to study its evolution during in the first 6 months after renal transplantation, and to identify the association of predefined clinical, biochemical, and immunosuppression-related variables with BMD.
Materials and Methods
A total of 56 consecutive patients with end-stage renal failure, who underwent living donor renal transplantation at the Postgraduate Institute of Medical Education and Research, Chandigarh, were enrolled in this prospective observational study. Patients with gross vertebral deformities or known vertebral fracture involving any of the lumbar vertebrae were excluded from the study. Institute Ethics Committee approved the study and all patients provided an informed consent.
All patients received calcineurin inhibitor (CNI)-based immunosuppression along with azathioprine or mycophenolate mofetil and prednisolone. Basiliximab was used as induction therapy in seven patients. Acute rejection was diagnosed by standard criteria on allograft biopsy and treated with 0.5-1 g methyl-prednisolone IV daily for 3 days. Steroid-resistant rejections were treated using anti-lymphocyte globulin (ALG) in a dose of 1-1.5 mg/kg/day for 10-14 days. None of the patients received any bisphosphonate or vitamin D supplements during the study period.
Serum calcium, inorganic phosphate, total alkaline phosphatase, and creatinine were measured using standard autoanalyzer technique at baseline and at 3 and 6 months after transplantation. Immulite intact parathormone (iPTH) (Diagnostic Products Corporation) assay was used for measurement of serum iPTH before transplantation and at 6 months.
BMD was assessed by single-energy qCT (GE Light Speed) using 10-mm axial sections at 120 kV and 160 mA. The measurements were done at baseline (within 1 month prior to transplantation) and at 3 and 6 months after transplantation. To identify patients who fulfilled the World Health Organization (WHO) criteria for osteoporosis or osteopenia, the T and Z scores were computed. T score of less than -2.5 was classified as osteoporosis and a T score between –1 to –2.5 was classified as osteopenia.
Data are expressed as mean±SD. Continuous data were compared using paired t test. For categorical variables, comparison of proportions was done using the Chi-square test. Pearson's correlation was used to assess the relationship between two variables. A two-tailed P value of <0.05 was considered significant.
Results
Of the 56 patients (47 men and 9 women) who were enrolled, 40 completed the 6-month follow-up. Five patients died during the study period, all of them due to severe opportunistic infections, and another nine patients went to other centers for follow-up and failed to report at the end of 6 months. ESRD was of unknown etiology in 26 cases, due to chronic glomerulonephritis (CGN) in 20 patients, chronic interstitial nephritis (CIN) in 5 patients, autosomal dominant polycystic kidney disease (ADPKD) in 2 patients, diabetic nephropathy in 2 patients, and primary hyperoxaluria in 1 patient. Fifty-two patients were on maintenance hemodialysis and one was on continuous ambulatory peritoneal dialysis (CAPD) and three patients underwent pre-emptive transplantation. The baseline demographic characteristics and laboratory values of the patients are summarized in Tables 1 and 2.


Twenty-one patients were started on a combination of cyclosporine, mycophenolate, and prednisolone; 19 on tacrolimus, azathioprine, and prednisolone; 13 on cyclosporine, azathioprine, and prednisolone; and 3 received tacrolimus, mycophenolate, and prednisolone. Mean cumulative doses (g) at 3 and 6 months after transplantation were 35±6.2 and 51.2±14.3 for cyclosporine, 1.16±0.49 and 1.95±0.91 for tacrolimus, and 2.69±1.49 and 3.64±1.59 for prednisolone, respectively. A total of 16 patients developed acute rejection, with three experiencing two episodes. Two patients required thymoglobulin. None of the patients developed any fractures during the follow-up period.
The vertebral trabecular bone density at the time of transplantation was 172±53 mg/cc and the average Z score was 0.26±1.7. There was a significant decline in BMD at 3 and 6 months after transplantation [Figure 1]. The mean fall in BMD was 11.8% after 3 months and 16% after 6 months. Both T and Z scores showed significant decline at 3 and 6 months [Figure 2]. Males and females experienced similar fall in BMD. Compared to baseline, more patients were osteopenic (T score between –1 and –2.5) at the end of 6 months [Table 3].
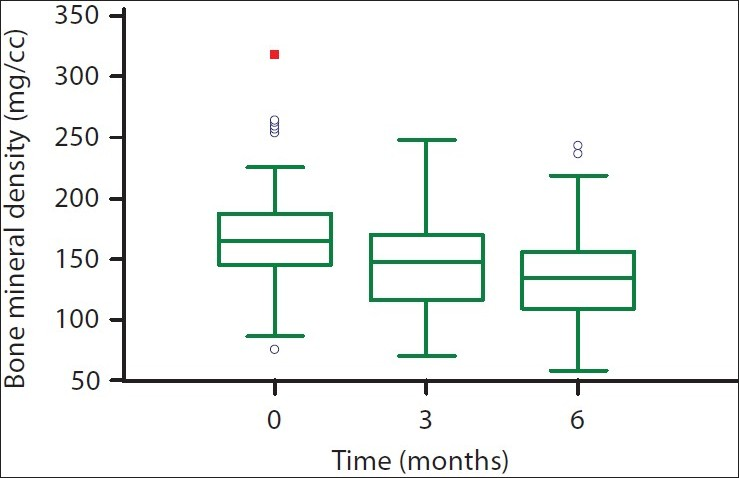
- Box-plot showing bone mineral density before transplantation and at 3 and 6 months after transplantation. The lower and upper bars represent the 10th and 90th centiles, respectively, and the interquartile range is indicated by the box, the median value being the horizontal line in the box
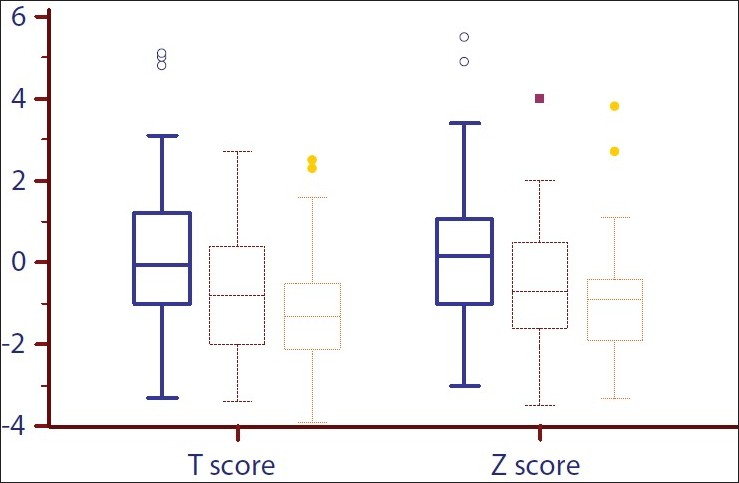
- Box-plot showing the distribution of T and Z scores before transplantation and at 3 and 6 months after transplantation. The lower and upper bars represent the 10th and 90th centiles, respectively, and the interquartile range is indicated by the box, the median value being the horizontal line in the box

The mean iPTH level at the time of transplantation was 265.4±257.7 pg/ml (range, 9-1350). There was a significant decline in iPTH levels 6 months after transplantation to 160.43 pg/ml (range, 72.9-843 pg/ ml). However, 15 (37.5%) patients continued to have significantly raised iPTH (more than twice the upper limit of normal) at 6 months. The mean 6-month BMD loss in these patients was 35.8 mg/cc compared with the mean BMD loss of 27.9 mg/cc for patients with normal iPTH at 6 months. There was no significant correlation between the pre- and post-transplant PTH values. As expected, the serum creatinine and inorganic phosphate levels showed a decline. There was a significant increase in total serum calcium (P<0.0001). However, the total alkaline phosphatase remained within the normal range, a significant rise was seen from the pre-transplant values (P=0.03).
No association was noted between the decline in BMD and pre-transplantation iPTH levels, cumulative dose of cyclosporine and tacrolimus and serum creatinine after transplantation. iPTH levels at 6 months had significant correlation with BMD decline (r=0.43, P=0.006), and the cumulative prednisolone dose had a marginal association (P=0.06). Patients with acute rejection experienced similar BMD loss compared to patients without any rejection episode. BMD loss was similar between patients who were on tacrolimus therapy and those on cyclosporine.
Discussion
The magnitude and pattern of CKD mineral bone disorder after kidney transplantation is less well documented than that among dialysis patients. This is the first study on bone density in patients with ESRD in India and evolution of the disease after transplantation; it also shows the presence of hyperparathyroidism in a significant proportion of ESRD patients. In a previous study from the southern part of India, hyperparathyroidism was reported only in about 30% of ESRD cases. We also show that even though bone mass is relatively well preserved at the time of transplant, there is a profound fall in lumbar vertebral BMD in the first 6 months after transplantation. The relative preservation of BMD at the time of transplantation in our population is likely due to the short duration of CKD and relatively young age profile. The decline in bone mass, T and Z scores, however, is more than those reported previously from Western countries.[8–12] Only a few of these studies were prospective in nature. Julian et al.[11] using single photon absorptiometry (SPA) noted a BMD decline of 6.8% at 6 months after transplantation. In another recent prospective study from the same center, Mikuls et al.[12] measured lumbar BMD using DEXA scan in 45 patients during transplantation and after 5.7 months, and noted a mean BMD decline of 2.4% at the lumbar spine. Although the cumulative cyclosporin A (CsA) and steroid dose in these two studies were comparable to that in the present study, the relatively minor degree of loss in bone mass noted in these studies could probably be due to the fact that the method employed in the previous two studies (SPA and DEXA) did not differentiate cortical from trabecular bone. Bone loss after renal transplantation occurs predominantly in trabecular bone, where the metabolic activity is maximal.[16] The qCT being a three-dimensional measurement can selectively target the trabecular bone. Since vertebral bodies contain a high proportion of trabecular bone, greater decrements in BMD were noted in this study. By regular standardization of BMD measurements using a quality assurance phantom, precision error in this study was ensured to be within 3%.
The BMD loss did not correlate with the cumulative prednisolone dose at 3 months, whereas a marginal association was noted at 6 months. In addition, patients who received pulse steroids did not show accelerated bone loss. Glucocorticoids induce osteopenia by decreasing osteoblast differentiation, increasing osteoblast apoptosis, increasing osteoclast activity, decreasing intestinal or renal calcium absorption, and by producing secondary hypogonadism.
A consistent association between BMD loss and steroid dose has not been shown.[8111718] In our study, a trend toward 6-month cumulative steroid dose and BMD was noted. It is possible that a statistically significant association could have emerged had a larger number of cases been studied. The effect of glucocorticoids may be modified by other factors, such as persistent HPT and simultaneous use of other drugs, such as CNI. Cumulative doses of both CsA and tacrolimus did not correlate with bone loss after transplantation. This neutral role of CsA and tacrolimus is consistent with previous observations in transplant recipients.[71719]
The correction of the uremic milieu including fall in serum phosphate and increase in serum calcium produced an expected decline in iPTH after 6 months. However, about 38% patients continued to have elevated iPTH at 6 months after transplantation despite good renal function, indicating the persistence of HPT. Further, though iPTH levels at the time of transplantation did not correlate with bone loss, iPTH levels 6 months after transplantation were associated with increased loss of bone density. Severe hyperparathyroidism at the time of transplantation[8920] as well as persistent post-transplant hyperparathyroidism[21–23] have been shown to be risk factors for post-transplantation osteopenia. Histological studies have shown persistent parathyroid hyperplasia in large numbers of patients after transplantation.[1624–26] Although some of it could be due to persistence of stimuli for parathyroid hormone secretion (in patients with graft dysfunction) or due to slow involution of the hyperplastic parathyroid glands. Our patients exhibited good graft function, and we could not find a significant correlation between the pre- and post-transplant iPTH values. The results of this study support the hypothesis that HPT after transplantation contributes to trabecular bone loss after renal transplantation. It is likely that new post-transplant factors were operational. We did not measure vitamin D levels in this study. In one study, 25(OH) vitamin D levels correlated with iPTH values 44 months after transplantation. Previously, we have shown near universal vitamin D deficiency in Indian CKD subjects, and its significant association with iPTH levels in apparently healthy subjects.[27] It is possible that this deficiency could have contributed to stimulation of parathyroid gland after normalization of kidney function.
Whether BMD should be routinely measured following transplantation is not clear. In general, BMD has been shown to be a poor predictor of fracture risk in CKD subjects. However, one study using DEXA scan showed that low BMD was predictive of fracture risk in renal transplant recipients. On the basis of relatively low quality evidence, the Kidney Disease: Improving Global Outcomes (KDIGO) guidelines recommend measurement of MBD for 3 months following transplantation.[28] Our data support this recommendation and suggest that this period may need to be extended since the BMD loss continues for at least 6 months.
Our study is limited by small sample size, which does not allow us to generalize the results. Future studies with larger sample size would allow conclusions with greater confidence. Moreover, BMD only measures bone mass, it does not give sufficient information about bone quality that is also impacted by turnover. We also did not see any clinically significant event such as fracture during the follow-up period and these patients need to be followed up to check if there is an increase in fracture rates.
In conclusion, Indian ESRD patients have relatively preserved BMD at the time of transplantation. The bone density declines rapidly after transplantation; bone loss is evident 3 months after transplantation and continues for at least 6 months. A significant proportion of patients have persistent HPT for as long as 6 months after transplantation. This persistent HPT may account for the early bone loss after transplantation.
Source of Support: Vivekanand Jha has grant support from ICMR and DBT, Government of India
Conflict of Interest: None declared.
References
- Bone mineral density in patients with end-stage renal failure. Am J Nephrol. 1993;13:115-23.
- [Google Scholar]
- Bone mineral density and biochemical markers of bone turnover in patients with predialysis chronic renal failure. Kidney Int. 1999;56:1084-93.
- [Google Scholar]
- Disorders of bone and mineral metabolism after renal transplantation. Kidney Int. 1997;52:1412-21.
- [Google Scholar]
- Loss of regional bone mineral density in the first 12 months following renal transplantation. Nephron. 1994;66:52-7.
- [Google Scholar]
- Bone loss after kidney transplantation: A longitudinal study in 115 graft recipients. Nephrol Dial Transplant. 1995;10:2096-100.
- [Google Scholar]
- Changes in bone mass early after kidney transplantation. J Bone Miner Res. 1994;9:1-9.
- [Google Scholar]
- Musculoskeletal complications after renal transplantation: Pathogenesis and treatment. Am J Kidney Dis. 1992;19:99-120.
- [Google Scholar]
- Bone mineral density changes within six months of renal transplantation. Transplantation. 2003;75:49-54.
- [Google Scholar]
- Risk of hip fracture among dialysis and renal transplant recipients. JAMA. 2002;288:3014-8.
- [Google Scholar]
- Analysis of fracture prevalence in kidney-pancreas allograft recipients. J Am Soc Nephrol. 1998;9:677-83.
- [Google Scholar]
- Bone mineral status after renal transplantation.Assessment by noninvasive techniques. Invest Radiol. 1994;29:127-33.
- [Google Scholar]
- Prevention of cancellous bone loss but persistence of renal bone disease despite normal 1,25 vitamin D levels two years after kidney transplantation. Transplantation. 1995;59:1393-400.
- [Google Scholar]
- Effects of three immunosuppressive regimens on vertebral bone density in renal transplant recipients: A prospective study. Transplantation. 1997;63:380-6.
- [Google Scholar]
- Bone mineral density after renal transplantation. Transplant Proc. 1998;30:3029-30.
- [Google Scholar]
- Long-term bone loss after renal transplantation: Comparison of immunosuppressive regimens. Clin Transplant. 1995;9:20-4.
- [Google Scholar]
- Changes in bone mineral density over 18 months following kidney transplantation: The respective roles of prednisone and parathyroid hormone. Nephrol Dial Transplant. 2002;17:1318-26.
- [Google Scholar]
- Bone loss after renal transplantation: Role of hyperparathyroidism, acidosis, cyclosporine and systemic disease. Clin Transplant. 2000;14:457-63.
- [Google Scholar]
- Hyperparathyroidism and long-term bone loss after renal transplantation. Clin Transplant. 2003;17:268-74.
- [Google Scholar]
- Calcium metabolism and skeletal problems after transplantation. J Am Soc Nephrol. 2002;13:551-8.
- [Google Scholar]
- Cross-sectional analysis of renal transplantation osteoporosis. J Bone Miner Res. 1999;14:1943-51.
- [Google Scholar]
- Bone disease in children and adolescents undergoing successful renal transplantation. Kidney Int. 1998;53:1358-64.
- [Google Scholar]
- Influence of vitamin D receptor genotype on bone mass changes after renal transplantation. Kidney Int. 1996;50:1726-33.
- [Google Scholar]
- High prevalence of vitamin D deficiency in north Indian adults is exacerbated in those with chronic kidney disease. Nephrology (Carlton). 2009;14:345-9.
- [Google Scholar]
- KDIGO clinical practice guideline for the care of kidney transplant recipients: A summary. Kidney Int. 2009;77:299-311.
- [Google Scholar]


