

Translate this page into:
Association between high molecular weight apolipoprotein isoforms and lipoprotein levels in advanced chronic kidney disease and the effect of hemodialysis
This is an open-access article distributed under the terms of the Creative Commons Attribution-Noncommercial-Share Alike 3.0 Unported, which permits unrestricted use, distribution, and reproduction in any medium, provided the original work is properly cited.
This article was originally published by Medknow Publications & Media Pvt Ltd and was migrated to Scientific Scholar after the change of Publisher.
Abstract
To explore the association between high molecular weight apo(a) isoforms and lipoprotein(a) [Lp(a)] in chronic kidney disease (CKD) and the effect of maintenance hemodialysis (MHD), plasma Lp(a) and apo(a) isoforms were determined in age and sex-matched CKD stage 4 and stage 5 patients (repeated after 4 weeks of MHD) and healthy controls (n = 18). Median Lp(a) increased with severity of CKD. Upon HMW apo(a) isoform stratification, Lp(a) in S2 isoform group was 37.6 mg/dl in CKD stage 4 and 64.0 mg/dl in stage 5 (P < 0.024 and P < 0.001 vs. controls), whereas in S3 + S4 group there was no significant increase. Following MHD, Lp(a) also decreased significantly only in the S2 group. Increase in Lp(a) in CKD patients with HMW apo(a) isoforms is mainly restricted to S2 isoform group, furthermore, decrease in Lp(a) levels in response to MHD is also seen in this group only.
Keywords
Apo(a) isoforms
chronic kidney disease
lipoprotein(a)
maintenance hemodialysis

Introduction
Chronic kidney disease (CKD) is associated with significant morbidity and mortality due to accelerated atherosclerosis and increased risk of coronary artery disease (CAD).[1] CKD patients suffer from a secondary form of complex dyslipidemia.[2] Few case-control studies have also reported high levels of lipoprotein(a) (Lp[a]), an atherogenic lipoprotein in patients with CKD.[3]
Epidemiological, case-control, and prospective studies in western populations as well as Indians have reported Lp(a) to be an important risk-factor for CAD.[4–7] Lp(a) is a modified low-density lipoprotein (LDL) having a highly glycosylated apolipoprotein(a) (apo[a]).[8] Apo(a) shows a high degree of genetic polymorphism, resulting from a variable number of kringle-IV type 2 (K-IV type 2) repeats. At least thirty-four different apo(a) isoforms have been identified which can be grouped into low (LMW) and high molecular weight (HMW) isoforms according to the number of K-IV repeats in the apo(a) molecule.[9]
Adult Lp(a) levels are attained in early childhood and remain constant in healthy individuals throughout life, and are usually not affected by diet, age, and other environmental factors.[10] However, CKD is an important non-genetic, secondary cause of increase in plasma Lp(a) levels,[3] which start rising in early stages and become more pronounced in later stages.[11–13] There are no suitable interventions or therapies available to decrease plasma Lp(a) levels; however, we have shown a variable decrease in plasma Lp(a) after starting maintenance hemodialysis (MHD).[12]
The reasons for variable increase in Lp(a) levels in kidney disease and decline in response to hemodialysis are not clear. Dieplinger et al.[14] have reported apo(a) phenotype-dependent alterations in Lp(a) levels in patients with renal disease, showing that patients with HMW apo(a) isoforms have elevated Lp(a) levels as compared to apo(a) phenotype-matched controls. Kronenberg et al.,[15] have also shown higher Lp(a) levels in CKD which negatively correlated with glomerular filtration rate (GFR) only in patients with HMW apo(a) isoforms. Parsons et al.,[16] have also reported higher median Lp(a) levels in patients with CKD having HMW apo(a) isoforms; however, in their study, a significant proportion of CKD patients with HMW isoforms had Lp(a) levels lower than 10 mg/dl. However, the reason for this discrepancy has not been elucidated. Therefore, the present study was aimed at determining the relationship of Lp(a) levels with HMW apo(a) isoforms in CKD patients with special reference to study; (a) the association with severity of CKD, (b) response to MHD, and (c) the basis for discrepancy between Lp(a) levels and HMW isoform pattern.
Materials and Methods
Study subjects
Initially, 40 patients with chronic kidney disease were recruited in the study. The renal diagnosis was: Chronic glomerulonephritis, chronic tubulointerstitial nephritis, hypertensive renal disease, and miscellaneous/unknown causes. The patients were grouped according to the stage of CKD, as per the National Kidney Foundation K-DOQI guidelines on the basis of GFR by the prediction equation of Levey et al.,[17] into CKD stage 4 (15-29 ml/min/1.73 m2) and CKD stage 5 (<15 ml/min/1.73 m2). Apo(a) isoforms were determined in all the subjects, there were only four patients with low molecular weight (LMW, ≤22 K-IV repeats) and 36 with high molecular weight (HMW, ≥23 K-IV repeats) apo(a) isoforms. Patients having HMW isoforms were divided into stage 4 CKD (n = 18) and stage 5 CKD (n = 18) and included in the study. Similarly, 18 healthy controls matched for isoform pattern (HMW) within ±1 K-IV repeat were also included. Patients with CKD stage 5 were subjected to MHD for 4 weeks following which, repeat blood samples were taken. Subjects with diabetes mellitus, familial lipid disorders, or having a recent history of infection during the preceding three weeks, and patients who had been on hemodialysis or peritoneal dialysis previously were also excluded. The study was approved by the Institutional Ethical Committee for Human Research, and all the subjects gave written informed consent.
Laboratory measurements
Blood samples from all the participants were taken in EDTA vials after a 12-h overnight fast at entry and following 4 weeks of MHD. After centrifugation at 4°C, EDTA plasma was separated and samples were kept at 80°C before analysis for Lp(a) and apo(a) isoforms. Fresh plasma samples were analyzed for routine parameters like urea, creatinine, albumin, and lipid profile using standard kits (Accurax, Mumbai, India) on Synchron Cx4 analyzer. LDL-cholesterol was calculated by the formula of Friedwald et al.[18]
Determination of Lp(a) and apo(a) isoform size polymorphism
Plasma Lp(a) quantitation was performed with a double-antibody-linked immunoassay using ELISA kits (Elitest ELISA, Hyphen Biomed, France). Different apo(a) isoforms were separated according to size by Western blotting as described previously[7] using high-resolution agarose gels (15 × 25 cm). Apo(a) isoform size was determined according to the number of K-IV repeats in their sequence as determined by co-migration with apo(a) standards. The apo(a) spots in an individual (single or double band) were further classified as low molecular weight (LMW; ≤22 K-IV repeats) and high molecular weight (HMW ≥ 23 K-IV repeats) apo(a) isoforms.[19] In this study, all the subjects expressing only HMW apo(a) isoforms were included which were further categorized according to the classification system described by Kraft et al.,[20] into isoform group S2, which will be referred to as intermediate molecular weight isoforms (IMW; 23-27 K-IV repeats) and S3 and S4 as high molecular weight isoforms (HMW; 28-31 K-IV repeats and >31 K-IV repeats, respectively).
Statistical analysis
Values are represented as mean ± SD. Student's ‘t’ test was used for the comparison of normally distributed variables. Lp(a) values were compared using Mann-Whitney U-test because of their highly skewed distribution. Kruskal-Wallis analysis was used to compare Lp(a) values among the three groups. Pairwise comparison was done by Mann-Whitney U-test with Benferronic correction to compare Lp(a) levels before and 4 weeks after hemodialysis and two-tailed P < 0.05 was considered significant (Wilcoxon Signed ranks test).
Results
The subjects in all the study groups were age- and sex-matched [Table 1]. There was no significant difference in body mass index and waist-hip ratio among the study groups, as well as the duration of disease in CKD stage 4 and stage 5 patients.

Lp(a) levels in chronic kidney disease patients and relation to Apo(a) isoform groups
Lp(a) levels (mean and median) were higher in patients with CKD; however, it attained statistical significance only in CKD stage 5 when compared to control group (P < 0.009) [Table 2]. Lp(a) values more than 30 mg/dl were observed in 51 percent of the CKD patients whereas none of the healthy controls had Lp(a) levels more than 30 mg/dl. Furthermore, it was observed that despite higher mean and median Lp(a) levels, a considerable proportion (>25%) of CKD patients had Lp(a) levels below the median of the control group, i.e., 13.4 mg/dl.

Therefore, in order to get an insight into the variable increase in Lp(a) levels in patients with CKD and its relationship with apo(a) isoform size, all the study groups were further sub-divided according to apo(a) isoform size into S2(IMW; 23-27 K-IV repeats) and S3 + S4 (HMW ≥ 28 K-IV repeats) subgroups. There was a significant increase in mean and median Lp(a) levels in patients with S2 isoform (IMW) with progression in severity of CKD. Accordingly, the highest levels were found in patients with stage 4 and 5 CKD as compared to controls (P < 0.024 and P < 0.001, respectively) [Table 2, Figure 1]. However in S3 + S4 (HMW) apo(a) isoform sub-group, there was a slight but insignificant increase in Lp(a) levels in patients as compared to controls. Moreover, all the patients having low Lp(a) levels, i.e., less than 13.4 mg/dl were present in S3 + S4 isoform sub-group. Intra-group comparison showed that Lp(a) levels were significantly higher in IMW group as compared to HMW group in both the sub-groups of patients with CKD stage 4 and 5 (P < 0.01). However, in both the sub-groups of healthy controls having S2 (IMW) or S3 + S4 (HMW) isoforms, no significant difference in the mean and median Lp(a) levels was observed.
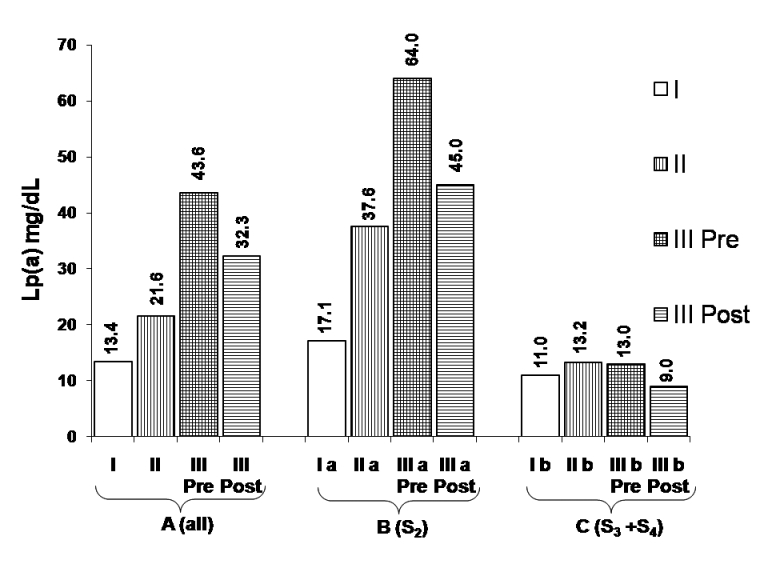
- Comparison of median Lp(a) levels in chronic kidney disease patients in (a) all; (b) S2, and (c) S3 + S4 isoform groups (adopted from median values shown in Table 2)
Effect of maintenance hemodialysis on Lp(a) levels
In patients with CKD stage 5, mean and median Lp(a) levels showed a significant decrease after MHD (P < 0.001, group III pre- vs. post-dialysis, Wilcoxon Signed Rank's test) which ranged from 2.5% to 61.2% with a mean decline of 23.2%. The absolute and percentage decline in Lp(a) levels following 4 weeks of MHD in the whole group, S2 (IMW) and S3 + S4 (HMW) sub-groups was found to be 10.9 mg/dl (25%, P < 0.001), 16.4 mg/dl (26.7 %, P < 0.005) and 3.9 mg/dl (17.4%, P value NS) respectively. Median Lp(a) values in all the groups are depicted in Figure 1.
These results suggest that with increase in severity of kidney disease, there is a progressive increase in Lp(a) levels; however, it is largely determined by apo(a) isoforms belonging to S2 (IMW) sub-group, whereas apo(a) isoforms belonging to S3 + S4 (HMW) sub-group do not contribute significantly toward increased Lp(a) levels. The response to MHD also seems to be influenced by similar criteria. This may explain why no uniform increase in Lp(a) levels has been observed across the whole spectrum of HMW apo(a) isoforms in the present study and the studies reported earlier.
Lipid profile parameters in patients with chronic kidney disease and the effect of maintenance hemodialysis
Triglycerides and LDL-C were significantly higher in CKD stage 4 (P < 0.05) and stage 5 (P < 0.001) patients as compared to control group [Table 3]. Total cholesterol was significantly higher (P < 0.05) in CKD stage 5. HDL-C was significantly lower (P < 0.05) and LDL/HDL ratio significantly higher (P < 0.05) in CKD stage 4 and stage 5 patients in comparison to controls. There was a significant decrease in TC, TG, and LDL-C (P < 0.05 for all) in stage 5 CKD after 4 weeks of hemodialysis; however, there was no significant difference in HDL-C levels before and after 4 weeks of dialysis in the stage 5 group.

Discussion
Patients with CKD frequently have abnormalities of lipoprotein structure and metabolism, particularly hypertriglyceridemia and low HDL-cholesterol.[2] Higher levels of Lp(a) having negative correlation with GFR have also been reported in these patients, which further increases the risk of cardiovascular disease (CVD).[15] The present study has attempted to elucidate the basis of variable increase in plasma Lp(a) levels in patients with CKD. To the best of our knowledge, this is the first study in Indian ethnic group addressing the relationship of Lp(a) levels with reference to apo(a) isoform size in advanced stages of CKD and response to MHD. As ninety percent of CKD patients initially recruited for this study had HMW apo(a) isoforms (≥23 K-IV repeats), the study was confined to subjects having HMW isoforms. Patients with stage 5 CKD were taken up for MHD and they served as their own isoform-matched controls (pre- vs. post-dialysis samples).
The discovery of Apo(a) gene polymorphism was the landmark which provided major insights into the genetic control of plasma Lp(a) levels, and thus identified the former as the major factor determining Lp(a) levels.[2021] LMW apo(a) isoforms are associated with higher Lp(a) levels and vice versa in general population.[8] Furthermore, the Lp(a) levels are determined by the rate of synthesis in liver rather than their catabolism.[22]
CKD is one important factor associated with higher Lp(a) levels,[3] and restoring kidney function by transplantation leads to a decrease in Lp(a) levels.[23] In the present study, a progressive but variable increase in plasma Lp(a) levels was observed. Further Lp(a) levels showed a variable decline (2.5-61.2%) in response to 4 weeks of MHD. Thus, to understand the basis of this variation, the relationship between Lp(a) levels and apo(a) isoforms was investigated in the study groups. On further stratifying the patients according to the isoform groups into S2 (23-27 K-IV), S3 (28-31 K-IV) + S4 (>31 K-IV), we observed the highest level of Lp(a) in S2 isoform group which also showed a higher percentage decline after MHD. Thus, we report for the first time, that even among the HMW apo(a) isoforms the S2 group having 23-27 K-IV repeats shows the highest increase in Lp(a) levels, these can also be referred to as intermediate molecular weight (IMW) apo(a) isoforms, a term which has been identified as a distinct entity.[2024] However, the isoform groups S3 + S4 (≥28 K-IV repeats) appeared to behave differently and did not show significant increase of Lp(a) as compared to isoform-matched controls. Gaw et al.[25] have also shown that large-sized apo(a) isoforms (≥28 K-IV) are associated with lower Lp(a) levels, which is consistent with the observation that large size apo(a) isoforms are secreted at lower rates by the liver,[22] and therefore, are associated with low serum Lp(a) levels.
Kidney seems to play a role in the catabolism and excretion of apo(a),[26] which is supported by the excretion of apo(a) fragments in urine.[2728] Furthermore, circulating levels of HMW apo(a) isoforms may also be modulated by kidney function, as kidney seems to be involved in the clearing of a specific type of HMW apo(a) isoforms.[232930] Therefore, the decrease in Lp(a) levels following MHD for 4 weeks seen in stage 5 CKD patients belonging to S2 isoform in the present study may be related to the removal of apo(a) fragments.
Dieplinger et al.[14] and Kronenberg et al.,[15] have shown a relative increase in Lp(a) levels in patients with HMW apo(a) phenotypes as compared to matched controls but not in LMW apo(a) phenotypes. Furthermore, in a prospective study involving 154 patients, the average plasma Lp(a) concentration decreased during the first 3 weeks following kidney transplantation only in the group having HMW apo(a) phenotypes.[23] In contrast, two smaller case-control studies have observed an elevation of plasma Lp(a) levels across all the phenotype groups.[3031] The inclusion of apo(a) isoforms with 23-25 K-IV repeats (~S2) in the LMW subgroup[31] might have influenced the outcome of these studies.
Conclusions
We have compared the Lp(a) levels in isoform-matched groups (S2, S3 + S4) among HMW apo(a) isoforms in stage 4 and 5. The results suggest that even among HMW apo(a) isoforms, there is a significant increase in Lp(a) levels in S2 (23-27 K-IV repeats) isoform group only as compared to isoform-matched controls, whereas the Lp(a) levels did not increase significantly in S3 + S4 group. These findings may explain the reason for conflicting results reported by other workers where all HMW isoforms have been considered as one group. Thus, apo(a) isoforms with 23-27 K-IV repeats (S2) behave as a distinct entity in CKD and in response to MHD, therefore, these should not be clubbed with other HMW apo(a) isoforms. Increase in Lp(a) levels along with other lipid abnormalities may predispose these patients to CAD; however, MHD is able to effectively decrease Lp(a) levels.
This work was supported by financial grant from Indian Council of Medical Research, New Delhi (52/10/98 - BMS IRIS No 9801760) to Dr. JK Gambhir.
Source of Support: Indian Council of Medical Research, New Delhi (52/10/98 – BMS IRIS No 9801760)
Conflict of Interest: None declared.
References
- U.S. Renal Data System. In: USRDS Annual Data Report. Bethesda, MD: National Institutes of Health, National Institute of Diabetes and Digestive and Kidney Diseases; 1998.
- [Google Scholar]
- Lipid abnormalities in maintenance dialysis patients and renal transplant recipients. Kidney Int Suppl. 1978;14:S72-8.
- [Google Scholar]
- Lipoprotein(a) and coronary heart disease. Meta-analysis of prospective studies. Circulation. 2000;102:1082-5.
- [Google Scholar]
- Lipoprotein(a) as an independent risk factor for coronary artery disease in patients below 40 years of age. Indian Heart J. 2000;52:411-5.
- [Google Scholar]
- Evaluation of Lp[a] and other independent risk factors for CHD in Asian Indians and their USA counterparts. J Lipid Res. 2001;42:631-8.
- [Google Scholar]
- Association between lipoprotein(a) levels, apo(a) isoforms and family history of premature CAD in young Asian Indians. Clin Biochem. 2008;41:453-8.
- [Google Scholar]
- Lp(a) glycoprotein phenotypes. Inheritance and relation to Lp(a)-lipoprotein concentrations in plasma. J Clin Invest. 1987;80:458-65.
- [Google Scholar]
- Effects of the apolipoprotein(a) size polymorphism on the lipoprotein(a) concentration in 7 ethnic groups. Hum Genet. 1991;86:607-14.
- [Google Scholar]
- Increased serum lipoprotein(a) levels in patients with early renal failure. Ann Intern Med. 1999;130:1028-9.
- [Google Scholar]
- Lipoprotein(a) in chronic renal failure: effect of maintenance hemodialysis. Hemodial Int. 2003;7:326-31.
- [Google Scholar]
- In vivo turnover study demonstrates diminished clearance of lipoprotein(a) in hemodialysis patients. Kidney Int. 2007;71:1036-43.
- [Google Scholar]
- Elevated plasma concentrations of lipoprotein(a) in patients with end-stage renal disease are not related to the size polymorphism of apolipoprotein(a) J Clin Invest. 1993;91:397-401.
- [Google Scholar]
- Lipoprotein(a) serum concentrations and apolipoprotein(a) phenotypes in mild and moderate renal failure. J Am Soc Nephrol. 2000;11:105-15.
- [Google Scholar]
- Lipoprotein(a) levels in those with high molecular weight apo(a) isoforms may remain low in a significant proportion of patients with end-stage renal disease. Nephrol Dial Transplant. 2003;18:1848-53.
- [Google Scholar]
- A more accurate method to estimate glomerular filtration rate from serum creatinine: a new prediction equation. Modification of Diet in Renal Disease Study Group. Ann Intern Med. 1999;130:461-70.
- [Google Scholar]
- Estimation of the concentration of low-density lipoprotein cholesterol in plasma, without use of the preparative ultracentrifuge. Clin Chem. 1972;18:499-502.
- [Google Scholar]
- Role of lipoprotein(a) and apolipoprotein(a) phenotype in atherogenesis: Prospective results from the Bruneck study. Circulation. 1999;100:1154-60.
- [Google Scholar]
- The apolipoprotein(a) gene: A transcribed hypervariable locus controlling plasma lipoprotein(a) concentration. Hum Genet. 1992;90:220-30.
- [Google Scholar]
- Molecular basis of apolipoprotein(a) isoform size heterogeneity as revealed by pulsed-field gel electrophoresis. J Clin Invest. 1991;87:2153-61.
- [Google Scholar]
- The inverse association of plasma lipoprotein(a) concentrations with apolipoprotein(a) isoform size is not due to differences in Lp(a) catabolism but to differences in production rate. J Clin Invest. 1994;93:2758-63.
- [Google Scholar]
- Apolipoprotein(a) phenotype-associated decrease in lipoprotein(a) plasma concentrations after renal transplantation. Arterioscler Thromb. 1994;14:1399-404.
- [Google Scholar]
- Apolipoprotein(a) polymorphism and its association with plasma lipoprotein(a) levels: A north Indian study. Indian Heart J. 2000;52:165-70.
- [Google Scholar]
- Comparative analysis of the apo(a) gene, apo(a) glycoprotein, and plasma concentrations of Lp(a) in three ethnic groups. Evidence for no common “null” allele at the apo(a) locus. J Clin Invest. 1994;93:2526-34.
- [Google Scholar]
- Renovascular arteriovenous differences in Lp[a] plasma concentrations suggest removal of Lp[a] from the renal circulation. J Lipid Res. 1997;38:1755-63.
- [Google Scholar]
- Kringle-containing fragments of apolipoprotein(a) circulate in human plasma and are excreted into the urine. J Clin Invest. 1996;98:2414-24.
- [Google Scholar]
- Urinary excretion of apolipoprotein(a): relation to other plasma proteins. Clin Chim Acta. 2001;304:29-37.
- [Google Scholar]
- Serum lipoprotein(a) concentration and Apo(a) isoform under the condition of renal dysfunction. J Atheroscler Thromb. 2003;10:283-9.
- [Google Scholar]
- Apolipoprotein(a) phenotypes and lipoprotein(a) concentrations in patients with renal failure. Am J Kidney Dis. 1999;33:1100-6.
- [Google Scholar]
- Increased plasma concentrations of lipoprotein(a) for every phenotype of apolipoprotein(a) in patients with chronic renal failure treated by hemodialysis. Nutr Metab Cardiovasc Dis. 1996;6:203-10.
- [Google Scholar]


