

Translate this page into:
Noninvasive assessment of bone health in Indian patients with chronic kidney disease
This is an open-access article distributed under the terms of the Creative Commons Attribution-Noncommercial-Share Alike 3.0 Unported, which permits unrestricted use, distribution, and reproduction in any medium, provided the original work is properly cited.
This article was originally published by Medknow Publications & Media Pvt Ltd and was migrated to Scientific Scholar after the change of Publisher.
Abstract
Abnormalities in mineral and bone disease are common in chronic kidney disease (CKD). Evaluation of bone health requires measurement of parameters of bone turnover, mineralization, and volume. There are no data on bone health in CKD patients from India. In this cross-sectional study, we evaluated serum biomarkers of bone turnover: Bone-specific alkaline phosphatase (BAP) and total deoxypyridinoline (tDPD) along with parathyroid hormone, 25(OH) vitamin D, and bone mineral density (BMD) using dual absorption X-ray absorptiometry in a cohort of 74 treatment-naive patients with newly diagnosed stage 4 and 5 CKD (age 42 ± 14.5 years, 54 men) and 52 non-CKD volunteers (age 40.2 ± 9.3 years, 40 men). Compared to the controls, CKD subjects showed elevated intact PTH (iPTH), BAP, and tDPD and lower BMD. There was a strong correlation between iPTH and BAP (r = 0.88, P < 0.0001), iPTH and tDPD (r = 0.51, P < 0.0001), and BAP and tDPD (r = 0.46, P = 0.0004). The iPTH elevation was greater than twice the upper range of normal in 73% cases, and BAP was >40 U/L in 66% cases. The combination of these markers suggests high turnover bone disease in over 60% cases. The prevalence of osteopenia and osteoporosis was 37% and 12%, respectively. Osteoporotic subjects had higher iPTH, BAP, and tDPD, suggesting a role of high turnover in genesis of osteoporosis. Vitamin D deficiency was seen in 80%, and another 13% had insufficient levels. Vitamin D correlated inversely with BAP (r = −0.3, P = 0.009), and levels were lower in those with iPTH >300 pg/ml (P = 0.0.04). In conclusion, over 60% of newly diagnosed Indian stage 4–5 CKD patients show biochemical parameters consistent with high turnover bone disease. High turnover could contribute to the development of osteoporosis in CKD subjects. Deficiency of 25 (OH) vitamin D is widespread and seems to have a role in the genesis of renal bone disease. Studies on the effect of supplementation of native vitamin D are needed.
Keywords
Bone mineral density
bone-specific alkaline phosphatase
chronic kidney disease
deoxypyrinolidine
parathyroid hormone
renal osteodystrophy
vitamin D

Introduction
Disturbances in mineral metabolism and bone disease are common, cause considerable morbidity, and decrease quality of life in patients with chronic kidney disease (CKD).[1–3] Renal osteodystrophy (ROD) is a component of the broad spectrum of mineral and bone disorders of CKD (CKD-MBD).[4] Assessment of bone health is required for adjustment of therapy for abnormal mineral metabolism, to evaluate fracture risk, and for deciding if osteoporosis treatment is required. Bone biopsy, the gold standard for accurately classifying the type of ROD, is invasive, is difficult to repeat, requires specialized equipment, and must be evaluated by someone experienced in bone histomorphometry.
Attempts have been made to develop methods for noninvasive assessment of bone health in terms of turnover and mass.[4] Bone turnover involves tightly coordinated bone formation and resorption. ROD is a multifactorial process in which one of the phenomena is decoupling between these two processes. Traditionally, parathyroid hormone (PTH) has been considered to be a surrogate for bone turnover. However, circulating PTH alone does not clearly distinguish adynamic or normal bone from hyperparathyroid bone disease,[56] and is now regarded as a marker of parathyroid activity rather than bone turnover. It has been suggested that a combination of molecules that are synthesized during bone formation and protein fragments released as a result of matrix breakdown during bone resorption might serve as circulating biochemical markers of bone turnover.[7–9]
Of the various markers of bone formation such as osteocalcin, total alkaline phosphatase (TAP), bone-specific alkaline phosphatase (BAP), and procollagen type-1 carboxy and amino terminal peptides, BAP is accepted as the most sensitive and consistent in distinguishing the type of bone disease and estimating the bone formation rate.[1011] It is unclear, however, whether it can be used to separate patients with adynamic bone disease from those with normal bone remodeling. A number of matrix breakdown products have been evaluated as markers of bone resorption; these include pyridinoline and deoxypyridinoline (DPD), tartrate-sensitive acid phosphatase, type 1 collagen amino and carboxy terminal products, hydroxyproline, and collagen 1, a helicoidal peptide in blood and urine.[1012] Relative studies of their performance in distinguishing types of bone disease suggest DPD to be superior to others.[1213]
Lack of sufficient vitamin D in its native form, as reflected by low circulating 25(OH) vitamin D concentrations, is frequent in CKD patients.[1415] 25(OH) vitamin D is now recognized as an important player in maintenance of bone health in CKD. Guidelines recommend regular measurement of 25(OH) vitamin D concentration and supplementation if levels fall below 30 ng/ml.[16]
Use of these markers, either as such or in combination with bone mineral density (BMD) estimation, has the potential of improving the diagnosis and the treatment of ROD. Such studies have been carried out in the Western population.[17–19] Because of differences in dietary habits (high proportion of vegetarians), body composition, and racial and genetic background, it is possible that Indians would exhibit a different pattern of abnormalities in CKD-MBD. We estimated the intact PTH (iPTH), total deoxypyridinoline (tDPD), BAP, and 25(OH) vitamin D levels, and measured BMD in a cohort of Indian CKD patients.
Materials and Methods
This cross-sectional descriptive study was performed at the Postgraduate Institute of Medical Education and Research, Chandigarh, a large tertiary care hospital in north India. Subjects with newly diagnosed stage 4 and 5 CKD were studied. The control population consisted of kidney donors. Subjects with a history of fracture or having received steroids, nonsteroidal anti-inflammatory drugs (NSAIDs), anticoagulants, antiepileptic agents, androgens, or vitamin D in the last 6 months were excluded. Study protocol was approved by the institute’s Ethics Committee and all subjects gave informed consent.
All study subjects underwent physical examination. Serum levels of creatinine, albumin, cholesterol, total calcium, inorganic phosphorus, TAP, 25(OH) vitamin D, intact PTH (iPTH), BAP, and tDPD were measured. Samples were collected in chilled tubes; serum was separated and frozen at -80°C for subsequent estimation of BAP, 25(OH) vitamin D, and tDPD. All assays were carried out in duplicate.
The test methodologies used were as follows:
Intact PTH assay was done using the solid phase two-site chemiluminescent enzyme-labeled immunometric assay (Diagnostic Products Corporation, Los Angeles, USA). The detection limit was 1 pg/ml. Intra-assay variability was less than 5.7% within the concentration range of 7.2–66.2 pg/ml (normal range, 7–63 pg/ml). In the concentration range above normal range, the intra-assay variability was kept to <5.7% by dilution method.
Serum 25(OH) vitamin D was estimated using competitive enzyme immunoassay technique (Immunodiagnostik AG, Stubenvauld-Allee, Bensheim). The specificity of the assay was 100% for 25(OH) vitamin D3. The detection limit of the assay was 2.0 nmol/l (25-125 nmol/l).
Estimation of serum tDPD was performed using a competitive enzyme immunoassay in a microassay stripwell format (MetratDPD EIA kit, Quidel Corporation, San Diego, USA). The minimum detection limit of the tDPD assay is 0.5 nmol/l.
Estimation of serum BAP was performed using a competitive enzyme immunoassay in a microtiter strip format (MicroVue BAPELISA kit, Quidel Corporation, San Diego, USA). The minimum detection limit of the assay is 0.7 U/L (normal range, 15–41.3 U/L). The intra-assay coefficient of variation (CV) is 3.9–5.8% and the inter-assay CV is 5.2–7.6%.
BMD was measured by dual-energy X-ray absorptiometry (DEXA) scan (Norland, Trumbull CT, USA; DEXA model XR 46) at the distal 1/3 of the radius, consistent with the recommendations of International Society of Clinical Densitometry from their 2005 Official Position Statement. It was estimated in g/cm2, and comparative T- and Z-scores were calculated.
The average of duplicate assays represented the value of individual samples in the statistical analysis. Data were analyzed using SPSS v 13.0 (Chicago, IL) software. Values are expressed as mean ± SD and as median (95% confidence interval) when the distribution was not normal. Normality of distribution was tested by Kolmogorov-Smirnov test. One-factor post hoc ANOVA with Bonferroni correction was used to compare the mean of clinical characteristics. Inter-group comparison of continuous data was carried out using Mann-Whitney U-test, and correlation between two variables was ascertained using Spearman’s rank correlation coefficient. Multiple regression analysis was carried out to see the effect of various parameters on 25(OH) vitamin D levels and T-score. A double-sided P value of <0.05 was considered significant.
Results
A total of 126 adults, 74 CKD patients (age 42 ± 14.5 years) and 52 non-CKD controls (age 40.2 ± 9.3 years) were studied [Table 1]. A majority of patients were from lower socioeconomic group and were vegetarians. The CKD patients were divided into two groups (CKD stages 4 and 5), based on calculated glomerular filtration rate (GFR) by the Modification of Diet in Renal Disease (MDRD) formula. CKD stage 5 comprised 39 (57%) patients. The causes of CKD included diabetic nephropathy in 24%, chronic glomerulonephritis in 19%, chronic interstitial nephritis in 11%, hypertensive nephrosclerosis in 8%, autosomal dominant polycystic kidney disease in 3%, and other diseases in 7%. The etiology was unknown in the remainder. The mean interval between onset of symptoms and enrolment in the study was 81 days.
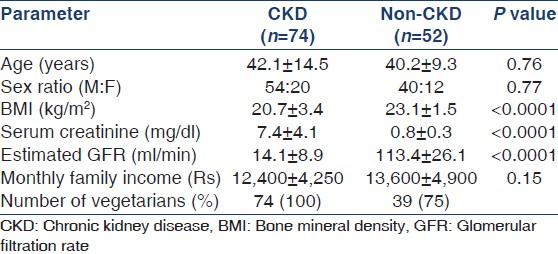
Table 2 shows the measured parameters in the CKD and control groups. Serum albumin and calcium levels were significantly lower, and inorganic phosphate and iPTH increased in CKD subjects. A total of 50 (72%) patients exhibited iPTH elevation greater than twice the upper range of normal, and in 45 (61%) patients, the level was >300 pg/ml. iPTH values were within normal range in only 7 (9%) patients. The markers of bone formation, TAP and BAP were significantly elevated in CKD subjects compared to controls, as was the marker of bone resorption, tDPD. The BAP level was >40 U/L in 66% of cases. All patients with iPTH >300 mg/ml exhibited BAP values >40 U/L.

25(OH) vitamin D levels were low in CKD as well as control subjects, with 80% of CKD subjects being vitamin D deficient (<15 ng/ml) and 13% having vitamin D insufficiency (15-30 ng/ml). About 82% of apparently non-CKD controls also were 25(OH) vitamin D deficient and 10% had insufficient 25(OH) vitamin D. A negative correlation was noted between 25(OH) vitamin D and iPTH levels in both non-CKD (r = −0.34, P = 0.008) and CKD (r = −0.24, P = 0.04) subjects. 25(OH) vitamin D was inversely correlated with BAP (r = 0.3, P = 0.009) but not tDPD (r = 0.03) in the CKD population. On multivariate analysis, the association between iPTH and 25(OH) vitamin D was even stronger in the non-CKD subjects (P = 0.001), but was no longer present in the CKD subjects. Other variables entered in the model included age, gender, serum albumin, calcium phosphate, BAP, and tDPD. Upon dividing the CKD subjects according to their iPTH levels into >300 and <300 pg/ml, it was found that those with higher iPTH levels had lower vitamin D levels (8.6 ± 7.9 vs. 12.7 ± 9.9 ng/ml, P = 0.04).
Next, we examined the correlation between the various markers [Figure 1]. There was a strong correlation between iPTH and BAP (r = 0.88, P < 0.0001). Significant correlations were also noted between iPTH and tDPD (r = 0.51, P < 0.0001) and BAP and tDPD (r = 0.46, P = 0.0004). The correlation between iPTH and TAP was weaker (r = 0.29, P = 0.01).

- Correlation between (a) parathyroid hormone (iPTH) and bone-specific alkaline phosphatase (BAP); (b) iPTH and total deoxypyridinoline (tDPD); (c) BAP and tDPD; and (d) iPTH and total alkaline phosphatase
DEXA scan showed that the prevalence of osteopenia (T-score −1 to −2.5) and osteoporosis (T-score < −2.5) in the CKD subjects was 37.5% and 12%, respectively. However, when the BMD in CKD subjects was compared with that in age-matched controls (Z-score), the prevalence came down to 40% and none, respectively. Overall, there was no correlation between BMD and iPTH, BAP and tDPD; but as a group, the osteoporotic CKD subjects exhibited higher iPTH (549.2 ± 289.7 vs. 318.9 ± 180.2 pg/ml, P = 0.04), BAP (72.4 ± 28.9 vs. 46.2 ± 18.6 U/L, P = 0.026), and tDPD (64.2 ± 21.4 vs. 32.4 ± 18.1 U/L, P = 0.002) compared to those who were osteopenic or had normal bone density. There was a significant negative association between BMD and serum phosphate (r = -0.37, P = 0.02). This association was maintained (P = 0.04) on multivariate analysis. Among controls, osteopenia and osteoporosis were noted in 30% and 5% subjects, respectively. On univariate analysis, the T-score showed a significant association with serum albumin in non-CKD subjects (r = 0.404, P = 0.009), and on multivariate analysis, this association was maintained (P = 0.001). Variables entered in the model included albumin, BAP, tDPD, calcium, phosphate, and iPTH. Next, the CKD subjects were divided into stages 4 and 5 for comparing the various parameters [Table 3]. Stage 5 patients showed significantly higher levels of inorganic phosphate, BAP, tDPD, iPTH, and BMD. No difference was noted in the serum calcium, TAP, and 25(OH) vitamin D levels between the two groups. Finally, we compared the various parameters in 18 patients with diabetic nephropathy and the other 56 patients with non-diabetic CKD but did not find any difference between the iPTH, 25(OH) vitamin D, TAP, BAP, tDPD, or BMD (data not shown).

Discussion
This is the first study to evaluate comprehensively the various indicators of bone disease in Indian patients with CKD. Our study involved newly diagnosed, treatment-naïve patients with CKD. We found the marker combinations to be consistent with high turnover bone disease as suggested by elevated iPTH, BAP, and tDPD levels in over 60% of the subjects. The only other study from India looked at only the calcium, phosphate, and iPTH levels in a cohort of dialysis patients.[20]
We observed a good correlation of iPTH with TAP, BAP, and tDPD. This is consistent with previous studies and supported the biological significance of these results.[1821] The correlation between BAP and iPTH and their ability to predict the type of bone disease has been shown in a number of studies.[561821–23] Using different cutoffs, the sensitivity was determined at >90% and the positive predictive value at 80–100%. Cavalier[24] showed that dialysis patients with iPTH levels >300 pg/ml exhibited greater elevations in BAP. In the study by Ureña et al.,[23] values of BAP >20 ng/ml had a sensitivity and specificity of 100% for the diagnosis of HTBD, and its positive predictive value was improved further when combined with iPTH serum levels >200 pg/ml. In another study,[18] BAP <25 U/L was able to differentiate adynamic bone disease or normal bone from other types of bone disease with 89% sensitivity and 82% specificity in pre-dialysis patients. In addition to predicting the type of bone disease, there is some evidence to suggest that elevated BAP might be a marker of cardiovascular mortality in CKD.[25]
The association between bone resorption marker tDPD and iPTH or BAP was as strong as that between iPTH and BAP. This is not a surprise; tDPD is affected by GFR[1026–28] and accumulates more in those with more advanced stages of CKD. The difference in the tDPD levels between stage 4 and 5 CKD was larger than that noted for the other parameters.
Coen et al.[22] found a better correlation of PTH levels with BAP than with tDPD. DPD concentrations do not differ between CKD patients with different histologic types of bone disease.[28] In contrast, other studies[13] have suggested that elevated tDPD levels are associated with high turnover bone disease and were positively correlated with bone resorption and bone formation to a degree comparable with that found between BAP and bone histomorphometric parameters. Serum DPD levels higher than 21 nmol/l had a sensitivity of 88% and a specificity of 93% in the diagnosis of a high remodeling disease.[13] Ibrahim et al.[29] noted a good correlation between BAP and tDPD. We found that patients with the highest iPTH levels showed greater elevation in tDPD levels compared with those with lower degrees of elevation in iPTH. On the basis of these findings, we might infer that an elevated tDPD level suggests a high turnover status, whereas a low level may not necessarily indicate the opposite. Also, the utility of this marker might be poorer in earlier stages of CKD compared with that in those on dialysis, as there is no urinary loss in these cases. This association, however, needs to be confirmed in studies using bone histomorphometry.
About 28% of patients had iPTH levels elevated less than twice the upper level of normal, and only very few patients showed suppressed parathyroid activity. None of these patients had ever received vitamin D supplementation. In a previous study from southern India, nearly 70% of 115 patients on dialysis had PTH levels <150 pg/ml and only 40% of the patients were receiving vitamin D supplementation.[20] Only 36% of the patients in that study had significant hyperphosphatemia. The reasons for these differences can only be speculated upon, and include difference in dietary habits, PTH assay methodology, and presence of other confounders. The presence of hypophosphatemia and hypoalbuminemia points toward the possibility of malnutrition, which is often associated with inflammation. Parathyroid gland can be suppressed by inflammation.[30] We did not evaluate level of inflammatory activation in this study, but have previously shown marked elevation in inflammatory markers, viz. C-reactive protein (CRP), interleukin-6, and tumor necrosis factor a in our CKD population.[31] Hence, interventions that can mitigate inflammation may be more promising approaches for the management of low turnover bone disease rather than decreasing the dose or withholding activated vitamin D analogs.
Our findings suggest that iPTH, and markers of bone formation or resorption move in the same direction. However, as noted by Kidney Disease: Improving Global Outcomes (KDIGO) workgroup, there have been no studies with sufficient power to assess whether iPTH in combination with other bone-derived biomarkers would be more predictive than individual markers.[11]
In our study, the prevalence of osteopenia and osteoporosis in the CKD subjects was 37% and 12%, respectively. This figure is lower than that reported from the West, likely due to the younger age and the shorter duration of CKD. Rix et al.[32] demonstrated osteoporosis in 30% of 113 pre-dialysis CKD population (GFR 37 ml/min). Osteoporosis was noted in 80% of the subjects by Urena et al., but those patients were on hemodialysis for a mean duration of 6.4 years. In a previous study where BMD was measured using quantitative CT scan (qCT) of lumbar vertebrae, we found the prevalence of osteopenia and osteoprosis to be 23% and 5%, respectively.[33] This difference can be explained by differences in technique and site of study. DEXA measures surface BMD mostly at cortical sites, whereas QCT being a three-dimensional measurement can selectively target the trabecular bone. The higher levels of iPTH as well as the markers of bone formation and resorption among osteoporotic subjects suggest a contribution of high turnover in the reduction of bone mass. Previous studies have shown an inverse relationship between BMD and PTH and some other markers.[3234–37] Of note, and proportion of non-CKD controls also showed osteopenia and osteoporosis. In a previous Indian study,[38] over 70% of apparently healthy adults between ages 20 and 40 years had either osteopenia or osteoporosis. This finding suggests that compared to Western standards, Indians fail to attain an adequate peak bone mass, and points to the need of developing normative data for this population. This study demonstrated vitamin D deficiency (<15 ng/ml) in 90% of the patients. This finding confirms our earlier report where vitamin D deficiency was found to be nearly universal in CKD. This is not surprising, as the vitamin D content of traditional (vegetarian) Indian diet is low and absorption is further hindered by the high phytate content.[39] All our CKD subjects were vegetarian, as were a majority of the non-CKD controls. Other studies from India have also shown vitamin D deficiency in more than 70–100% of the subjects.[40–42] The uremic state presents multiple stimuli to parathyroid glands, leading to secondary hyperparathyroidism. Our observation that those with more severe deficiency exhibited higher iPTH levels point toward the possible role of this form in the pathogenesis of hyperparathyroidism of CKD. A study from UK suggested that low plasma 25(OH) vitamin D is a major risk factor for hyperparathyroidism and Looser’s zones in chronic dialysis patients.[43] Although guidelines recommend correction of vitamin D deficiency, it needs to be studied through randomized trials whether this approach can lead to amelioration of hyperparathyroidism. In one study,[44] patients who received weekly cholecalciferol supplementation exhibited a decrease in PTH levels which fell short of statistical significance, probably because of small number of participants.
Some limitations of the study must be noted. The most important is the absence of bone histology. Therefore, although we can suggest the nature of ROD on the basis of the markers studied, room for doubt remains, especially in those with low values. We are unable to decide whether these patients should be classified as having any “bone disease.” Our PTH assay measured both the 1-84 and 7-84 forms of the molecule. It is possible that newer assays that measure only the intact molecule might have shown a different result. Furthermore, this is only a cross-sectional observational study and longitudinal assessment with additional analyses of dietary factors is required to more closely establish this association.
In conclusion, over 60% of newly diagnosed Indian stage 4-5 CKD patients showed significant elevations in iPTH, BAP, and tDPD, consistent with high turnover bone disease. About 37.5% and 12% of the patients showed osteopenia and osteoporosis, respectively. High turnover could contribute to the development of osteoporosis. 25(OH) vitamin D deficiency is widespread and seems to have a role in the genesis of hyperparathyroidism and high turnover renal bone disease. Studies on the effect of supplementation of native vitamin D are needed.
This article is dedicated to the memory of Dr. Zulfikar Jabbar, who was cruelly snatched away from us at a young age earlier this year.
Source of Support: VJ has grants from the Indian Council of Medical Research and Department of Biotechnology, Ministry of Science … Technology, Government of India
Conflict of Interest: None declared.
References
- Morbidity and mortality associated with abnormalities in bone and mineral metabolism in CKD. In: Olgaard K, ed. Clinical Guide to the Basics of Bone and Mineral Metabolism in CKD. New York: National Kidney Foundation; 2006. p. :77-92.
- [Google Scholar]
- Renal bone disease 1990: An unmet challenge for the nephrologist. Kidney Int. 1990;38:193-211.
- [Google Scholar]
- Bone disease in predialysis, hemodialysis, and CAPD patients: Evidence of a better bone response to PTH. Kidney Int. 1995;47:1434-42.
- [Google Scholar]
- Definition, evaluation, and classification of renal osteodystrophy: A position statement from Kidney Disease: Improving Global Outcomes (KDIGO) Kidney Int. 2006;69:1945-53.
- [Google Scholar]
- Predictive value of serum parathyroid hormone levels for bone turnover in patients on chronic maintenance dialysis. Am J Kidney Dis. 1995;26:622-31.
- [Google Scholar]
- Relationship between intact 1–84 parathyroid hormone and bone histomorphometric parameters in dialysis patients without aluminum toxicity. Am J Kidney Dis. 1995;26:836-44.
- [Google Scholar]
- Diagnosis of renal osteodystrophy: When and how to use biochemical markers and non-invasive methods; When bone biopsy is needed. Nephrol Dial Transplant. 2000;15:8-14.
- [Google Scholar]
- The importance of bone biomarkers in the diagnosis of renal osteodystrophy. West Indian Med J. 2010;59:332-7.
- [Google Scholar]
- A new approach for evaluating bone turnover in chronic kidney disease. Eur J Intern Med. 2010;21:230-2.
- [Google Scholar]
- Circulating biochemical markers of bone remodeling in uremic patients. Kidney Int. 1999;55:2141-56.
- [Google Scholar]
- KDIGO clinical practice guideline for the diagnosis, evaluation, prevention, and treatment of Chronic Kidney Disease-Mineral and Bone Disorder (CKD-MBD) Kidney Int Suppl. 2009;113:S1-130.
- [Google Scholar]
- Serum pyridinoline as a specific marker of collagen breakdown and bone metabolism in hemodialysis patients. J Bone Miner Res. 1995;10:932-9.
- [Google Scholar]
- An immunoassay for the measurement of free pyridinoline in serum: A marker of bone resorption. J Bone Mineral Res. 1993;8:S151.
- [Google Scholar]
- Vitamin D deficiency/insufficiency in patients with chronic kidney disease stage 3- and 4-current concept and its therapeutic strategy. Clin Calcium. 2004;14:764-9.
- [Google Scholar]
- Prevalence and correction of 25(OH) vitamin D deficiency in peritoneal dialysis patients. Perit Dial Int. 2005;25:362-6.
- [Google Scholar]
- Vitamin D supplementation for chronic kidney disease according to the guideline issued by DOQI. Clin Calcium. 2004;14:778-85.
- [Google Scholar]
- Skeletal scintigraph and some bone turnover markers in the diagnosis of renal osteodystrophy in hemodialysis patients. Pol Arch Med Wewn. 2003;110:943-50.
- [Google Scholar]
- Useful biochemical markers for diagnosing renal osteodystrophy in predialysis end-stage renal failure patients. Am J Kidney Dis. 2003;41:997-1007.
- [Google Scholar]
- Bone mineral density: Serum markers of bone turnover and their relationships in peritoneal dialysis. Perit Dial Int. 2004;24:163-8.
- [Google Scholar]
- Parathyroid hormone and biochemical profile in chronic kidney disease patients in South India. Hemodial Int. 2005;9:63-7.
- [Google Scholar]
- Assessment of renal osteodystrophy in dialysis patients: Use of bone alkaline phosphatase, bone mineral density and parathyroid ultrasound in comparison with bone histology. Nephron. 1997;75:412-9.
- [Google Scholar]
- Urinary deoxypyridinoline excretion for the evaluation of bone turnover in chronic renal failure. Am J Nephrol. 2000;20:283-90.
- [Google Scholar]
- Plasma total versus bone alkaline phosphatase as markers of bone turnover in hemodialysis patients. J Am Soc Nephrol. 1996;7:506-12.
- [Google Scholar]
- Evaluation of different bone markers in hemodialyzed patients. Clin Chim Acta. 2006;371:107-11.
- [Google Scholar]
- Bone markers predict cardiovascular events in chronic kidney disease. J Bone Miner Res. 2008;23:1850-8.
- [Google Scholar]
- Bone metabolism in dialysis patient assessed by biochemical markers and densitometry? Pol Arch Med Wewn. 2003;110:967-72.
- [Google Scholar]
- Direct, enzyme-linked immunoassay for urinary deoxypyridinoline as a specific marker for measuring bone resorption. J Bone Miner Res. 1994;9:1643-9.
- [Google Scholar]
- Spectrum of renal bone disease in end-stage renal failure patients not yet on dialysis. Nephrol Dial Transplant. 2003;18:1159-66.
- [Google Scholar]
- Pyridinium crosslinks in patients on haemodialysis and continuous ambulatory peritoneal dialysis. Nephrol Dial Transplant. 1995;10:2290-4.
- [Google Scholar]
- Insights into nutritional and inflammatory aspects of low parathyroid hormone in dialysis patients. J Ren Nutr. 2011;21:100-4.
- [Google Scholar]
- Iron status, inflammation and hepcidin in ESRD patients: The confounding role of intravenous iron therapy. Indian J Nephrol. 2010;20:125-31.
- [Google Scholar]
- Bone mineral density and biochemical markers of bone turnover in patients with predialysis chronic renal failure. Kidney Int. 1999;56:1084-93.
- [Google Scholar]
- Bone mineral density in patients with end-stage renal disease and its evolution after kidney transplantation. Indian J Nephrol. 2011;21:85-9.
- [Google Scholar]
- Plasma bone-specific alkaline phosphatase changes in hemodialysis patients treated by alfacalcidol. Clin Nephrol. 2002;57:261-73.
- [Google Scholar]
- Associations between osteoprotegerin and femoral neck BMD in hemodialysis patients. J Bone Miner Metab. 2008;26:66-72.
- [Google Scholar]
- 25-Hydroxyvitamin D deficiency and diabetes predict reduced BMD in patients with chronic kidney disease. J Bone Miner Res. 2006;21:1778-84.
- [Google Scholar]
- Annual change in bone mineral density in predialysis patients with chronic renal failure: Significance of a decrease in serum 1,25-dihydroxy-vitamin D. J Bone Miner Metab. 2007;25:74-9.
- [Google Scholar]
- Bone mineral density in young Indian adults with traumatic proximal femoral fractures. A case control study. Acta Orthop Belg. 2010;76:335-40.
- [Google Scholar]
- Prevalence and significance of low 25-hydroxyvitamin D concentrations in healthy subjects in Delhi. Am J Clin Nutr. 2000;72:472-5.
- [Google Scholar]
- High prevalence of low dietary calcium and low vitamin D status in healthy south Indians. Asia Pac J Clin Nutr. 2004;13:359-64.
- [Google Scholar]
- High prevalence of vitamin D deficiency in north Indian adults is exacerbated in those with chronic kidney disease. Nephrology (Carlton). 2009;14:345-9.
- [Google Scholar]
- Vitamin D status of apparently healthy schoolgirls from two different socioeconomic strata in Delhi: Relation to nutrition and lifestyle. Br J Nutr. 2008;99:876-82.
- [Google Scholar]
- Is low plasma 25(OH) vitamin D a major risk factor for hyperparathyroidism and Looser’s zones independent of calcitriol? Kidney Int. 1999;55:2169-77.
- [Google Scholar]
- Cholecalciferol (vitamin D3) therapy and vitamin D insufficiency in patients with chronic kidney disease: A randomized controlled pilot study. Endocr Pract. 2008;14:10-7.
- [Google Scholar]


