

Translate this page into:
Regulatory and effector T cells changes in remission and resistant state of childhood nephrotic syndrome
This is an open-access article distributed under the terms of the Creative Commons Attribution-Noncommercial-Share Alike 3.0 Unported, which permits unrestricted use, distribution, and reproduction in any medium, provided the original work is properly cited.
This article was originally published by Medknow Publications & Media Pvt Ltd and was migrated to Scientific Scholar after the change of Publisher.
Abstract
Idiopathic minimal change disease is a disorder of T-cell dysfunction. The relative predominance of regulatory T cells (Tregs), Th1, and Th2 cells in nephrotic syndrome (NS) remains controversial. Imbalance in peripheral blood regulatory and effector T cells (Teff) are linked to cell mediated immune response and may be associated with steroid response in NS. Peripheral blood CD4 + CD25 + FoxP3 + (Tregs), CD4 + IFN-γ+ (Th1), and CD4 + IL-4 + (Th2) lymphocytes were analyzed in 22 steroid-sensitive NS (SSNS) patients in sustained remission, 21 steroid-resistant NS (SRNS) and 14 healthy controls. The absolute percentage values and ratio of Th1/Tregs, Th2/Tregs, and Th1/Th2 were compared between SSNS, SRNS and control subjects. The percentage of Tregs was lower in SRNS patients (P = 0.001) compared with that of SSNS and healthy control. The percentage of Th1 cells was higher in SRNS (P = 0.001) compared to that of SSNS patients; however, it was similar to healthy controls (P = 1.00). The percentage of Th2 cells in SRNS (P = 0.001) was higher as compared to SSNS and controls. The ratio of Th1/Treg cells in SRNS (P = 0.001) was higher as compared to SSNS patients and controls. The ratio of Th2/Treg was also higher in SRNS as compared to SSNS and controls. The ratio of Th1/Th2 cells in SSNS, SRNS, and healthy controls were similar. The cytokines secretion complemented the change in different T-cell subtypes in SSNS, SRNS and healthy controls. However, the IFN-γ secretion in healthy controles was low inspite of similar percentage of Th1 cells among SRNS cases. We conclude that greater ratio of Tregs compared to that Th1 and Th2 favor steroid sensitivity and reverse ratio results in to SRNS. The difference in ratio is related to pathogenesis or it can be used as marker to predict steroid responsiveness needs further evaluation.
Keywords
Childhood nephrotic syndrome
effector T cells
regulatory T cells

Introduction
Idiopathic nephrotic syndrome (NS) is the commonest primary glomerular disease in children. One of the most important prognostic factors of the disease is steroid response. Approximately, 60-80% of steroid responsive patients experience relapses, and some remains steroid dependent or become steroid resistant.[1]
Idiopathic minimal change disease (MCD) is a disorder of T-cell dysfunction. Until the last decade, the dominant paradigm in NS was an imbalance between Th1 and Th2 cytokines and it was proposed that the cytokines secreted from activated Th2 cells, increase the glomerular permeability resulting into NS.[2] These discrepancies have been pointed out by Lama et.al.[3] One of the study showed that Th2 plays a predominant role in the Th1/Th2 imbalance hypothesis in childhood NS,[45] while another study revealed no skewing of Th1/Th2 balance[6] and possibly another subset of T cells the nonhelper regulatory T cells plays a role in NS. The nonhelper Tregs actively suppress the activation of the immune system, and effector T cells.[789] In 2009, Le Berre et al., have shown that the induction of Tregs attenuates idiopathic NS in rats,[7] and subsequently, Araya et al., have shown that Tregs suppressor mechanism is deficient in these cells and thereby enhance the cytokine release by Teff cells.[6] Recently, it has also been reported that other effector helper T cells also plays a potential role in the pathogenesis of MCD.[910] We aimed this study with the hypothesis that the decreased Tregs may result into activation of Teff cells, which secrete proinflammatory cytokines resulting into persistent proteinuria in SRNS, and increased Tregs result into SSNS.
Methods
Patients and healthy controls
A total of 64 subjects (50 patients and 14 healthy subjects) were included in the study. Of the 50 patients with childhood idiopathic NS, 25 were NS patients in sustained remission for at least 6 months (SSNS) without a steroid; and 25 were steroid resistant nephrotic syndrome (SRNS) patients. Of them, three from remission group and three from SRNS group were excluded because they did not consent for inclusion and one in SRNS had family history of NS. Thus, 22 (males 18, age 8.52 ± 5.8 years) SSNS and 21 (males 20, age 11.7 ± 3.8 years) SRNS patients remained in the study. Fourteen (males 11, 10.6 ± 4.3 years) healthy children of same ethnicity were included as control. All SRNS patients had biopsy proven MCD. Children of <2 years and >16 years; and those with a family history of NS were excluded from the study. Definitions of glomerular diseases were based on established criteria according to the International Study for Kidney Diseases in Children.[11] NS in children was defined as proteinuria of 40 mg/m2/h or, ratio of 2 for spot urine protein (mg)/creatinine (mg) in the first morning urine sample with hypoalbuminemia (serum albumin <2.5 g/dl) and presence of edema. Remission of NS was defined by urinary protein excretion <4 mg/m2/h or urine dipstick nil/trace for three consecutive days, and patients were defined in sustained remission if remission persists for at least of 6 months after stopping steroid, and all SRNS patients were on oral steroid at time of enrolment in the study and blood samples for T cell phenotype and cytokine analysis were taken before starting alternative immunosuppressant. Primary steroid resistance was defined as unresponsiveness of 60 mg/m2 body surface area per day for 4 weeks of prednisolone therapy. Secondary steroid resistance was defined as no response to 4 weeks of daily prednisone therapy at a dose of 60 mg/m2/day in a child previously known to have a steroid-sensitive course. With regard to SRNS, patients enrolled in this study did not have any (i) underlying secondary causes, they were negative for hepatitis B surface antigen seropositivity, anti-hepatitis C virus seropositivity and human immunodeficiency virus seropositivity and (ii) had normal serum complement (C3 and C4) levels. An informed consent was obtained from a parent or guardian of both patients and controls when a participant <15 years, and from the participant when age is >15 years as per Institute guidelines. This study was approved by the Institute Ethics Committee, Sanjay Gandhi Post Graduate Institute of Medical Sciences, Lucknow, India (pgi/dir/rc/186/2011).
T-cell phenotype analysis
Whole blood was diluted 1:1 with RPMI 1640 (Sigma Aldrich, St. Louis, USA) culture media and stimulated with phorbol 12-myristate 13-acetate (20 ng/ml; Sigma Aldrich, St. Louis, USA) and ionomycin (1 μg/ml; Sigma Aldrich, St. Louis, USA) for 5 h. Monensin (2 μM; BD Biosciences, San Diego, CA, USA) was also added for the final 2 h of activation as a protein transport inhibitor. For surface staining fluorescein isothiocyanate (FITC)-conjugated mouse anti-human CD4 and PerCP-Cy5.5 conjugated mouse anti-human CD69 were added for staining of activated CD4 cells. After surface staining, red blood cells (RBCs) were lysed with BD FACS lysing solution. Cells were washed, fixed and then permiabilize with Cytofix/Cytoperm kit (BD Pharmingen) according to the manufacturer's instruction. For intracellular cytokine staining with Alexa Fluor 647-conjugated mouse anti-human IFN-γ for Th1 and allophycocyanin-conjugated mouse anti-human IL-4 for Th2.[12] The isotypes FITC-conjugated mouse IgG1k, PerCP-Cy5.5 conjugated mouse anti-human IgG1k, Alexa Fluor 647-conjugated mouse IgG1k and allophycocyanin-conjugated mouse IgG1k were used as a control. Minimum 96% CD69 positive cells were used for phenotypic analysis. At least 10,000 lymphocytes were acquired on BD FACSCalibur (Becton Dickinson, Mount View, CA, USA) for each sample and analyzed with FlowJo (Ashland, OR, USA).
For Treg frequency analysis, whole blood was incubated with a cocktail of 2 mAb directed to CD4 (FITC), and CD25 (PerCP-Cy5.5). RBCs were lysed with BD FACS lysing solution. For intracellular staining of FoxP3, cells were subsequently fixed and permeabilized with BD Human FoxP3 Buffer Set according to the manufacturer's protocol before Alexa Fluor 647-conjugated mouse anti-human FoxP3 was added.[13] Isotype-matched antibodies were used as controls. All the antibodies were purchased from BD biosciences (BD Pharmingen, Sanjose, California, USA). A minimum 50,000 events in lymphocyte counts were acquired on a FACSCalibur (Becton Dickinson, CA, USA) flow cytometry and analyzed with FlowJo (Ashland, OR, USA).The representative plot of CD4 + CD25 + FoxP3 + Treg, CD4 + IFN-γ+ Th1 and CD4 + IL-4 + Th2 lymphocytes in a SSNS, SRNS and control subjects is shown in Figure 1. All the flow cytometric experiments were carried out in duplicate. The coefficient of variation for various markers CD4+, CD25+, FoxP3+, IFN-γ+, and IL-4 was 1.6%, 2.3%, 4.1%, 3.2%, and 2.1% respectively.

- Flow cytometric detection of Th1, Th2, and Treg cells in sustained remission, steroid resistant and healthy control. Stimulated peripheral blood were stained with fluorescein isothiocyanate-conjugated CD4 mAb and AlexaFluor 647 conjugated interferon-γ mAb for Th1 cells (1) and APC conjugated IL-4 mAb for Th2 cells (2) For Treg cells fluorescein isothiocyanate-conjugated CD-4 mAb, PerCP-Cy conjugated CD-25 mAb and AlexaFluor 647 conjugated FoxP3 mAb were used for staining of whole blood (3)
Separation of peripheral blood mononuclear cells
Heparinized venous blood was diluted 1:1 with RPMI 1640, containing Hepes (25 mM), gentamicin (50 pg/ml) and 10% heat-inactivated fetal calf serum (FCS). Peripheral blood mononuclear cells (PBMCs) were isolated over Histopaque-1077 (Sigma, St. Louis, MO 63103, USA) and washed three times.
In vitro production of cytokines by peripheral blood mononuclear cells
In vitro production of cytokines from cultured PBMCs was analyzed in 10 subjects in each groups. We measured following cytokines representative of different T cell subtypes secreted from cultured PBMCs; IL-10 and transforming growth factor-β1 (TGF-β1) for Tregs; IFN-γ for Th1 cells; IL-4 for Th2 cells.
Cells were resuspended at 1 × 10⁶ cells/ml in RPMI 1640 supplemented with 2 mM of extra glutamine and 10% FCS. The viability of the cells was checked by trypan blue. In vitro culture of the PBMCs was performed with mitogen phorbol 12-myristate 13-acetate (50 ng/ml; Sigma Aldrich, St. Louis, MO 63103, USA) and ionomycin (1 μg/ml; Sigma Aldrich, St. Louis, MO 63103, USA) in a flat-bottom six well culture plate at 37°C, 5% CO2and 100% humidity. Culture supernatants were harvested after 24 h and stored at −80°C.
Enzyme-linked immunosorbent assay
Cytokine levels in culture supernatants were quantified by commercially available kit for human IL-10, IFN-γ, IL-4, and TGF-β (Becton Dickinson, San Diego, CA 92121, USA). The lower detection limits for the individual assays are as follows: IL-10, 7.8 pg/ml; IFN-γ, 4.7 pg/ml; IL-4, 7.8 pg/ml; and TGF-β, 125 pg/ml.
Statistical analysis
Data are expressed as mean ± standard deviation. Data were analyzed using SPSS statistical software 15.0 (SPSS, Chicago, IL, USA). The means values in different groups were compared with analysis of variance (ANOVA) for parametric values. The percentage values in different groups were compared using Chi-square test or, Fisher exact test as per application required. P < 0.05 were considered as significant.
Results
The percentage of CD4 + CD25 + FoxP3 + Tregs was significantly lower in SRNS patients (3.03 ± 1.18%); P = 0.001 as compared to SSNS (7.84 ± 4.26%) and healthy control (7.99 ± 3.12%) [Figure 2a]. The percentage of CD4 + IFN-γ+ Th1 cells was significantly higher in SRNS (20.24 ± 7.01%; P = 0.001) as compared to SSNS (10.37 ± 3.49%), P = 0.001; however, it was similar to healthy control (18.38 ± 3.28% (P = 1.00) [Figure 2b]. The percentage of CD4 + IL-4 + Th2 cells in SRNS (10.74 ± 5.91%; P = 0.001) was significantly higher as compared to SSNS (5.18 ± 3.12%) and controls (4.91 ± 1.24%) [Figure 2c].
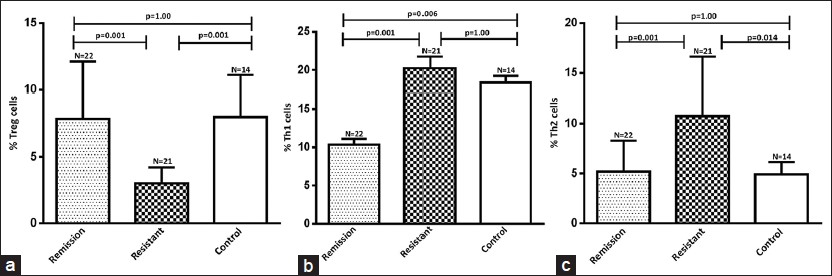
- Results are expressed as the percentage of CD4+CD25+FoxP3+ Treg, CD4+IFN-γ+ Th1 and CD4+IL-4+ Th2 cells in CD4+ lymphocytes in blood. Significant decrease in Treg cells in steroid resistant (a) Th1 cells were significantly decreased in remission compare to both resistant and healthy control (b) and (c) shows significant increase in the population of Th2 cells in steroid resistant nephrotic syndrome patients
The ratio of CD4 + IFN-γ+ Th1 and CD4 + CD25 + FoxP3 + Treg cells in SRNS (7.65 ± 3.72; P = 0.001) was significantly higher as compared to SSNS patients (1.69 ± 1.0) and controls (2.79 ± 1.52) [Figure 3a]. The ratio of CD4 + IL-4 + Th2 and CD4 + CD25 + FoxP3 + Treg was higher in SRNS (10.74 ± 5.91%; P = 0.001) as compared to SSNS (5.18 ± 3.12%) and controls (4.91 ± 1.24%) [Figure 3b]. The ratio of CD4 + IFN-γ+ Th1 and CD4 + IL-4 + Th2 cells in SSNS (3.21 ± 1.50), SRNS (2.85 ± 1.12), and healthy controls (2.79 ± 1.51) were similar [Figure 3c].

- Bar-diagram shows significant increase in the ratio of Th1/Treg (a) and Th2/Treg (b) cells in resistant patients as compared to remission and healthy control whereas no difference in the ratio of Th1/Th2 (c) cells between the groups
Cytokine levels from peripheral blood mononuclear cell culture supernatants of different groups
There was no production of cytokines from unstimulated PBMCs. The cytokines secreted from stimulated cultured PBMCs as shown in Figure 4. There was significantly lower secretion of IL-10 [Figure 4a] and TGF-β [Figure 4b] in PBMCs from SRNS patients as compared to that of SSNS and healthy controls. Significantly increased secretion of IFN-γ [Figure 4c] was observed in SRNS as compared to SSNS and healthy controls. Significantly greater secretion of IL-4 was observed in SRNS as compared to that of SSNS and healthy controls [Figure 4d]. The cytokines secretion complemented the different T cell subtypes in SSNS, SRNS, and healthy controls except the IFN-γ cytokine secretion in healthy controls was low despite the fact that percentage of Th1 cells was similar to SRNS.

- Cytokine levels in peripheral blood mononuclear cell culture supernatants of different groups. Significantly higher production of interleukin-10 (IL-10) (a) and transforming growth factor-β1 (b) whereas significantly decrease production of interferon-γ (c) and IL-4 (d) in remission and control compared to resistant patient after 24 h culture
Discussion
In the late 1980s, the Th1 and Th2 cell imbalance hypothesis had emerged for all immune mediated diseases, streaming from observations in mice of two subtypes of helper T cells differing in cytokine secretion patterns and other functions. This very concept was applied to human immunity[1415] and for almost 2 decades, the Th1 and Th2 imbalance in NS remained a major research focus.[1617] Consequently, Th1/Th2 imbalance concept was raised to the level of paradigm. The dominant paradigm in NS is an imbalance between Th1 and Th2 cytokines such as interleukin 13 (IL-13) a cytokine secreted from activated Th2 cells, increases glomerular permeability resulting into NS.[2]
However, the predominance of Th1/Th2 over each other in pathogenesis of NS still remains controversial and debatable. Kanai et al., have shown that Th2 plays a predominant role amongst the Th1/Th2 ratio in children with NS.[4] Kaneko et al., have shown that there is no skewing of Th1/Th2 balance in childhood NS and that the cardinal immunological abnormality does not lie in helper T cells but in other cells, such as suppressor/cytotoxic T cells.[5] In 2009, Le Berre et al., have shown that the induction of Treg cells attenuates idiopathic NS in rats,[7] and subsequently, Araya et al., have shown that Treg cell suppressor mechanism is deficient in these cells and thereby enhance the cytokine release by Teff cells resulting in to increased permeability and NS.[6]
Our study revealed that Th1 and Th2 cells in SRNS patients were significantly higher than the SSNS patients. However, the ratio of Th1/Th2 was not different in both groups.
In the present study, it was observed that the SSNS patients in remission had greater percentage of circulating Treg and lesser percentage of Th1 and Th2 cells. Further, the percentage of Tregs in SRNS patients was low and percentage of Th1 and Th2 cells was high as compared to SSNS. We also observed that Tregs cytokine profile was significantly higher in the SSNS and healthy controls as compared to that of SRNS. These observations indicate that an imbalance between Treg and Th1 and Th2 cells may be associated with the remission and resistant state of NS. One of the contrasting observations was that the percentage of Th1 cells was similar in control subjects and SRNS patients. However, Th1 cells from healthy controls were functionally less active as confirmed by IFN-γ cytokine secretion by stimulated PBMCs. This could be explained by the effect of functionally active Tregs in healthy controls, which might have suppressed the activity of Th1 cells.
Tregs are a specialized subpopulation of T cells that actively suppress activation of the immune system.[18] In renal transplantation, Treg phenotypically defind as CD4 + CD25 + FoxP3+,[1920] are associated with graft tolerance;[21] and circulating Tregs with presence of FoxP3 in the graft is associated with donor-specific hyporesponsiveness in patients after renal transplantation.[22] Treg cells mitigate the deleterious effect of immune system by several mechanisms; promoting graft survival by consuming IL-2, inhibiting mRNA synthesis in nonTreg,[23] by secreting anti-inflammatory cytokines such as TGF-β, IL-10, IL-35, by blocking co-stimulatory signal in Teff cells and also by blocking the granzyme-dependent direct killing by pathogenic Teff cells.[24]
The major strength of our study is that it successfully demonstrated that beyond Th1/Th2 imbalance, it is the imbalance of Treg with Th1 and Th2 which may be associated with SSNS and SRNS state in NS patients. With accumulating evidences of the use of Treg therapy in various autoimmune diseases and transplantation, it is possible that Tregs may also be used for the therapeutic purpose towards treatment of SRNS patients in future.[25]
The major limitation of our study is that we have not studied expression of Th17 cells which has been reported to play a role in immunological imbalances.
Conclusion
Remission and resistant state of NS is associated with an imbalance between Tregs, Th1 and Th2 cells. The ratio of Teff cells (Th1 and Th2) and Tregs was observed to be different in SSNS and SRNS. The greater ratio of Tregs compared to that Th1 and Th2 may result into state of SSNS and reverse ratio results into SRNS. However, the difference in ratio is related to pathogenesis or it can be used either as a marker to differentiate SSNS from SRNS or, to predict steroid responsiveness.
Source of Support: Nil
Conflict of Interest: None declared.
References
- Evaluation and management of proteinuria and nephrotic syndrome in children: Recommendations from a pediatric nephrology panel established at the National Kidney Foundation conference on proteinuria, albuminuria, risk, assessment, detection, and elimination (PARADE) Pediatrics. 2000;105:1242-9.
- [Google Scholar]
- The paradigm of Th1 and Th2 cytokines: Its relevance to autoimmunity and allergy. Immunol Res. 1999;20:147-61.
- [Google Scholar]
- T-lymphocyte populations and cytokines in childhood nephrotic syndrome. Am J Kidney Dis. 2002;39:958-65.
- [Google Scholar]
- Th2 cells predominate in idiopathic steroid-sensitive nephrotic syndrome. Clin Exp Nephrol. 2010;14:578-83.
- [Google Scholar]
- Th1/Th2 balance in childhood idiopathic nephrotic syndrome. Clin Nephrol. 2002;58:393-7.
- [Google Scholar]
- T regulatory cell function in idiopathic minimal lesion nephrotic syndrome. Pediatr Nephrol. 2009;24:1691-8.
- [Google Scholar]
- Induction of T regulatory cells attenuates idiopathic nephrotic syndrome. J Am Soc Nephrol. 2009;20:57-67.
- [Google Scholar]
- Close association between proteinuria and regulatory T cells in patients with idiopathic nephrotic syndrome. Pediatr Nephrol. 2013;28:667-9.
- [Google Scholar]
- Th17/Treg imbalance in adult patients with minimal change nephrotic syndrome. Clin Immunol. 2011;139:314-20.
- [Google Scholar]
- The prevalence of Th17 cells and FOXP3 regulate T cells (Treg) in children with primary nephrotic syndrome. Pediatr Nephrol. 2009;24:1683-90.
- [Google Scholar]
- Nephrotic syndrome in children: Prediction of histopathology from clinical and laboratory characteristics at time of diagnosis. A report of the International Study of Kidney Disease in Children. Kidney Int. 1978;13:159-65.
- [Google Scholar]
- Flow cytometric detection of intracellular TH1/TH2 cytokines using whole blood: Validation of immunologic biomarker for use in epidemiologic studies. Cancer Epidemiol Biomarkers Prev. 2004;13:1452-8.
- [Google Scholar]
- Flow cytometric phenotyping and analysis of T regulatory cells in multiple myeloma patients. Klin Onkol. 2011;24(Suppl):S30-3.
- [Google Scholar]
- Two types of murine helper T cell clone. I. Definition according to profiles of lymphokine activities and secreted proteins. J Immunol. 1986;136:2348-57.
- [Google Scholar]
- TH1 and TH2 cells: Different patterns of lymphokine secretion lead to different functional properties. Annu Rev Immunol. 1989;7:145-73.
- [Google Scholar]
- Th1 and Th2 cytokine mRNA profiles in childhood nephrotic syndrome: Evidence for increased IL-13 mRNA expression in relapse. J Am Soc Nephrol. 1999;10:529-37.
- [Google Scholar]
- Factors regulating apoptosis and homeostasis of CD4+CD25(high) FOXP3+regulatory T cells are new therapeutic targets. Front Biosci. 2008;13:1472-99.
- [Google Scholar]
- Roles of CD4+CD25(high) FOXP3+Tregs in lymphomas and tumors are complex. Front Biosci. 2008;13:3986-4001.
- [Google Scholar]
- Immunologic tolerance maintained by CD25+CD4+regulatory T cells: Their common role in controlling autoimmunity, tumor immunity, and transplantation tolerance. Immunol Rev. 2001;182:18-32.
- [Google Scholar]
- Reduced incidence of new-onset posttransplantation diabetes mellitus during the last decade. Transplantation. 2007;84:1125-30.
- [Google Scholar]
- CD4+CD25+immunoregulatory T cells suppress polyclonal T cell activation in vitro by inhibiting interleukin 2 production. J Exp Med. 1998;188:287-96.
- [Google Scholar]
- Human T regulatory cells can use the perforin pathway to cause autologous target cell death. Immunity. 2004;21:589-601.
- [Google Scholar]
- Adoptive regulatory T cell therapy: Challenges in clinical transplantation. Curr Opin Organ Transplant. 2010;15:427-34.
- [Google Scholar]


