

Translate this page into:
Factors Affecting Insulin Resistance and Its Relation to Vitamin D Status and Clinical Nutritional Parameters in Dialysis Patients: A Single-center Indian Study
This is an open access article distributed under the terms of the Creative Commons Attribution-NonCommercial-ShareAlike 3.0 License, which allows others to remix, tweak, and build upon the work non-commercially, as long as the author is credited and the new creations are licensed under the identical terms.
This article was originally published by Medknow Publications & Media Pvt Ltd and was migrated to Scientific Scholar after the change of Publisher.
Abstract
The aim of this study was to measure insulin resistance (IR) in dialysis patients and its relation to Vitamin D status and nutritional parameters. We included patients on maintenance dialysis, both hemodialysis and peritoneal dialysis (HD and PD). IR was measured by homeostatic model assessment (HOMA)-IR index defined as fasting serum insulin (μU/L) × fasting blood sugar (mmol/L)/22.5. Baseline Vitamin D levels were measured by chemiluminescence immunoassay (CLIA) method. HOMA-IR index correlated with nutritional parameters such as 7-point subjective global assessment (SGA) and anthropometric measures, for example, body fat percentage, lean body weight (LBW), mid-arm circumference (MAC), and mid-arm muscle circumference (MAMC). A total of 55 patients were studied, of them 74.55% were male with mean age of the study population being 37.44 ± 14.96 years. The prevalence values of Vitamin D deficiency <30 ngm/ml, <20 ngm/ml, and <10 ngm/ml levels were 96.36%, 70.91%, and 23.64%, respectively. Mean HOMA-IR index was 3.14 ± 3.86. The correlation of HOMA-IR with Vitamin D was negative (r = −0.140, 95% confidence interval [CI] = −0.397–0.138 and P = 0.309); however, in subgroup analysis, patients with Vitamin D level <20 ng/ml had significantly high IR compared to those with Vitamin D >20 ng/ml, i.e., 3.74 ± 4.37 and 1.67 ± 1.47, respectively (P = 0.018). The other measured parameter which had a significant positive correlation with IR was serum uric acid (r = 0.303, 95% CI = 0.021–0.534, and P = 0.025). In nutritional assessment, body mass index, MAC, and MAMC had statistically significant positive correlation with HOMA-IR index (P ≤ 0.001, 0.004, and 0.004, respectively) unlike SGA (P = 0.480). The mode of dialysis did not have a significant effect on IR (HD vs. PD, P = 0.227). The majority of the patients on maintenance dialysis are Vitamin D deficient. Low Vitamin D level, especially <20 ng/ml, muscle mass, and high serum uric acid level are likely to have more IR in dialysis-dependent patients.
Keywords
Chronic kidney disease
dialysis
Insulin resistance
nutrition
nutritional parameters
Vitamin D

Introduction
Despite new advances in the treatment of chronic kidney disease (CKD), it remains an important public health challenge.[1] CKD is a major risk factor for cardiovascular disease, which is the leading cause of mortality in these patients. Cardiac mortality in dialysis patients is more than 10-fold greater than that of the general population.[2] The excess cardiovascular mortality in patients with CKD is not fully explained by traditional risk factors such as hypertension, hypercholesterolemia, and smoking. One of the factors which were neglected in earlier studies was insulin resistance (IR) in CKD. IR which is a central pathogenic mechanism in metabolic syndrome and recognized in CKD patients has been directly associated with increased cardiovascular mortality in many studies.[34]
IR can be physiologic (e.g., in pregnancy) or pathologic as in CKD and it is linked to protein energy wasting and malnutrition in dialysis patients.[56] Hyperinsulinemic-euglycemic clamp is the gold standard for IR determination because it provides a direct measure of whole-body sensitivity to insulin. Other is oral glucose tolerance test primarily measuring glucose tolerance, which reflects both IR and beta-cell function. However, due to the complexity of these methodologies, more practical methods such as homeostatic model assessment (HOMA) and the quantitative insulin sensitivity check index are widely used in clinical studies.[7]
The role of Vitamin D deficiency in several pathological conditions has been the focus of several investigations in the last few years.[8] The complexity of the biological role of Vitamin D metabolism makes it difficult to clearly delineate the role of Vitamin D cascade in this complex pathophysiology of IR. In CKD, Vitamin D status has been related to IR; however, very limited information is available on dialysis patients and factors affecting IR. We designed this study to assess the IR in dialysis patients and its relation with Vitamin D status.
Materials and Methods
Study design
It was a cross-sectional, observational study.
Study population
We included 55 patients both on maintenance hemodialysis and peritoneal dialysis (HD and PD). The inclusion criteria were those who were on regular maintenance dialysis either on PD or HD and had age more than 18 years. Both diabetic and nondiabetic patients were included. The exclusion criteria were as follows:
-
Age <18 years
-
On insulin therapy
-
On active Vitamin D therapy
-
Chronic cardiac, hepatic, pulmonary, or thyroid disease
-
Malignancies
-
HBV-, HCV-, and HIV-positive patients
-
Patients who did not give informed consent.
This study was approved by our local ethics committee and written consent was obtained from all included patients.
Biochemical analysis
We measured blood hemoglobin level, serum creatinine, serum urea, serum calcium, serum phosphorus, serum alkaline phosphatase (ALP), serum albumin, and serum uric acid before starting HD and in the morning before starting PD. The morning fasting blood sugar and blood insulin level were measured. The homoeostasis model (HOMA) was used for the assessment of IR with the following formula:[9]
HOMA-IR (mmol/l × mU/ml) = fasting plasma glucose (mmol/l) × Fasting plasma insulin (mU/ml)/22.5.
25-(OH) Vitamin D level was measured using CLIA system, with Immulite 2000, Advia Centaur XP-Siemens system.
Nutritional assessments
Parameters such as weight (kg), heights (m), body mass index (BMI), mid-arm circumference (MAC), mid-arm muscle circumference (MAMC), total body fat, lean body weight (LBW), and subjective global assessment (SGA) were measured of all included patients [
Supplement
SupplementStatistical analysis
The statistical analyses were carried out using Statistical Package for Social Sciences for Windows version 20 (SPSS Chicago, IL, USA). The univariate analyses were expressed as mean ± standard deviation or percentages. ANOVA was used for comparison of the groups of SGA and their HOMA-IR index. HOMA-IR of two groups was compared using Mann–Whitney test, i.e., male versus females and HD versus PD and the correlation between nonparametric data was estimated using Spearman's coefficient. P < 0.05 was considered statistically significant.
Results
Characteristics of dialysis patients
A total of 55 diabetic and nondiabetic patients on dialysis were included in our study. Their demographic and laboratory profile are shown in Table 1. Forty-one (74.55%) patients were male. The mean age was 37.44 ± 14.96 years, height was 166.24 ± 8.66 cm, body weight was 52.81 ± 10.21 kg, LBW was 44.81 ± 7.81 kg, body fat percentage was 14.6 ± 8.80, body fat weight was 8 ± 6.15 kg, fat weight–to-LBW ratio was 0.18 ± 0.14, LBW index was 16.13 ± 2, and BMI was 19.06 ± 3.16. The cause of end-stage renal disease was chronic glomerulonephritis in 15 patients (27.27%), hypertension in seven patients (12.73%), diabetic nephropathy in seven patients (12.73%), polycystic kidney disease in two patients (3.64%), and unknown in 24 (43.64%). The estimated glomerular filtration rate by Cockcroft–Gault formula was 7.82 ± 3.04 ml/min/1.73 m2.
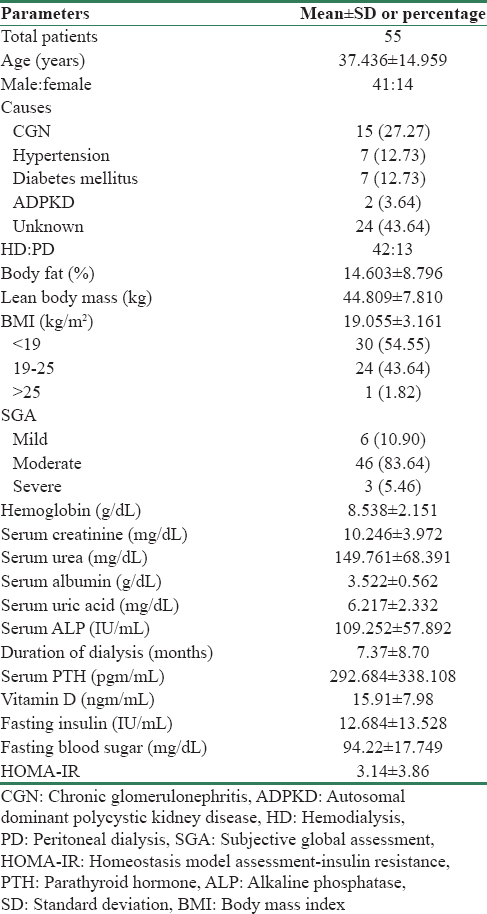
As per SGA, all patients have some degree of malnutrition. Six patients had mild degree of malnutrition (10.9%), 46 patients had moderate degree of malnutrition (83.64%), and three patients had severe degree of malnutrition (5.46%). As per BMI, thirty patients were <19 kg/m2 (54.55%), 23 patients were between 19 and 25 kg/m2 (41.82%), and two were >25 kg/m2 (3.64%). Of 55 patients, 42 were on HD (73.36%) and 13 patients were on PD (23.64%).
Relationship of insulin resistance with Vitamin D and other measured parameters
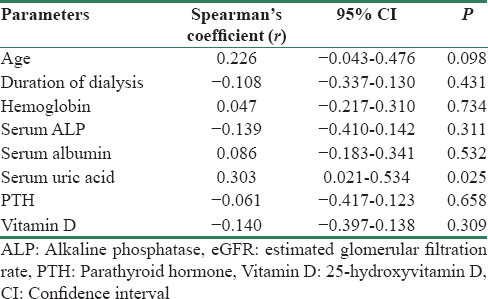
Age, hemoglobin level, serum albumin, and serum uric acid had positive correlation with IR; however, only uric acid level had significant association (r = 0.303, 95% confidence interval [CI] 0.021–0.534, P = 0.025) [Table 2]. Duration of dialysis, serum ALP, parathyroid hormone, and Vitamin D level had negative correlation; however, only Vitamin D level < 20 ngm/ml had significantly higher IR (3.743 ± 4.367) compared to those with Vitamin D level >20 ngm/ml (1.673 ± 1.473 (P = 0.018) as shown in Figure 1a.
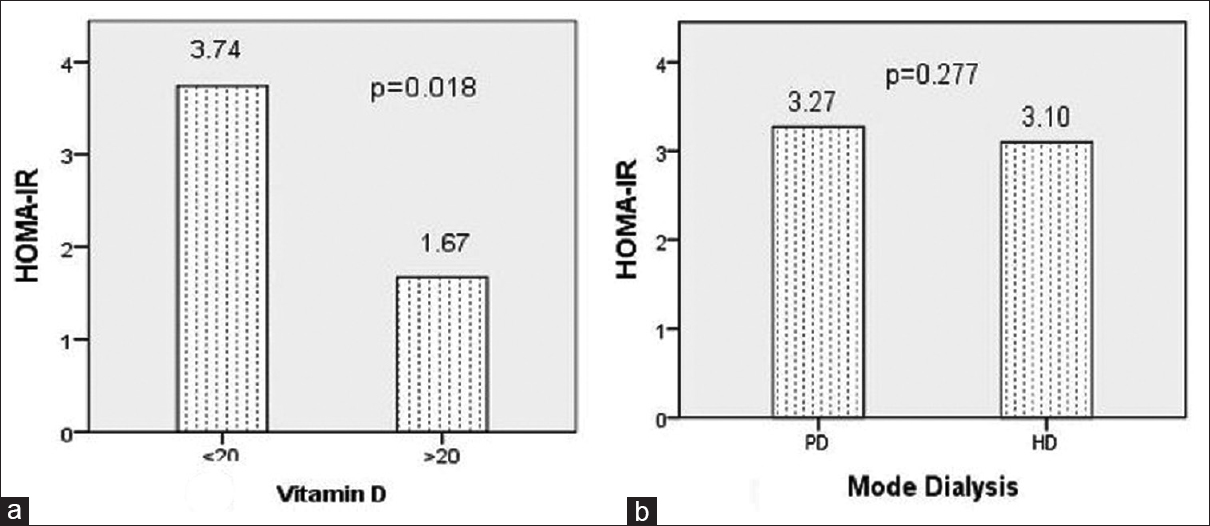
- Homeostatic model assessment-insulin resistance index (a) mean homeostatic model assessment-insulin resistance index was 3.743 ± 4.367 and 1.673 ± 1.473 in patients with Vitamin D level <20 ngm/ml and >20 ngm/ml, respectively (P = 0.018). (b) Insulin resistance was compared in peritoneal dialysis and hemodialysis. Mean homeostatic model assessment-insulin resistance index was 3.270 ± 2.486 and 3.101 ± 4.223 in peritoneal dialysis and hemodialysis, respectively (P = 0.277)
Relationship between insulin resistance and nutrition parameters
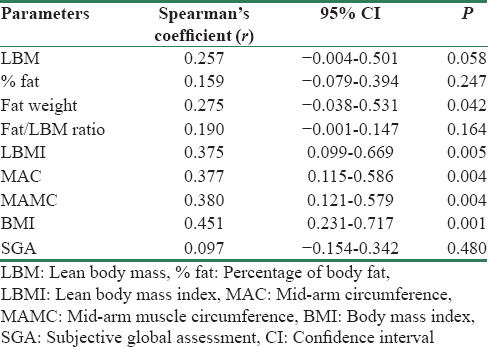
Of all the measured nutritional parameters as detailed in Table 3, lean BMI (r = 0.375, 95% CI: 0.099–0.669, P = 0.005), MAC (r = 0.377, 95% CI: 0.115–0.586, P = 0.004), MAMC (r = 0.380 95% CI: 0.121–0.579, P = 0.004), and BMI (r = 0.451, 95% CI: 0.231–0.717, P = 0.001) had significant positive association with IR. Body fat percentage did not had strong correlation in our study; however, body fat weight had achieved significant association with IR (r = 0.275, 95% CI: 0.038–0.531, P = 0.041).
The mean HOMA-IR index in mild, moderate, and severe grade malnutrition by SGA was 2.54 ± 1.55, 3.27 ± 4.17, and 2.39 ± 2.05, respectively (P = 0.861). The IR between male and female was 3.12 ± 3.69 and 2.44 ± 2.55, respectively (P = 0.528). HOMA-IR index in HD and PD patients was 3.101 ± 4.223 (P = 0.277) [Figure 1b]. Diabetic patients who were on dialysis had IR similar with that of nondiabetic patients on dialysis in our study (2.774 ± 1.800 vs. 3.194 ± 4.087, P = 0.647).
Discussion
We studied dialysis patients and majority were male; however, the IR was not different in either gender in our study group (P = 0.528). The mean Vitamin D level was 15.91 ± 7.98 ng/ml and majority were Vitamin D deficient. In our study, the prevalence values of Vitamin D deficiency <10 ng/ml, <20 ng/ml, and <30 ng/ml levels were 23.64%, 70.91%, and 96.36%, respectively. Studies have reported 70%–80% prevalence of Vitamin D deficiency in CKD patients which worsens with deteriorating renal function.[1314] The mode of dialysis did not affect IR in dialysis patients in our study (P = 0.277). In an earlier study, both HD and PD had shown similar improvement in IR after initiation of dialysis.[15]
The Vitamin D and IR had nonsignificant negative correlation; however, in subgroup analysis, patients with Vitamin D level <20 ng/ml had significantly high IR compared to those with Vitamin D level >20 ng/ml [Figure 1a]. There is also experimental evidence that Vitamin D is related to IR, a condition frequently observed in patients with progressive renal disease.[16] Earlier study by Chonchol and Scragg also support our finding and had shown that renal dysfunction and Vitamin D have independent inverse associations with IR.[17]
Another important association of IR is with serum uric acid level which has been considered as a potential risk factor in the development and progression of CKD.[18] IR has significant positive correlation with serum uric acid (r = 0.303 95% CI: 0.021–0.534, P = 0.025). This is not new in metabolic syndrome patients. However, in our study, this association reflects significance of uric acid in dialysis patients also.
One of the most important predictive factors for survival on dialysis is the presence of malnutrition.[1920] Moreover, most of the patients in our study were malnourished. The mean BMI was 19.055 ± 3.161 kg/m2 and more than 50% patientshave BMI <19 kg/m2. As measured by SGA, around 80% patients had moderate grade malnutrition. Out of the measured parameters, BMI, MAC, MAMC, and body fat content had significant positive correlation with IR [Figure 2 and Table 2]. This means that muscle mass and body fat have significant associations with IR in dialysis patients. Other studies also have reported significant positive correlation of BMI and body fat with IR.[2122]
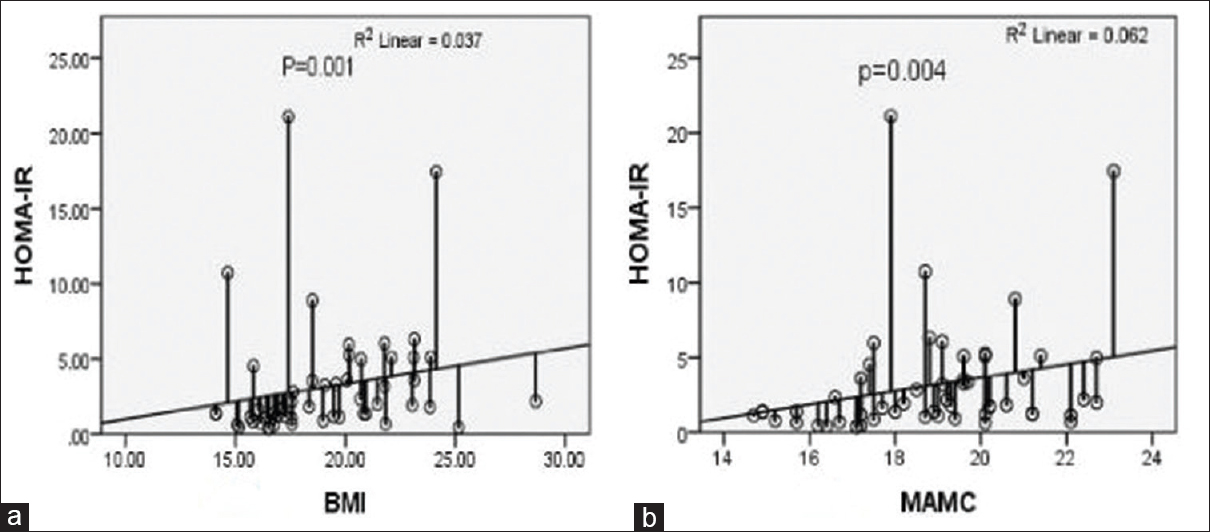
- Insulin resistance and nutrition (a) homeostatic model assessment-insulin resistance index increases as body mass index increases (P < 0.001). (b) Insulin resistance (homeostatic model assessment-insulin resistance) increases with increase in mid-arm muscle circumference (P = 0.004)
Although the exact mechanism for IR in CKD remains unclear, a postreceptor defect in the insulin-receptor signaling pathway in skeletal muscle is the likely primary abnormality.[23] Siew et al. have highlighted that IR is an important determinant of protein breakdown in CKD.[24] It appears that in CKD patients requiring dialysis, skeletal muscle is the primary tissue which is responsible for IR. In our study, IR increases with skeletal muscle mass; however, in sarcopenic patients, other factors such as metabolic acidosis, inflammation, and oxidative stress might be the main contributors of IR.
There are many limiting factors in our study. First, inflammatory state of the patient which is an important mechanism of IR in CKD has not mean measured and needs a well-controlled study. Second, visceral fat which has been reported in some studies to be related with IR has not been measured in our study. Third, dual-energy X-ray absorptiometry or bioimpedance was not used in our study. Finally, IR was quantified using the surrogate index of HOMA, and these findings need to be confirmed using euglycemic clamp technique.
Conclusion
Serum uric acid and Vitamin D level <20 ng/ml significantly influence the insulin sensitivity in dialysis patients. Anthropometric measures which indicate body muscle mass are more strongly correlated with IR in dialysis patients. It appears that the milieu in CKD is different, where IR is less likely depended on underlying causes and mode of dialysis. However, IR is a potentially modifiable cardiovascular risk factor and more studies are required in the future regarding intervention for preventing IR and its effect on cardiovascular morbidity.
Financial support and sponsorship
Nil.
Conflicts of interest
There are no conflicts of interest.
References
- K/DOQI clinical practice guidelines for chronic kidney disease: Evaluation, classification, and stratification. Am J Kidney Dis. 2002;39(Suppl 1):1-299.
- [Google Scholar]
- Clinical epidemiology of cardiovascular disease in chronic renal disease. Am J Kidney Dis. 1998;32(5 Suppl 3):S112-9.
- [Google Scholar]
- Association between the metabolic syndrome and chronic kidney disease in Chinese adults. Nephrol Dial Transplant. 2007;22:1100-6.
- [Google Scholar]
- Metabolic syndrome and kidney disease: A systematic review and meta-analysis. Clin J Am Soc Nephrol. 2011;6:2364-73.
- [Google Scholar]
- Uremic cardiomyopathy and insulin resistance: A critical role for Akt? J Am Soc Nephrol. 2011;22:207-15.
- [Google Scholar]
- Insulin resistance as an independent predictor of cardiovascular mortality in patients with end-stage renal disease. J Am Soc Nephrol. 2002;13:1894-900.
- [Google Scholar]
- HOMA index to assess insulin resistance in renal failure patients. Nephron. 2001;89:348-9.
- [Google Scholar]
- Homeostasis model assessment: Insulin resistance and beta-cell function from fasting plasma glucose and insulin concentrations in man. Diabetologia. 1985;28:412-9.
- [Google Scholar]
- Body fat assessed from total body density and its estimation from skinfold thickness: Measurements on 481 men and women aged from 16 to 72 years. Br J Nutr. 1974;32:77-97.
- [Google Scholar]
- Body composition from fluid spaces and density: Analysis of methods. In: Brozek J, Hanschel A, eds. Techniques for Measuring Body Composition. Washington, DC: National Academy of Sciences; 1961. p. :223-44.
- [Google Scholar]
- Subjective Global Assessment in chronic kidney disease: A review. J Ren Nutr. 2004;14:191-200.
- [Google Scholar]
- Prevalence of calcidiol deficiency in CKD: A cross-sectional study across latitudes in the United States. Am J Kidney Dis. 2005;45:1026-33.
- [Google Scholar]
- Clinical measures identify Vitamin D deficiency in dialysis. Clin J Am Soc Nephrol. 2010;5:460-7.
- [Google Scholar]
- Impact of dialysis therapy on insulin resistance in end-stage renal disease: Comparison of haemodialysis and continuous ambulatory peritoneal dialysis. Nephrol Dial Transplant. 2000;15:65-70.
- [Google Scholar]
- Vitamin D and disease prevention with special reference to cardiovascular disease. Prog Biophys Mol Biol. 2006;92:39-48.
- [Google Scholar]
- 25-Hydroxyvitamin D, insulin resistance, and kidney function in the Third National Health and Nutrition Examination Survey. Kidney Int. 2007;71:134-9.
- [Google Scholar]
- Serum uric acid independently predicts cardiovascular events in advanced nephropathy. Am J Nephrol. 2012;36:324-31.
- [Google Scholar]
- Malnutrition as the main factor in morbidity and mortality of hemodialysis patients. Kidney Int Suppl. 1983;16:S199-203.
- [Google Scholar]
- Death risk in hemodialysis patients: The predictive value of commonly measured variables and an evaluation of death rate differences between facilities. Am J Kidney Dis. 1990;15:458-82.
- [Google Scholar]
- Body mass index is the most important determining factor for the degree of insulin resistance in non-obese type 2 diabetic patients in Korea. Metabolism. 2004;53:142-6.
- [Google Scholar]
- Adiposity and insulin resistance in nondiabetic hemodialysis patients: Effects of high energy supplementation. Am J Clin Nutr. 2009;90:64-9.
- [Google Scholar]
- Insulin resistance and protein energy metabolism in patients with advanced chronic kidney disease. Semin Dial. 2010;23:378-82.
- [Google Scholar]
- Insulin resistance is associated with skeletal muscle protein breakdown in non-diabetic chronic hemodialysis patients. Kidney Int. 2007;71:146-52.
- [Google Scholar]


