

Translate this page into:
Early Predictors of Renal Dysfunction in Pediatric Patients with Sickle Cell Disease
This is an open access journal, and articles are distributed under the terms of the Creative Commons Attribution-NonCommercial-ShareAlike 4.0 License, which allows others to remix, tweak, and build upon the work non-commercially, as long as appropriate credit is given and the new creations are licensed under the identical terms.
This article was originally published by Medknow Publications & Media Pvt Ltd and was migrated to Scientific Scholar after the change of Publisher.
Abstract
Sickle cell disease (SCD) is a hereditary hemoglobinopathy characterized by abnormal hemoglobin production which leads to hemolytic anemia and intermittent occlusion of small blood vessels, which further leads to tissue ischemia, chronic organ damage, and organ dysfunction including urinary system. To measure the serum levels of cystatin-C and beta 2 microglobulin in pediatric patients with SCDand to investigate their significance as early biomarkers of glomerular and/or renal tubular dysfunction. This study was conducted among 70 children with SCD and 40 age and sex-matched children as a control group. All subjects underwent a full medical history, through physical examination, laboratory investigations including blood urea, serum creatinine, serum ferritin, estimated glomerular filtration rate (eGFR) using the Schwartz formula, creatinine clearance, urinary albumin/creatinine ratio, serum cystatin-C, and β-2 microglobulin levels. Pediatric patients with SCD had significantly higher serum cystatin-C and β-2 microglobulin levels compared to controls. In addition, serum cystatin-C and β-2 microglobulin levels were positively correlated with blood urea, serum creatinine, serum ferritin, urinary albumin/creatinine ratio, duration of iron chelating agents and frequency of blood transfusion/year. Serum cystatin-C and β-2 microglobulin levels were negatively correlated with hemoglobin. Our data concluded that serum cystatin-C and β-2 microglobulin had highersensitivity and specificity (91%, 90% and 85.7%, 100%, respectively) than serum creatinine (79% and85%, respectively). Serum Cystatin-C and β-2 microglobulin are early specific and sensitive biomarkers for evaluating glomerular and tubular dysfunction in children with SCD.
Keywords
Cystatin-C
beta 2microglobulin
Sickle cell disease

Introduction
Sickle cell disease (SCD) is a hereditary hemoglobinopathy characterized by abnormal sickle hemoglobin (HbS) synthesis, chronic hemolytic anemia, and intermittent vaso-occlusion of small vessels, leading to acute or chronic tissue ischemia, chronic organ damage, and organ dysfunction including urinary system.[123] With advances in treatment and chelating agents of children with SCD, previously undetermined complications have emerged such as renal complications.[3] Many factors lead to the functional abnormalities in children with chronic hemolytic anemias including SCD, such as shortened life span of red blood cells (RBCs), rapid iron turnover than normal, hemochromatosis, and hemosiderosis. Some iron chelating agents can affect renal functions.[4567] Patients with SCD usually suffer from multiple complications such as central nervous system (CNS), endocrine, metabolic, cardiac, pulmonary, hematological, reticuloendothelial, hepatic, renal, dermatologic, or musculoskeletal dysfunctions.[4567] Chronic hypoxemia, hemosiderosis, and desferrioxamine (DFO) toxicity as iron chelator are the main predisposing factors to glomerular and/or tubular dysfunction in SCD as chronic hemolytic anemia.[5678] Previous studies have demonstrated that proximal tubular dysfunction, proteinuria, aminoaciduria, and low urinary osmolarity were common complications among SCD patients.[9]
Cystatin-C is a sensitive biological marker for glomerular filtration rate (GFR) and is not secreted by renal tubules or reabsorbed back into the serum. It is better than creatinine clearance in the diagnosis of renal function impairment as it is not affected by height, gender, diet, and muscle bulk.[1011] Beta-2 microglobulin is freely filtered by glomeruli and reabsorbed by renal tubule. Serum β-2 microglobulin is very low in healthy individuals, however, its level increases in inflammatory, immunologic, and neoplastic conditions.[12] Early detection of children with SCD who are at a high risk of kidney impairment is highly significant as it helps to apply measures which can delay progressive kidney dysfunction.[7] There are only few publications regarding kidney impairment in pediatric patients with SCD.
Aims
In this study, we aimed to measure serum cystatin-C and β-2 microglobulin and to investigate their importance as early biomarkers of glomerular and/or tubular dysfunctions in children with SCD.
Subjects and Methods
Subjects
This case–control study was conducted among patients attending the pediatric Hematology and Nephrology units of Pediatrics department of Tanta University Hospital (TUH) between January 2017 and January 2018. Subjects were classified into two groups: group I included 70 children diagnosed as SCD according to the standard criteria for diagnosis of SCD including Hb electrophoresis (HbS), regularly transfused with packed RBCs, and receiving chelating agents in a regular manner.[13]
Exclusion criteria included history suggestive of recurrent urinary tract infections (UTIs) or systemic diseases that may affect the kidney e.g., systemic lupus erythematosus (SLE), history of intake of nephrotoxic drugs, and family history of hereditary renal diseases.
Group II included 40 children who were matched for age and sex as acontrol group.
The study was approved by the Research ethical committee of Faculty of Medicine, Tanta University. Informed written consents were obtained from the parents or caregivers of enrolled children after explaining study objectives.
Methods
The included children (patients and controls) were subjected to thorough history taking with stress on past medical history of underlying kidney disease or other diseases that could affect the study results, age at first transfusion, hydroxyurea treatment, analgesics, type of iron chelating agent, duration of chelating therapy, and compliance to therapy. Clinical examination was done including anthropometric measures, pubertal staging by Tanner's classification, and clinical evidence of complications of iron overload e.g., skin hemosiderosis. For laboratory investigations, 5 mL of venous blood was withdrawn under complete aseptic condition sand distributed as follows:
-
1 ml of whole blood was taken in an EDTA vacationer and mixed gently. This sample was used to measure complete blood count using anautomated hematology system (Sysmex XE 5000; Sysmex America, Inc., Mundelein, IL, USA)[14]
-
4 mL of blood sample swere taken in plain test tubes without anticoagulant. The samples were allowed to clot for 30 min at room temperature, and then centrifuged for 15 min at 1000/min. The serum was removed, aliquoted, and stored at ≤−20°C until assayed. The separated serum wasused for the following assays:
Serum creatinine and blood urea using Biosystem A15 autoanalyzer (Biosystems S.A., Barcelona, Barcelona, Spain) by appropriate chemical principles.
Estimated glomerular filtration rate (eGFR) was calculated using the equation of Schwartz et al.[15] who developed an equation to estimate GFR using data from the baseline visits of 349 children (aged 1–16 years) in the Chronic Kidney Disease in Children (CKD) cohort. The equation is based on height, serum creatinine, cystatin C, blood urea nitrogen, and gender.
GFR (ml/min/1.73 m2) = 39.1 [height (m)/serum creatinine (mg/dL)]0.516 × [1.8/cystatin C(mg/L)0.294 [30/BUN(mg/dl)]0.169 [1.099]male[height/1.4]0.188
Renal dysfunction was defined as eGFR <90 mL/min/1.73 m2 according to the National Kidney Foundation's Kidney Disease Outcomes Quality Initiative (NKF-K/DOQI).[16]
AKI was diagnosed according to the criteria proposed by acute kidney injury network (AKIN) for serum creatinine.[16]
Serum ferritin (μg/dL) was estimated by enzyme-linked immunosorbent assay (ELISA; R&D Systems, Minneapolis, MN, USA). Serum cystatin-C levelswere measured using human ELISA (sandwich technique) kits provided by Sunbio, Donghu Hi-Tech, Shanghai, China (Cat. No. CSBE08384h) with assay range (7.81–500 ng/mL). Serum β-2 microglobulin was measured using humanELISA (sandwich technique) kits provided by IBL International, GMBH, Hamburg, Germany (ID: 59041) with assay range (0–2.5 mg/L).
The second-morning mid stream urine sample of 5 mL was obtained, centrifuged within 1 h of sampling and was used for estimating creatinine and albumin/creatinine ratio in urine accordingto the guidelines of the National Kidney Foundation.[16] 24-h urine output was measured using plastic collection bag.
Statistical methods
Statistical analysis was conducted using SPSS version 16 software (Spaces Inc, Chicago, IL, USA). Results were expressed as mean ± SD values for parametric data and median. Student's t-test was used for mean values. Mann–Whitney test was used for non parametric quantitative data and Chi-squaretest (χ2) for comparing categorical variables. Pearson's correlation and Spearman's correlation were used for determining correlation in parametric and non parametric data, respectively. A receiver operating characteristic (ROC) curve with 95% confidence interval (CI) was used for optimal cut-off point. For all analyses, the level of significance was set at P = 0.05.[17]
Results
The study was conducted among 110 children aged 3–18 years. They were divided into two groups. Group I included 70 children with SCD with a mean age of 10.4 ± 3.9 years and 47 (67.1%) were males. Group II included 40 children who were age and sex-matched as a control group with a mean age of 8.6 ± 3.5 years and 22 (55%) were males. There were statistically significant increases in patient group regarding their family history of chronic hemolytic anemia, consanguinity, and head circumference, as well a statistically significant decreases in weight, height, and body mass index compared to the control group.
The onset of first blood transfusion presented early in life (mean = 0.7 ± 0.4 years), age at onset of iron chelating therapy was 2.7 ± 0.4 years; 36 (60%) cases were treated by deferoxamine (Dysferal) subcutaneous infusion, 20 (33.3%) were treated by deferasirox (Exjade) and 4 (6.67%) by Hydra. There was normocytic normochromic anemia with reticulocytosis, leukocytosis and thrombocytosis in patient group with statistically significant decrease in group I compared to group II regarding hemoglobin level, increase in reticulocytic count, platelets count, and white blood cell count. Serum ferritin was higher in patients than the control group (mean = 1430 ± 575.9 μg/dL versus 38.04 ± 16.03 μg/dL, respectively) (P = 0.001). Table 1 Compared between the studied groups regarding laboratory investigations indicating renal function tests. Table 2 summarizes correlations between cystatin-C and β-2 microglobulin and some demographic and laboratory parameters in patients group.
| Patients (n=70) | Controls (n=40) | Statistical test | ||
|---|---|---|---|---|
| Test value | P | |||
| Blood urea (mg/dl) | ||||
| Range | 14.2-48 | 9.6-22.2 | t=6.3 | 0.001* |
| Mean±SD | 28.9±7.6 | 19.7±3.1 | ||
| Serum creatinine (mg/dl) | ||||
| Range | 0.7-1.5 | 0.4-0.7 | t=11.1 | 0.001* |
| Mean±SD | 1.02±0.2 | 0.5±0.1 | ||
| Serum Urea/creatinine ratio | ||||
| Range | 25-110 | 24-29 | t=6.5 | 0.001* |
| Mean±SD | 61±24 | 26±1.5 | ||
| Urine volume (ml/24 h) | ||||
| Range | 450-900 | 650-1200 | t=11.5 | 0.001* |
| Mean±SD | 512±113 | 855±130 | ||
| Serum Cystatin C (ng/ml) | ||||
| Range | 0.7-7.4 | 0.07-0.8 | t=4 | 0.001* |
| Mean±SD | 1.6±1.4 | 0.4±0.2 | ||
| Serum β-2 microglobulin (mg/L) | ||||
| Range | 2.5-9.9 | 0.16-2 | t=9.7 | 0.001* |
| Mean±SD | 5.9±2.3 | 0.9±0.4 | ||
| Albumin/creatinine ratio in urine (mg/mmol) | ||||
| Range | 1.2-112 | 0.4-4 | t=7.6 | 0.001* |
| Mean±SD | 54.9±3.2 | 1.5±0.9 | ||
*P-value <0.05 significant
| Variable | Cystatin-C | Β-2 microglobulin | ||
|---|---|---|---|---|
| r | P | r | P | |
| Blood urea (mg/dL) | 0.7 | 0.003* | 0.5 | 0.001* |
| Serum creatinine (mg/dL) | 24 | 0.047* | 0.5 | 0.001* |
| Hb% (g/dL) | −0.6 | 0.001* | −0.24 | 0.046* |
| Serum ferritin (μg/dL) | 0.4 | 0.001* | 0.24 | 0.046* |
| Urinary albumin/Creatinine ratio (mg/mmol) | 0.6 | 0.003* | 0.5 | 0.003* |
| eGFR (mL/min/1.73) | −0.6 | 0.001* | −0.7 | 0.001* |
| Duration of chelation therapy | 0.5 | 0.001* | 0.6 | 0.003** |
| Frequency of blood transfusion/year | 0.6 | 0.001* | 0.6 | 0.003 |
| Serum Cystatin-C (ng/mL) | - | - | 0.7 | 0.001* |
| Serum b2 microglobulin (mg/L) | 0.7 | 0.001* | - | - |
*Significant; **Highly significant
Table 3 and Figure 1 showed validity of β-2 microglobulin, serum cystatin-C and serum creatinine as early diagnostic biomarkers for AKI in patients with SCD.
| Cut-off value | Sensitivity | Specificity | PPV | NPV | AUC | |
|---|---|---|---|---|---|---|
| Serum β 2 microglobulin (mg/L) | 3 | 85.7 | 100 | 100 | 66.7 | |
| Serum Cystatin C (ng/mL) | 0.7 | 91 | 90 | 97 | 75 | 0.989±0.009 |
| Serum creatinine (mg/dl) | 0.9 | 79 | 85 | 95 | 53 | 0.999±0.002 |
PPV: Positive predictive value, NPV: Negative predictive value
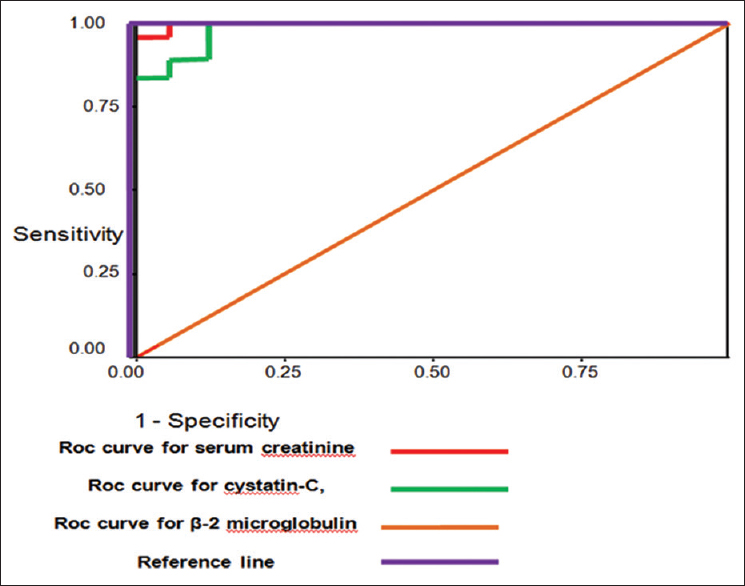
- ROC curve for validity of cystatin C, β- 2 microglobulin,serum creatinine and creatinine clearance as predictors of AKI in patients with SCD
Discussion
The underlying pathophysiological mechanisms for tubulopathy in patients with SCD include long-standing anemia, chronic hypoxia, iron overload and iron chelating agents.[2] In the present work, our data showed higher levels of blood urea, serum creatinine, urea/creatinine ratio, cystatin-C, β-2 microglobulin, and urinary albumin/creatinine ratio along with lower levels of urine volume in the patients than controls. These results agree with those of Smiley et al. who found significantly higher levelsof cystatin-C, serum creatinine, serum ferritin, and urinary albumin/creatinine ratio of patients group when compared to controls. Furthermore, they had significantly lower eGFR and creatinine clearance than controls (P < 0.05).[1] Moreover, these results are in concordance with Schneider et al., who reported significantly higher levels of serum cystatin-C, serum creatinine, and urinary albumin/creatinine, where they found significant lower levels of eGFR in SCD patients than controls.[9] Kacar et al. found that β-2 microglobulin and blood urea levels were increased in the patient group in comparison with control group while no statistically significant differences were observed between patient group and control group with regard to serum cystatin-C, serum creatinine, and creatinine clearance, which supports the evidence that chronic hypoxia occurs due to anemia which is related to disrupted kidney function.[18] In contrast to our findings, Koliakos et al. found normal serum creatinine and creatinine clearance in SCD patients with chronic hemolytic anemia who received subcutaneous deferoxamine treatment.[19] In the present study, there were statistically significant positive correlations between cystatin-C and blood urea, serum creatinine, serum ferritin, β-2 microglobulin, urinary albumin/creatinine ratio, duration of chelation therapy, and frequency of blood transfusion/year, and there were statistically significant negative correlations between both cystatin C and b2 microglobulin and Hb%. These results support the idea that cystatin-C gives a good estimate of GFR more accurate and precise than other methods. They concluded that glomerular dysfunction in SCD is not a rare complication, hence the early markers such as cystatin-C are useful for early detection of small changes in GFR, and periodic renal assessment of those patients is mandatory as many of them may have hidden renal affection.[789] Economou et al. reported that 36% of their patients with chronic hemolytic anemia had elevated serum cystatin-C, suggesting that cystatin-C is superior to serum creatinine for detection of impaired GFR in cross-sectional studies.[20] In this study, there were statistically significant positive correlations between β-2 microglobulin and urea, creatinine, serum ferritin, cystatin-C, albumin/creatinine ratio, duration of chelation therapy, and frequency of blood transfusion/year, and there were statistically significant negative correlations between β-2 microglobulin and Hb%. This is in agreement with Voskaridou et al. who stated that cystatin-C and serum β-2 microglobulin had strong correlations with age and found inverse correlations between Hb and β-2 microglobulin and cystatin-C levels.[21] Herrero-Morin et al. also found a positive correlation between serum β-2 microglobulin and cystatin-C, as both reflect the decrease in the renal function, and negative correlation between serum β-2 microglobulin and Hb, serum creatinine and cystatin-C using 24-h urine. They reported that impaired renal function and hyperproduction of b-2microglobulin are both associated with increased serum levels. Thus, it is suggested that β-2 microglobulin concentration in the blood is largely affected by the changes in the GFR.[22] In the present study, the best cutoff for serum creatinine level was 0.85 mg/dL with 83% sensitivity and 100% specificity, and the best cutoff for serum cystatin-C level was 0.74 ng/mL; at this level, the diagnostic sensitivity was 91.4% and specificity was 90.0%, while creatinine clearance at cutoff was 83.15 mL/min gave 81.4% sensitivity and 100% specificity. Narvaez-Sanchez et al. found that onusing a GFR of 90 mL/min as a cutoff value, serum cystatin-C had sensitivity 75%, specificity 84%, and area under ROC curve (AUROC) 0.84, and serum creatinine had a sensitivity 46%, specificity100%, and AUROC 0.72. Using a GFR of 70 mL/min as a cutoff value, serum cystatin-C had sensitivity 100%, specificity 48%, and AUROC 0.94;and serum creatinine had a sensitivity of 77%, specificity 91%, and AUROC 0.81;the authors concluded that cystatin-C is a very interesting option and could be a replacement to serum creatinine for diagnosing and possibly monitoring kidney function in children.[23] The AUROC for serum cystatin-C was significantly higher (0.84 ± 0.03) than that for creatinine clearance (0.35 ± 0.05). Moreover, serum cystatin-C had higher sensitivity and specificity than creatinine clearance (66% versus 62% and 92% versus 65%, respectively). It is well known that cystatin-C is a valuable marker for cardiovascular morbidity and mortality in diabetes and metabolic syndrome;[242526] previous studies demonstrated the relationship between arterial stiffness and renal insufficiency, including vascular structure changes, increased atherogenic lipoprotein, decreased fibrinolysis and oxidative stress; these studies demonstrated that endothelial dysfunction is the main link between renal insufficiency and cardiovascular diseases.[2728] In the present study, the best cutoff for β-2 microglobulin was 3 μg/mL; at this level, the diagnostic sensitivity was 85.7%, specificity was 100%, diagnostic accuracy was 88.9%, and AUROC curves was 1. This is in agreement with Unals et al. who stated that the areas under the ROC curves for cystatin-C were 0.943, for β-2 microglobulin 0.899, and for Schwartz GFR estimate was 0.917 with no statistically significant difference (P = 0.05), although there was a tendency toward the best area for cystatin-C. The area under the curve for creatinine (0.840) was significantly smaller than that for cystatin-C (the difference between areas, 0.103; SE, 0.031; P = 0.001). The clinical sensitivities and specificities were calculated at the selected decision points of the ROC curves; cystatin-C revealed higher sensitivity than creatinine and β-2 microglobulin (61% versus 29% and 38% respectively) for reduced GFR. At the cutoff with a diagnostic specificity of 95%, cystatin-C had higher sensitivities (80%) than serum creatinine (35%) and β-2 microglobulin (32%).[29] Also, Donadio et al. found that cystatin-C, β-2 microglobulin, and retinol-binding protein rapidly increased by reducing GFR; they increased in the order of β-2 microglobulin, cystatin-C, and RBP, particularly as GFR was 20 mL/min/1.73 m2, although the diagnostic accuracy of cystatin-C and β-2 microglobulin was similar to creatinine in different degrees of GFR. When GFR levels were measured higher than 80 ml/min/1.73 m2, all renal parameters (serum creatinine, cystatin-C, and β-2 microglobulin) were detected close to the upper limits but within normal values.[30]
Conclusions
Both β-2 microglobulin and cystatin-C are considered early specific and sensitive biomarkers for evaluating glomerular and tubular function respectively. As renal dysfunction in SCD is not an uncommon complication, periodic follow-up for kidney evaluation of patients with SCD are advisable for early identification of masked kidney dysfunction.
Financial support and sponsorship
Nil.
Conflicts of interest
There are no conflicts of interest.
References
- Therapy insight: Metabolic and endocrine disorders in sickle cell disease. Nat Clin Pract Endocrinol Metab. 2008;4:102-9.
- [Google Scholar]
- Global epidemiology of sickle hemoglobin in neonates: A contemporary geostatistical model based map and population estimates. Lancet. 2013;381:142-51.
- [Google Scholar]
- Renal complications in transfusion-dependent beta thalassemia. Blood Rev. 2010;24:239-44.
- [Google Scholar]
- Comparison of renal function markers in Kuwaiti patients with sickle cell disease. J Clin Pathol. 2006;59:345-51.
- [Google Scholar]
- Short-term follow-up of patients with sickle cell disease and albuminuria. Pediatr Blood Cancer. 2008;50:1236-9.
- [Google Scholar]
- Evaluating risk factors for chronic kidney disease in pediatric patients with sickle cell anemia. Pediatr Nephrol 2017 Epub ahead of print
- [Google Scholar]
- Renal dysfunction in patients with beta-thalassemia major receiving iron chelation therapy either with deferoxamine and deferiprone or with deferasirox. Acta Haematol. 2010;123:148-52.
- [Google Scholar]
- Serum cystatin-C as an endogenous marker of the renal function, a review. Clin Chem Lab Med. 1999;37:389-95.
- [Google Scholar]
- A new approach for evaluating renal function and its practical application. J Pharmacol Sci. 2007;105:1-5.
- [Google Scholar]
- Beta-2 microglobulin: Its significance in the evaluation of renal function. Kidney Int. 1987;32:635-41.
- [Google Scholar]
- Protocol for evaluation of automated blood cell counters. International Committee for standardization in Hematology (ICSH) Clin Lab Haematol. 1984;6:69-84.
- [Google Scholar]
- New equations to estimate GFR in children with CKD. J Am Soc Nephrol. 2009;20:629-37.
- [Google Scholar]
- K/DOQI clinical practice guidelines for chronic kidney disease: Evaluation, classification, and stratification. Am J Kidney Dis. 2002;39(Suppl 1):S1-S266.
- [Google Scholar]
- Statistical methods in medical research. Vol 4. (4th ed). Oxford: Blackwell; 2002. p. :125.
- [Google Scholar]
- Levels of beta-2 microglobulin and cystatin C in beta thalassemia major patients. J Clin Anal Med. 2015;6:269-73.
- [Google Scholar]
- Urine biochemical markers of early renal dysfunction are associated with iron overload in beta thalassemia. Clin Lab Haematol. 2003;25:105-9.
- [Google Scholar]
- Renal dysfunction in patients with beta-thalassemia major receiving iron chelation therapy either with deferoxamine and deferiprone or with deferasirox. Acta Haematol. 2010;123:148-52.
- [Google Scholar]
- Early markers of renal dysfunction in patients with sickle cell/beta-thalassemia. Kidney Int. 2006;69:2037-42.
- [Google Scholar]
- and beta2- microglobulin: Markers of glomerular filtration in critically ill children. Crit Care. 2007;11:R59.
- [Google Scholar]
- Cystatin C could be a replacement to serum creatinine for diagnosing and monitoring kidney function in children. Clin Biochem. 2008;41:498-503.
- [Google Scholar]
- Estimation of glomerular filtration rate using serum cystatin C and creatinine in adults with sickle cell anemia. Am J Hematol. 2017;92:E598-9.
- [Google Scholar]
- Cystatin C: A useful marker of glomerulopathy in sickle cell disease? Blood Cells Mol Dis. 2015;54:65-70.
- [Google Scholar]
- Serum cystatin C levels in children with sickle cell disease. Pediatr Nephrol. 2006;21:533-7. Erratum in: Pediatr Nephrol 2006;21:1217
- [Google Scholar]
- Detection of chronic kidney disease with creatinine, cystatin C, and urine albumin-to-creatinine ratio and association with progression to end-stage renal disease and mortality. JAMA. 2011;305:1545-52.
- [Google Scholar]
- Cystatin C is associated with the metabolic syndrome and other cardiovascular risk factors in a hypertensive population. J Am Soc Hypertens. 2009;3:201-9.
- [Google Scholar]
- Beta2 Microglobulin, N-Acetyl-beta-D-glucosaminidase, Retinol-Binding Protein, and Endothelin 1 Levels in the Evaluation of Sickle Cell Disease Nephropathy. Pediatr Hematol Oncol. 2015;32:250-7.
- [Google Scholar]
- b 2 microglobulin, and retinol-binding protein as indicators of glomerular filtration rate: Comparison with plasma creatinine. J Pharm Biomed Anal. 2001;24:835-42.
- [Google Scholar]


