

Translate this page into:
Loss of Subpodocytic Space Predicts Poor Response to Tacrolimus in Steroid-Resistant Calcineurin Inhibitor-Naïve Adult-Onset Primary Focal Segmental Glomerulosclerosis
This is an open access journal, and articles are distributed under the terms of the Creative Commons Attribution-NonCommercial-ShareAlike 4.0 License, which allows others to remix, tweak, and build upon the work non-commercially, as long as appropriate credit is given and the new creations are licensed under the identical terms.
This article was originally published by Medknow Publications & Media Pvt Ltd and was migrated to Scientific Scholar after the change of Publisher.
Abstract
Focal segmental glomerulosclerosis (FSGS) is the most common cause of adult-onset nephrotic syndrome, but its pathophysiology is poorly understood. The question as to why only a subset of patients responds to treatment in unanswered. In the past few years, change of podocytic phenotype from stationary type in health to migratory type in disease has been described, of which loss of subpodocytic space is a surrogate marker. Diagnostic biopsies of adult-onset steroid-resistant calcineurin inhibitor-naïve primary FSGS cases, which were subsequently treated with tacrolimus were included in this retrospective study conducted from 2011 to 2013. The ultrastructure of all cases was studied in detail, especially in context to the presence or absence of subpodocytic space. In the present study, we have compared presence or absence of subpodocytic space in tacrolimus-responsive versus tacrolimus-resistant cases to identify potential electron microscopic features predictive of response to treatment, of which loss of subpodocytic space indicating migratory phenotype is the most important and consistent feature. The present series included 7 tacrolimus responsive cases (includes two cases with partial response) and seven tacrolimus-resistant cases. The tacrolimus-resistant patients were of older age, had a longer duration of illness, and a lower eGFR as compared to tacrolimus responsive cases. The subpodocytic space was preserved in patients on tacrolimus with complete remission and lost in patients with partial response and tacrolimus-resistant cases.
Keywords
Electron microscopy
steroid-resistant focal segmental glomerulosclerosis
subpodocytic space

Introduction
Focal segmental glomerulosclerosis (FSGS) is the most common cause of adult-onset nephrotic syndrome and accounts for about 20%–25% of cases.[1] It is hypothesized that podocytic injury in primary FSGS is likely to be immune mediated; therefore, immunosuppressant drugs such as steroids and calcineurin inhibitors (CNI), for example, cyclosporine and tacrolimus are used in its treatment. Although administering steroids is the first line of treatment, approximately 50% of cases turn out to be steroid resistant.[2] CNI is preferred in the treatment of steroid-resistant FSGS, over other immunosuppressants such as cyclophosphamide and mycophenolate mofetil.[3] Among CNI, tacrolimus is preferred over cyclosporine because it is a better immunosuppressant and has a lower incidence of nephrotoxicity. However, the remission rate of steroid-resistant FSGS treated with tacrolimus is reported to be 52.2% (complete remission 38.6% and partial remission 13.6%).[4] The question as to why a subset of patients respond to treatment while the other subset does not is unanswered. In the last few years, the shift of podocyte from its stationary phenotype to migratory phenotype has been documented as a new player in the pathogenesis of FSGS.[5] Loss of subpodocytic space is a surrogate marker of migratory podocyte phenotype and has not been evaluated in the context of therapy-responsive versus therapy-resistant FSGS. This study was conducted to evaluate electron microscopic features of tacrolimus-responsive versus tacrolimus-resistant adult-onset steroid-resistant CNI-naïve primary FSGS cases.
Materials and Methods
A retrospective study was performed in which steroid-resistant CNI-naïve cases of adult-onset primary FSGS between January 2011 and June 2013 with 60-month follow-up were included in the study. All patients had kidney biopsy before the initiation of tacrolimus, which was subjected to light microscopy, direct immunofluorescence, and electron microscopic studies. Patients having secondary FSGS, collapsing glomerulopathy, interstitial fibrosis tubular atrophy more than 25%, and previous therapy with immunosuppressants other than tacrolimus, for example, cyclophosphamide, mycophenolate mofetil, and azathioprine were excluded from the study.
The study design including treatment received, duration of therapy, and definitions to classify patients into a complete response, partial response, and resistant are highlighted in Figure 1. Nephrotic syndrome was defined by proteinuria ≥3.5 g/day or ≥1.5 g/day along with a serum albumin <2.5 g/dl, edema, and hyperlipidemia. Tacrolimus resistance was diagnosed in those patients who did not meet the above-mentioned criteria for complete or partial remission at the end of 24 weeks of tacrolimus therapy. Tacrolimus trough levels were estimated using microparticle enzyme-linked immunoassay, Abbott IMx Tacrolimus II assay, Abbott Laboratories, Abbott Park, Ill, USA. A follow-up of 60 weeks was available in all cases (48 weeks of therapy + 12 weeks follow-up).

- The study design including treatment received, duration of therapy, and definitions to classify patients into a complete response, partial response (Tacrolimus responsive), and tacrolimus-resistant groups
Two electron microscopic grids of each case were examined. Detailed electron microscopic analysis was carried out independently by two nephropathologists (RN and PA) who were blinded with regard to tacrolimus-responsive or tacrolimus-resistant status of patients. About 10–15 electron microscopic photographs of glomeruli were taken in each case. The presence of the following ultrastructural changes in the podocytes was recorded:
-
Global podocytic foot process effacement
-
Actin condensation
-
Swollen secondary podocytic foot processes
-
Loss of subpodocytic space
-
Villiform transformation of tertiary podocytic foot processes
-
Dilated rough endoplasmic reticulum in podocyte cell body
-
Microcystic change (MC) in podocyte cell body.
Subpodocytic space is defined as the region beneath the podocytic cell body [Figure 2c]. The presence or absence of subpodocytic space was evaluated by assessing a minimum of three glomeruli in each case. The loss of sub podocytic space was then graded semiquantitatively on a 4-step scoring scale (no loss of subpodocytic space = 1, loss along 25%–50% glomerular basement membrane length = 2, loss along 50%–75% glomerular basement membrane = 3, and loss along more than 75% glomerular basement membrane = 4). Villiform transformation of tertiary foot processes, prominent rough endoplasmic reticulum, and MC in podocyte cell body are considered as features of podocytic activation and were also semiquantitatively graded on a 4-step scoring scale (0%–25% glomerular area = 1, 26%–50% glomerular area = 2, 51%–75% glomerular area = 3, and >75% glomerular area = 4). In addition to the above-mentioned parameters, endothelial injury (endothelial cell swelling and loss of fenestration), glomerular basement membrane alteration, immune complex deposits, and tubuloreticular inclusions were looked for.
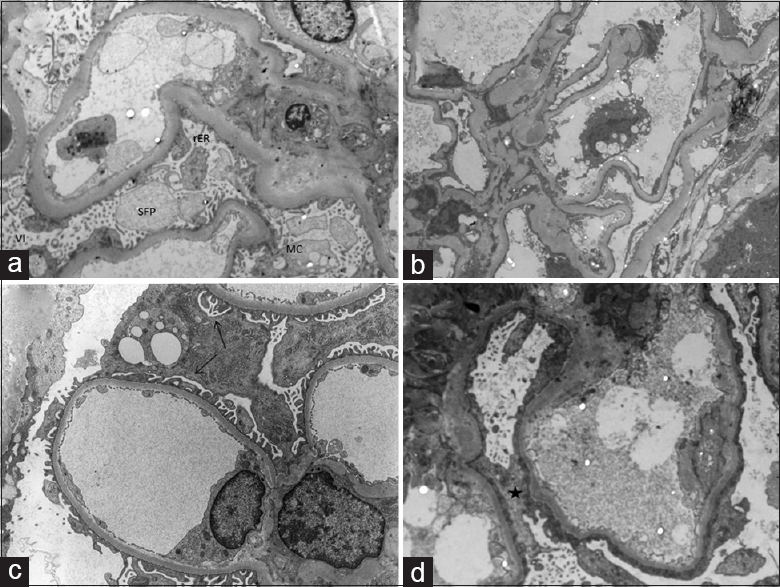
- (a) Electron microscopic photograph from Case 4 showing podocytic foot process effacement and marked podocytic activation in the form of extensive villiform transformation of tertiary foot processes (Vi), rarefied and bulbous secondary foot processes, prominent rough endoplasmic reticulum, and microcystic change (Uranyl acetate-lead citrate, ×7900). (b) Electron microscopic photograph from Case 14 showing podocytic foot process effacement and podocytic inactivation (Uranyl acetate-lead citrate, ×3950). (c) Electron microscopic photograph showing preserved subpodocytic space (black arrows) in Case 1 (Uranyl acetate-lead citrate, ×12,000). (d) Electron microscopic photograph from Case 11 showing a loss (black star) of subpodocytic space (Uranyl acetate-lead citrate, ×14,000)
Results
Fourteen cases were evaluated in this study and included eleven male patients and three female patients with a mean age of 25.21 years (range 18–43 years). Out of the fourteen cases, seven cases were tacrolimus responsive (includes two cases with partial response) and seven cases were tacrolimus resistant.
Patients responsive to tacrolimus were younger (mean age 19.28 years) as compared to tacrolimus-resistant patients (mean age 31.1 years). The mean duration of illness was greater in tacrolimus-resistant group (10.85 months) as compared to tacrolimus-responsive group (7.7 months). The mean baseline 24 h urinary protein levels were 5.5 g (range: 1.8–19 g) in tacrolimus-responsive group and 4.85 g (range: 2–13.2 g) in tacrolimus-resistant group. The mean baseline estimated glomerular filtration rate (eGFR) was higher in tacrolimus-responsive group (102.8 ml/min) as compared to tacrolimus-resistant group (91.55 ml/min). The salient clinical and laboratory parameters are detailed in Tables 1–3.
| All cases (n=14) | Tac responsive (n=7) | Tac resistant (n=7) | |
|---|---|---|---|
| Mean age (years) | 25.21 (18-43) | 19.28 (18-23) | 31.1 (18-43) |
| Sex | |||
| Male | 11 | 6 | 5 |
| Female | 3 | 1 | 2 |
| Mean duration of illness (months) | 9.28 (4-38) | 7.7 (6-14) | 10.85 (4-38) |
| Mean baseline 24 h urinary protein (g) | 5.17 (1.8-19) | 5.5 (1.8-19) | 4.85 (2-13.2) |
| Mean baseline serum albumin (g/dl) | 2.36 (0.6-4.5) | 2.31 (1-4.2) | 2.41 (0.6-4.5) |
| Mean baseline serum creatinine (mg/dl) | 0.94 (0.8-1.5) | 0.95 (0.8-1.5) | 0.92 (0.8-1.1) |
| Mean baseline eGFR (ml/min) | 97.18 (60.5-124.5) | 102.8 (61-124.5) | 91.55 (60.5-124.5) |
| Mean tacrolimus levels (ng/ml) | 6.74 (5.6-9.8) | 6.26 (5.6-7) | 7.21 (5.7-9.8) |
eGFR: Estimated glomerular filtration rate
| Serial number | Case 1 | Case2 | Case 3 | Case 4* | Case 5* | Case 6 | Case 7 |
|---|---|---|---|---|---|---|---|
| Age/sex | 19/male | 19/female | 20/male | 18/male | 23/male | 18/male | 18/male |
| Duration of illness (months) | 7 | 7 | 6 | 6 | 6 | 14 | 8 |
| Baseline 24 h urinary protein (g) | 2.4 | 1.8 | 19 | 4 | 4 | 4.9 | 2.4 |
| Baseline serum albumin (g/dl) | 3 | 1.1 | 2.2 | 4.2 | 2.3 | 1 | 2.4 |
| Baseline serum creatinine (mg/dl) | 0.8 | 1 | 0.8 | 1.5 | 0.8 | 0.9 | 0.9 |
| Baseline eGFR (ml/min) | 124.5 | 71.4 | 123 | 61 | 120 | 109.9 | 109.9 |
| Tacrolimus levels (ng/ml) | 6.98 | 6.4 | 6.1 | 5.9 | 5.9 | 7 | 5.6 |
| 3 months 24 h urinary protein (g) | 0.3 | 2.3 | 1.4 | 0.8 | 4.2 | 3.9 | 0.27 |
| 3 months serum albumin (g/dl) | 4.5 | 4 | 3.5 | 4.9 | 4 | 2.2 | 3.9 |
| 3 months serum creatinine (mg/dl) | 1.2 | 0.6 | 1.2 | 1.3 | 0.7 | 0.9 | 0.8 |
| 6 months 24 h urinary protein (g) | 0.3 | 0.2 | 0.3 | 0.6 | 3.4 | 2.1 | 0.27 |
| 6 months serum albumin (g/dl) | 4.5 | 4.1 | 3.5 | 4.1 | 3.6 | 3.7 | 3.8 |
| 6 months serum creatinine (mg/dl) | 1.2 | 0.7 | 1 | 1.4 | 0.8 | 0.9 | 0.9 |
| 6 months eGFR (ml/min) | 78 | 107.8 | 95.3 | 66 | 120 | 109.9 | 109.9 |
| 9 months 24 h urinary protein (g) | 0.3 | 0.2 | 0.3 | 0.6 | 0.8 | 1.2 | 0.3 |
| 9 months serum albumin (g/dl) | 3.97 | 4 | 3.7 | 4.1 | 3.8 | 4.1 | 3.6 |
| 9 months serum creatinine (mg/dl) | 1 | 0.7 | 1 | 1.5 | 0.8 | 0.9 | 0.8 |
| 12 months 24 h urinary protein (g) | 0.3 | 0.2 | 0.3 | 0.7 | 1.1 | 0.3 | 0.3 |
| 12 months serum albumin (g/dl) | 4 | 3.8 | 3.8 | 4.2 | 3.8 | 4.3 | 3.6 |
| 12 months serum creatinine (mg/dl) | 1 | 0.8 | 1.1 | 1.5 | 0.8 | 1.1 | 0.8 |
| 12 months eGFR (ml/min) | 95.3 | 91.4 | 84.5 | 60.3 | 119 | 86.2 | 124.5 |
| Time to response (months) | 3 | 3 | 3 | 3 | 6 | 6 | 3 |
| Relapse status (yes/no) | No | Yes | No | Yes | No | No | No |
*Partial response. eGFR: Estimated glomerular filtration rate
| Serial number | Case 8 | Case 9 | Case 10 | Case 11 | Case 12 | Case 13 | Case 14 |
|---|---|---|---|---|---|---|---|
| Age/sex | 40/male | 18/female | 22/male | 38/male | 19/male | 43/female | 38/male |
| Duration of illness (months) | 8 | 6 | 10 | 6 | 4 | 4 | 38 |
| Baseline 24 h urinary protein (g) | 2.4 | 4.2 | 4.1 | 2 | 2.9 | 5.2 | 13.2 |
| Baseline serum albumin (g/dl) | 2.3 | 1.9 | 3.8 | 0.6 | 1.6 | 4.5 | 2.2 |
| Baseline serum creatinine (mg/dl) | 0.9 | 1 | 0.8 | 1.1 | 0.8 | 1 | 0.9 |
| Baseline eGFR (ml/min) | 93.5 | 72.2 | 120.9 | 74.9 | 124.5 | 60.5 | 94.4 |
| Tacrolimus levels (ng/ml) | 6.2 | 7.2 | 7.2 | 7.2 | 5.7 | 9.8 | 7.2 |
| 3 months 24 h urinary protein (g) | 1.8 | 4 | 2.7 | 1.9 | 2 | 3 | 9.3 |
| 3 months serum albumin (g/dl) | 2.8 | 2.2 | 2.3 | 2.6 | 2.9 | 3.3 | 2.3 |
| 3 months serum creatinine (mg/dl) | 1.1 | 0.9 | 0.7 | 1.7 | 0.8 | 3.4 | 1 |
| 6 months 24 h urinary protein (g) | 4.4 | 3 | 1.4 | 5.7 | 3.2 | 3.2 | 13.3 |
| 6 months serum albumin (g/dl) | 2 | 2 | 1.7 | 3.3 | 1.1 | 2.2 | 2.2 |
| 6 months serum creatinine (mg/dl) | 1.5 | 1 | 0.8 | 2.2 | 2.7 | 1.2 | 1 |
| 6 months eGFR (ml/min) | 51.8 | 72.2 | 120.9 | 33.7 | 30.6 | 49 | 83.6 |
With regard to electron microscopic features, global podocytic foot process effacement, actin condensation, and rarefied and bulbous secondary foot processes (SFP) were noted in all 14 cases. Out of seven tacrolimus-responsive cases, five cases showed ultrastructural features of podocytic activation (villiform transformation of tertiary foot processes and/or prominent rough endoplasmic reticulum and/or MC) affecting most of the podocytes [Grade 4, Figure 2a]. Out of seven tacrolimus-resistant cases, only two cases showed features of podocytic activation, while the remaining five cases showed features of podocytic inactivation [Grade 1, Figure 2b].
Extensive (Grade 4) subpodocytic space loss was observed in five tacrolimus-resistant cases [Figure 2d], both the cases showing a partial response to tacrolimus and only one tacrolimus-responsive case. The detailed ultrastructural features of tacrolimus-responsive and tacrolimus-resistant cases are tabulated in Tables 4 and 5, respectively.
| Features | Case 1 | Case 2 | Case 3 | Case 4* | Case 5* | Case 6 | Case 7 |
|---|---|---|---|---|---|---|---|
| Foot process effacement | + | + | + | + | + | + | + |
| Actin condensation | + | + | + | + | + | + | + |
| Swollen secondary foot processes | + | + | + | + | + | + | + |
| Subpodocytic space loss | Nil | Nil | Nil | 4 | 4 | 4 | Nil |
| Villiform transformation of tertiary foot processes | 4 | 1 | 3 | 4 | 4 | 4 | 1 |
| Rough endoplasmic reticulum | 4 | 1 | 2 | 2 | 3 | 2 | 1 |
| Microcystic change | 3 | 1 | 2 | 2 | 4 | 2 | 1 |
*Partial response
| Features | Case 8 | Case 9 | Case 10 | Case 11 | Case 12 | Case 13 | Case 14 |
|---|---|---|---|---|---|---|---|
| Foot process effacement | + | + | + | + | + | + | + |
| Actin condensation | + | + | + | + | + | + | + |
| Swollen secondary foot processes | + | + | + | + | + | + | + |
| Sub-podocytic space loss | 4 | 1 | 4 | 4 | 4 | 1 | 4 |
| Villiform transformation of tertiary foot processes | 1 | 1 | 1 | 4 | 2 | 4 | 1 |
| Rough endoplasmic reticulum | 1 | 2 | 1 | 3 | 1 | 3 | 1 |
| Microcystic change | 2 | 1 | 1 | 2 | 1 | 3 | 1 |
Discussion
Before 2009, the glomerular filtration barrier comprised of three layers, namely, fenestrated glomerular endothelium, glomerular basement membrane, and slit diaphragm. In 2009, two additional layers were described, i.e., endothelial surface layer and subpodocytic space. While the endothelial surface layer determines permeability, the subpodocytic space plays an important role in ultrafiltration and hydraulic resistance.[6]
The mechanisms of injury causing primary FSGS are poorly understood. The theory of immune dysregulation leading to podocytopathy is acceptable till date, and invariably all cases are treated with immune modulatory agents. Ongoing research in the present decade highlights various other pathogenetic mechanisms such as a change in podocytic phenotype. In health, the podocytes are in a stationary phenotype while they acquire a migratory phenotype under stress. This podocytic phenotypic change is brought about by Rho-GTPase mediated regulation of actin cytoskeleton of podocytes.[5] The other molecules implicated in inducing migratory podocytic phenotype are protein tyrosine phosphatase 1B, Sphingomyelinase-like phosphodiesterase 3b, angiotensin II, and monocyte chemoattractant protein-1.[78910]
In the present study, global podocyte foot process effacement, actin condensation, and swollen SFP were noted in all 14 cases. The subpodocytic space was preserved in four out of the five Tacrolimus-responsive cases and lost in both the cases with partial response and five out of the seven cases with tacrolimus resistance. Loss of subpodocytic space is a surrogate marker of migratory phenotype of podocyte. Therefore, almost all cases with this ultrastructural feature fared worse (resistant or partial response to Tacrolimus), except one tacrolimus-responsive case. Ultrastructural features of podocytic activation were conspicuous in tacrolimus-responsive patients, indicating early podocytic response to injury and attempts at regeneration.
Conclusion
In the present study, we have compared podocytic activation and presence or absence of subpodocytic space in tacrolimus-responsive versus tacrolimus-resistant cases to identify potential electron microscopic features predictive of response to treatment, of which loss of subpodocytic space indicating migratory phenotype is the most important and consistent feature.
Financial support and sponsorship
Nil.
Conflicts of interest
There are no conflicts of interest.
References
- Idiopathic adult focal segmental glomerulosclerosis: A clinicopathological study and response to steroid. Nephron. 1993;63:168-71.
- [Google Scholar]
- KDIGO clinical practice guideline for glomerulonephritis. Kidney Int Suppl. 2012;2:181-5.
- [Google Scholar]
- Tacrolimus therapy in adult-onset steroid-resistant nephrotic syndrome due to a focal segmental glomerulosclerosis single-center experience. Nephrol Dial Transplant. 2014;29:1918-24.
- [Google Scholar]
- New players in the pathogenesis of focal segmental glomerulosclerosis. Nephrol Dial Transplant. 2012;27:3406-12.
- [Google Scholar]
- New aspects of glomerular filtration barrier structure and function: Five layers (at least) not three. Curr Opin Nephrol Hypertens. 2009;18:197-205.
- [Google Scholar]
- Protein tyrosine phosphatase 1B inhibition protects against podocyte injury and proteinuria. Am J Pathol. 2014;184:2211-24.
- [Google Scholar]
- Sphingomyelinase-like phosphodiesterase 3b expression levels determine podocyte injury phenotypes in glomerular disease. J Am Soc Nephrol. 2015;26:133-47.
- [Google Scholar]
- Mechanisms of angiotensin II signaling on cytoskeleton of podocytes. J Mol Med (Berl). 2008;86:1379-94.
- [Google Scholar]
- The monocyte chemoattractant protein-1/cognate CC chemokine receptor 2 system affects cell motility in cultured human podocytes. Am J Pathol. 2007;171:1789-99.
- [Google Scholar]


