

Translate this page into:
Urinary Albumin Excretion, Estimated Glomerular Filtration Rate, and Prevalence of Microalbuminuria in Obese Nondiabetic and Nonhypertensive Adults: A Cross-Sectional Study
This is an open access journal, and articles are distributed under the terms of the Creative Commons Attribution-NonCommercial-ShareAlike 4.0 License, which allows others to remix, tweak, and build upon the work non-commercially, as long as appropriate credit is given and the new creations are licensed under the identical terms.
This article was originally published by Wolters Kluwer - Medknow and was migrated to Scientific Scholar after the change of Publisher.
Abstract
Context:
Obesity even in absence of diabetes and hypertension increases the risk for microalbuminuria (MAU), glomerular hyperfiltration, and therefore nephropathy.
Aims:
This study aims to assess the urinary albumin excretion (UAE), prevalence of MAU, and values of estimated glomerular filtration rate (eGFR) in obese nondiabetic and nonhypertensive patients, vis a vis thin healthy subjects, and attempts to correlate anthropometric measurements with UAE and eGFR.
Setting and Design:
Cross-sectional analytical study on 60 cases who were obese according to Asia Pacific guidelines and 60 nonobese controls. Patients with diabetes, hypertension, ischemic heart disease, and established renal disease were excluded.
Methods and Material:
Albuminuria was assessed in each patient by quantitative immunoturbidimetry method on a spot urine sample. eGFR was calculated by Cockcroft–Gault formula.
Statistical Analysis:
Data was analyzed using SPSS (2015 version). Mann–Whitney U-test, Fisher Exact test, and Spearman's correlation coefficient was used for various variables.
Results:
The mean age of cases was 31.90 ± 6.32 years. About 78.33% were in class 1 and 21.66% in class 2 obese groups. The mean UAE at 21.20 ± 26.82 mg/g creatinine was higher in the case group. The prevalence of MAU was 11.66% and 3.33% in case and control groups, respectively. The cases had a significantly higher mean eGFR of 123.29 ± 20.49 mL/min/kg as compared with controls who had a mean eGFR of 106.59 ± 10.15 mL/min/kg. There was moderate correlation between anthropometric measurements and eGFR.
Conclusion:
Younger, class 1 obese patients had a higher UAE, eGFR, and three times higher MAU prevalence, even in absence of diabetes and hypertension, with a correlation between anthropometry and eGFR as compared with nonobese individuals.
Keywords
Estimated glomerular filtration rate
microalbuminuria
nondiabetic
nonhypertensive
obesity

Introduction
India is the third most obese country in the world, and obesity has emerged as a major public health issue.[1] Urinary albumin excretion (UAE) is often the first sign of nephropathy. Microalbuminuria (MAU) is a cause of worry, as it is the most important risk factor for the increased morbidity and mortality in the obese population.[2] Population-based surveys have shown an overall prevalence of MAU to be around 4%.[3]
Diabetes and hypertension are well-known risk factors for nephropathy. But, many studies in literature have found that obesity per se even in nondiabetics and nonhypertensives can increase the risk for MAU and therefore nephropathy.[4] Glomerular hyperfiltration leading to abnormally high glomerular filtration rate is often the first sign of renal damage and has also been linked to obesity.[5] Probable mechanisms of all this may be altered production of many adipokines, such as leptin, adiponectin, resistin, and visfatin, which may later lead to development of chronic kidney disease.[4]
Indian obese population is known to have a different biochemical phenotype than other races. There is paucity of Indian studies linking obesity and nephropathy, in absence of diabetes and hypertension.[1]
This study aims to assess the UAE, prevalence of MAU, lipid profile, and values of eGFR (estimated glomerular filtration rate) in obese, nondiabetic, and nonhypertensive patients, vis a vis nonobese healthy subjects, and attempts to correlate body mass index (BMI) and waist circumference (WC) with MAU and eGFR, respectively.
Subjects and Methods
This study was a cross-sectional analytical study. Sample size was calculated at precision of 6% with an expected prevalence according to literature of 12% and a confidence interval of 95% by the formula n = {Z2p(1-p)}/d2, which came out to be 113. Considering 5% loss to follow-up, sample size was calculated to be 120 (60 in each group)..
60 cases and 60 age and sex matched controls were included. Consecutive subjects aged 18 years and more attending out-patient department and wards of a tertiary care teaching hospital in Western India fulfilling inclusion criteria were taken. Institution ethics committee approval was taken and a written, informed consent was obtained from each patient. Subjects with a BMI of >25 kg/m2 and a WC of >90 cm in males and >80 cm in females were included as the case group. Age- and sex-matched subjects with a BMI of 18.5–22.9 kg/m2 and having a WC of <90 cm in males and <80 cm in females were included as control group. Patients having diabetes mellitus (fasting blood sugar >126 mg/dL and/or glycosylated hemoglobin >6.5%, according to the American Diabetes Association guidelines 2018), hypertension according to the eighth report of Joint National Committee, hypothyroidism, ischemic heart disease, and congestive heart failure on the basis of electrocardiography and 2D echocardiography, established renal disease on the basis of deranged renal function tests, macroalbuminiuria and ultrasound, autoimmune disease on the basis of history, acute febrile illness on the basis of fever and laboratory reports, urinary tract infection on the basis of history and urine report, history of drug intake, such as steroid, history of smoking, or any known endocrine disorder were excluded. Dyslipidemia was not excluded as its elucidation was one of the aims, although it was a potentially confounding factor in the analysis. Data were collected using a pretested proforma meeting the objectives of the study. Detailed history was taken and necessary investigations were done. WC was measured midway between the inferior margin of the last rib and the crest of the ilium in a horizontal plane and BMI was calculated by formula: weight (kg)/(height in m)2. Obesity was classified as class 1 and class 2 on the basis of BMI (obese class I: BMI 25.0–29.9 kg/m2 and obese class II: BMI ≥30.0 kg/m2). Patients were investigated after an overnight fast. Complete blood count, renal function test, liver function tests, serum electrolytes, urine routine, including albumin, sugar and microscopy, fasting lipid profile, blood sugar fasting, and postprandial were done in all cases and controls. Presence of UAE and MAU was assessed in each patient by quantitative immunoturbidimetry method on a spot urine sample using Roche diagnostics kit. The laboratory staff were blinded to the group that cases belonged. Reference range of albumin excretion was <30 mg/g creatinine. MAU was defined as 30–300 mg albumin/g creatinine. eGFR values were calculated in each patient by Cockcroft Gault formula: Creat Clear = Sex * ((140-Age)/(Serum Creat)) * (Weight/72). Normal value was 90–120 mL/min/kg. A value >120 mL/min/kg was considered abnormally high in this study.
The data were analyzed using SPSS (2015 version) and WinPepi. Descriptive statistical analysis was carried out. Results on continuous measurements were presented as mean ± SD (Min-Max) and results on categorical measurements were presented in number (%) and Mid – P 95% CI, where applicable. Significance was assessed at 5% level of significance. Mann–Whitney U test was used to find the significance of study parameters on continuous scale between two groups (intergroup analysis), since the data were not normally distributed. Fisher Exact test was used to find the significance of study parameters on categorical scale between two or more groups. Finally, Spearman's correlation coefficient was calculated to find the strength of association between the variables as they were not normally distributed.
Results
In total, 115 patients were potentially eligible to be included as case group, fitting the Asia Pacific definition of obesity, and were examined for eligibility. Around 120 patients were eligible for the nonobese control group. Out of the 115, 60 were confirmed eligible after basic investigations and included in the case group. Similarly, out of 120 subjects, 60 were confirmed eligible for the control group. These were analyzed. The rest of them had one or more exclusion criteria already mentioned.
Overall, 32 (53.33%) subjects in the case group were in age range of 20–30 years, 22 (36.66%) in age range of 30–40 years, and only 6 (10%) were in the >40-year age group [Figure 1]. The mean age of cases was 31.90 ± 6.32 years and of controls was 29.55 ± 7.012 years. Hence, this study had mostly a young population. Among cases, 36 (60%) were male and 24 (40%) were female. Among the controls, 34 (56.67%) were male and 26 (43.33%) were female [Figure 2]. The WC was 90–95 cm in 30 patients (50%), 96–100 cm in 22 (36.66%), and 101–105 cm in 8 patients (13.33%). About 47 patients (78.33%) were in class 1 obese group with BMI of 25–29.99 kg/m2 and 13 (21.66%) were in class 2 obese group with BMI of >30 kg/m2.

- Age distribution in cases
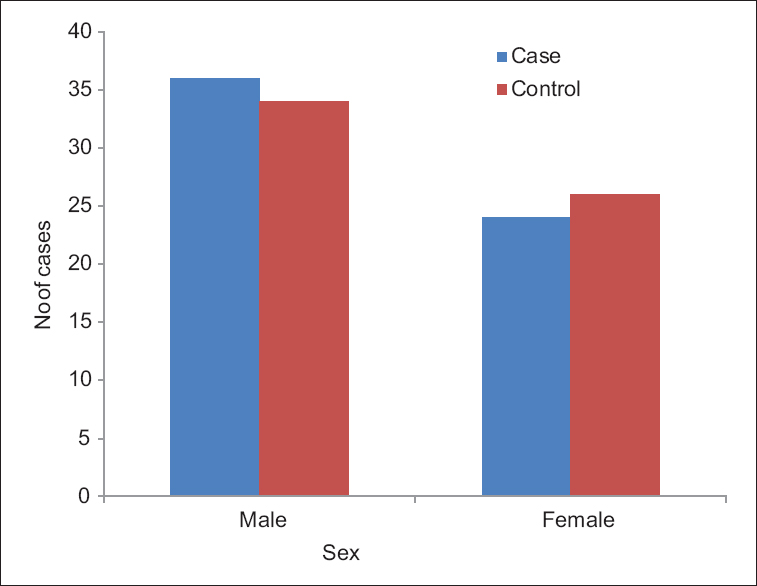
- Sex distribution in cases and controls
In the case group, the mean total cholesterol was 170 ± 25.54 mg/dL as compared with the controls who had a value of 155.78 ± 16.72 mg/dL. Mean triglyceride level in case group was 145.40 ± 64.90 mg/dL as compared with the controls who had a level of 134.94 ± 24.67 mg/dL. The mean high-density lipoprotein (HDL) level was 40 ± 6.26 and 45.33 ± 4.68 mg/dL in cases and controls, respectively. The mean low-density lipoprotein (LDL) values in cases and controls were 111.39 ± 25.39 and 87.47 ± 16.90 mg/dL, respectively. The total cholesterol and LDL were significantly higher (P = 0.000315 and P = 0.00001, respectively) and the HDL significantly lower in obese than in nonobese subjects (P = 0.000011).
The mean UAE in the case group was 21.20 ± 26.82 mg/g creatinine and in controls was 13.55 ± 9.47 mg/g creatinine, a value which indicated that obese subjects had a higher mean value of albuminuria [Table 1]. Of the 60 cases, 7 (11.66%) patients had MAU. Among 60 controls, 2 (3.33%) patients had MAU. The result was, however, not statistically significant (P = 0.163) (OR = 3.83 with 95% CI:0.8-27.65 for cases to have MAU as compared to controls).
| Parameters | Mean±SD | Mann-Whitney P value | |
|---|---|---|---|
| Case (n=60) | Control (n=60) | ||
| Urinary albumin excretion (mg albumin/g creatinine) | 21.20±26.82 | 13.55±9.47 | 0.261 |
| eGFR (mL/min/kg) | 123.29±20.49 | 106.59±10.15 | <0.0001 |
SD: Standard deviation, eGFR: Estimated glomerular filtration rate
The cases had a mean eGFR of 123.29 ± 20.49 mL/min/kg as compared with controls who had a mean eGFR of 106.59 ± 10.15 mL/min/kg, indicating a higher GFR in obese patients, a finding that was statistically significant (P = 0.00001) [Table 1]. Of the 60 cases, 28 (46.67%) patients had an abnormally high eGFR and among 60 controls, only 6 (10%) patients had abnormally high value, a finding that was also found statistically significant. Fishers exact P < 0.001 (OR = 7.88, 95% CI: 2.99 to 22.50) [Figure 3]. The OR was calculated as cross product ie ad/bc and 95% CI were Mid-P exact confidence intervals calculated using WinPepi statistical package. None had an abnormally low eGFR at this stage.
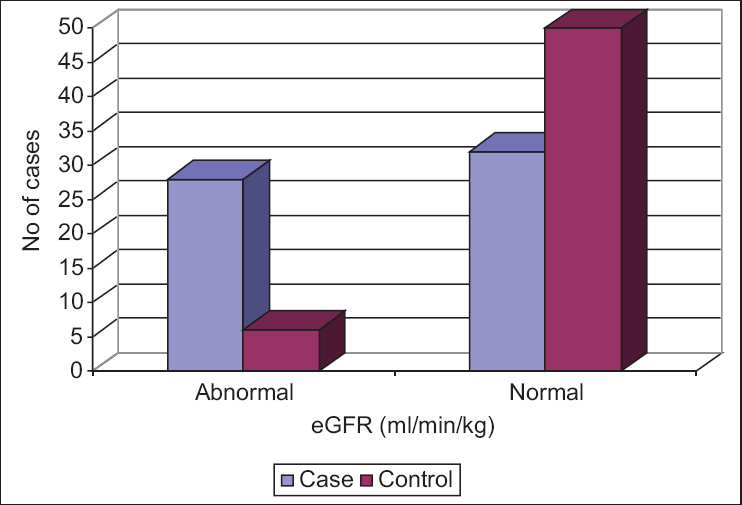
- Estimated glomerular filtration rate wise distribution in case and control group
On analyzing the prevalence of MAU in case group according to various stages of BMI, it was found that out of seven patients having MAU, all were in class 1 obese group [Table 2]. Out of seven patients with MAU, three (42.86%) had a WC of 90–95 cm, two (28.57%) had WC of 96–100, and two (28.57%) had values of 101–105 cm [Table 3]. Among seven patients with MAU, five (71.43%) patients were young, <40 years of age. In patients with normal BMI, mean eGFR was 106.59 ± 10.15 ml/min/kg. In class 1 obese group, the mean eGFR was 122.77 ± 21.65 mL/min/kg and class 2 obese group, mean eGFR was 123.96 ± 18.61. There was no significant difference in eGFR between class 1 and 2 obese groups. Out of the seven patients with MAU, five (71.43%) patients had abnormally high eGFR.
| BMI | MAU (%) | Total | |
|---|---|---|---|
| Present | Absent | ||
| 25-29.99 | 7 (100) | 40 (75.47) | 47 (78.33) |
| ≥30 | 0 | 13 (24.53) | 13 (21.67) |
| Total | 7 (100) | 53 (100) | 60 (10) |
MAU: Microalbuminuria, BMI: Body mass index
| WC (cm) | MAU (%) | Total | |
|---|---|---|---|
| Present (%) | Absent (%) | ||
| 90-95 | 3 (42.86) | 27 (50.94) | 30 (50) |
| 96-100 | 2 (28.57) | 20 (37.74) | 22 (36.67) |
| 101-105 | 2 (28.57) | 6 (11.32) | 8 (13.33) |
| Total | 7 (100) | 53 (100) | 60 (100) |
MAU: Microalbuminuria, WC: Waist circumference
On correlating the various variables, there was moderate correlation between BMI and eGFR (mL/min/kg) (r = 0.435) [Figure 4] and also between WC and eGFR (r = 0.386) in the study group. This suggested that as the BMI and WC increased, eGFR was abnormally higher. No correlation could be established between anthropometric measurements and UAE.
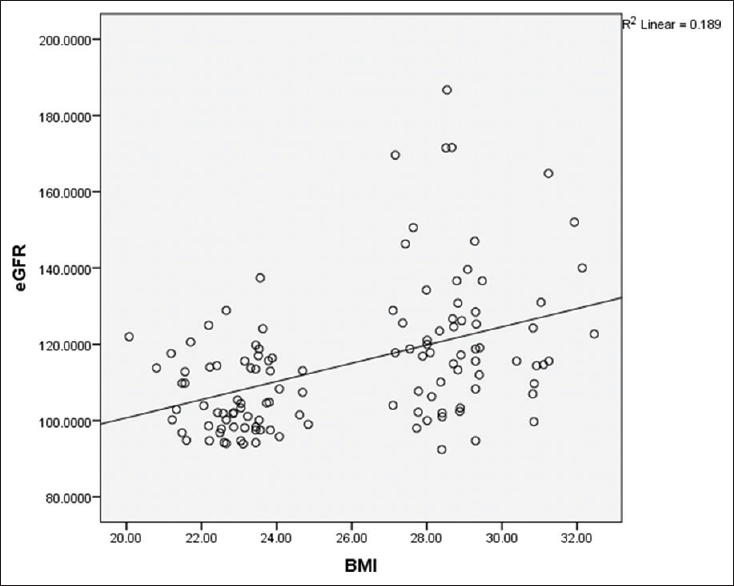
- Correlation between body mass index and estimated glomerular filtration rate
Discussion
In this study, majority of patients were in age group of 20–30 years (53.33%) and 31–40 years (36.66%). In a study by Pavan et al., majority of cases (70%) and controls (63.3%) belonged to 40–60 years of age.[6] In this study, mean age in cases was 31.90 + 6.32 years, similar to a study by Minoo et al., where mean age of the subjects was 30.4 ± 10.7 years.[2] In this study, among 60 cases, 60% were male and 40% were female, and among 60 controls, 56.6% were males and 43.33% were found to be females. In a study by Pavan et al., among the cases, 70% were found to be males and 30% were found to be females, and among controls, 66.7% were males and 33.4% were females.[6]
In this study, total cholesterol and LDL were significantly higher in obese subjects, whereas HDL level was significantly decreased. In a study by Bhatti et al. on obese subjects, all the parameters except serum HDL level showed major increase in obese persons, whereas HDL level was considerably decreased, a finding similar to this study.[7]
In this study, the mean UAE in cases was 21.20 ± 26.82 mg/g creatinine and in controls was 13.55 ± 9.47 mg/g creatinine, a value which was higher although not found statistically significant. This means that UAE was higher in obese subjects as compared with nonobese without any confounding factors, such as diabetes and hypertension. In a study by Valensi et al., daily UAE was significantly higher in obese, nondiabetic, normotensive people.[4] Several studies have also shown that abdominal or visceral obesity is associated with albuminuria.[89] In those studies, abdominal obesity was measured by either bioelectrical impedance or WC. In a study done by Dittman et al., it was found that BMI positively correlated with albuminuria.[10]
In this study, among the cases, 11.66% patients had MAU, whereas among the controls, 3.33% did. This finding was not found statistically significant, although otherwise healthy obese subjects were 3.83 times more likely to develop MAU than the nonobese subjects, even without diabetes and hypertension, according to this study. In a study by Valensi et al., prevalence of MAU was found to be 12.1% in nondiabetic obese people, a value similar to this study.[4]
In this study, cases and controls had a mean eGFR of 123.29 ± 20. 49 mL/min/kg and 106.59 ± 10.15 mL/min/kg, respectively. About 46.67% patients had abnormally higher GFR (>120 mL/min/kg being considered abnormal) and among 60 controls, 6 (10%) patients had abnormal eGFR. Both findings were statistically significant. An abnormally high GFR suggested glomerular hyperfiltration. According to the National Kidney Foundation guidelines, for an age of 20–29 years, average measured GFR (mL/min/1.73 m2) is 116 and keeps decreasing with age; 90–120 is considered normal and >120 is high. More recently published studies presented lower GFR values as normal, i.e., at 100–110 mL/min/1.73 m2.[11] A study carried out by Chagnac et al. and D’Agati et al. showed that glomerular hyperfiltration was linked with severe obesity. GFR was 61% higher in the obese than in the control group (P < 0.00001 for GFR). Obesity induces increased renal plasma flow and glomerular hyperfiltration, which ultimately leads to nephropathy. Obesity-related glomerulopathy: clinical and pathological characteristics and pathogenesis.[1213]
In this study, out of 47 patients who were class 1 obese, with BMI 25–29.99 kg/m2 14.9% had MAU. There were no patients with MAU in the 13 consecutive patients with BMI over 30 kg/m2, which was unexpected. In a study done by Kawar et al., the prevalence of MAU in subjects with BMI of 25 kg/m2 was 3.1% compared with 12.1% in those with BMI 25–30 kg/m2 and 27.2% in obese subjects with BMI 30 kg/m2. The prevalence of MAU here increased drastically with the higher BMI category.[14] In a study done by Minoo et al. on obese and very obese patients (BMI was >30 kg/m2), the overall prevalence of MAU was 11.8% (comparable with our study), and it was more prevalent in very obese compared with obese group, a finding not seen in this study.[2]
In this study, increase in WC was not significantly associated with increase in presence of MAU. In a Korean study, it was found that the prevalence of MAU in a general population was not associated with WC in either men or women.[15]
Out of the seven patients with MAU in this study, 71.43% patients had abnormally high eGFR. In total, 46.67% had abnormally high eGFR. Out of these, 17.8% showed MAU. Due to the strong association between hyperfiltration (abnormally high eGFR) and risk of MAU found in diabetes and hypertension, hyperfiltration is regarded as a precursor of nephropathy in these clinical conditions. Obesity is itself related to glomerular hyperfiltration and with MAU.[13]
In this study, among seven patients with MAU, five patients belonged to age group <40 years. In an Indian study carried out on 50 healthy, young obese (20–30 years), and middle-aged obese-adults (age 31–50 years), there was a 28% frequency of MAU in the study population and 50% in younger age group, <30 years age, pointing to a higher frequency of MAU in young obese Indians.[1]
In this study, no statistical correlation could be established between anthropometric measurements and UAE, whereas a moderate statistical correlation was found between BMI and eGFR and between WC and eGFR in study group, showing that as these anthropometric measurements increased, eGFR increased beyond normal range, suggesting hyperfiltration, in otherwise normal patients. In a study carried out by Naderpoor et al., there was a positive association between eGFR and BMI, and eGFR and WC, but most of all was related to insulin resistance.[16]
The limitation of the study was its small sample size, especially the subjects with class 2 obesity, which may be the reason for the lack of difference in the e GFR between class 1 and 2 obese groups.
Conclusions
Younger, class 1 obese people with no other risk factors had abnormalities, which is a reason for worry. They had a significantly abnormal lipid profile. Mean UAE and eGFR were higher in them. Prevalence of MAU in these subjects was three times higher than controls, although not statistically significant. No statistical correlation was found between anthropometric measurements and UAE. A moderate statistical correlation was found between anthropometric measurements and eGFR, suggesting that an increasing BMI and WC lead to increase in eGFR beyond normal, in otherwise normal subjects confirming that hyperfiltration occurs. Hence, it can be concluded that younger, healthy obese people in this study already had some degree of early renal damage with hyperfiltration and albuminuria.
Financial support and sponsorship
Nil.
Conflicts of interest
There are no conflicts of interest.
Acknowledgement
We thank the Central Clinical Laboratory for its support in the necessary investigations.
References
- Microalbuminuria in obese young and middle aged population: A potential marker of cardiovascular risk. Indian J Clin Biochem. 2016;31:349-52.
- [Google Scholar]
- Impact of the severity of obesity on microalbuminuria in obese normotensive nondiabetic individuals. J Renal Inj Prev. 2015;4:34-8.
- [Google Scholar]
- Microalbuminuria in the US population: Third national health and nutrition examination survey. Am J Kidney Dis. 2002;39:445-59.
- [Google Scholar]
- Microalbuminuria in obese patients with or without hypertension. Int J Obes Relat Metab Disord. 1996;20:574-9.
- [Google Scholar]
- The effects of weight loss on renal function in patients with severe obesity. J Am Soc Nephrol. 2003;14:1480-6.
- [Google Scholar]
- Obesity as an independent risk factor for the development of microalbuminuria. Nephrourol Mon. 2011;3:276-9.
- [Google Scholar]
- Abdominal obesity is associated with albuminuria in women: The 2011 Korea national health and nutrition examination survey. J Womens Health (Larchmt). 2014;23:267-74.
- [Google Scholar]
- Relationship between visceral fat accumulation and urinary albumin-creatinine ratio in middle-aged Japanese men. Atherosclerosis. 2010;211:601-5.
- [Google Scholar]
- U-shaped association between central body fat and the urinary albumin-to-creatinine ratio and microalbuminuria. BMC Nephrol. 2013;14:87.
- [Google Scholar]
- Normal reference values for glomerular filtration rate: What do we really know? Nephrol Dial Transplant. 2012;27:2664-72.
- [Google Scholar]
- Obesity-related glomerulopathy: Clinical and pathologic characteristics and pathogenesis. Nat Rev Nephrol. 2016;12:453-71.
- [Google Scholar]
- Obesity-induced glomerular hyperfiltration: Its involvement in the pathogenesis of tubular sodium reabsorption. Nephrol Dial Transplant. 2008;23:3946-52.
- [Google Scholar]
- High prevalence of microalbuminuria in the overweight and obese population: Data from a UK population screening programme. Nephron Clin Pract. 2009;112:c205-12.
- [Google Scholar]
- Association between body mass index, waist circumference and prevalence of microalbuminuria in Korean adults of age 30 years and older without diabetes, hypertension, renal failure, or overt proteinuria: The 2013 Korean national health and nutrition examination survey. Korean J Fam Med. 2016;37:57-63.
- [Google Scholar]
- Higher glomerular filtration rate is related to insulin resistance but not to obesity in a predominantly obese non-diabetic cohort. Sci Rep. 2017;7:45522.
- [Google Scholar]


