

Translate this page into:
A Study on Effect of Bicarbonate Supplementation on the Progression of Chronic Kidney Disease
-
Received: ,
Accepted: ,
This is an open access journal, and articles are distributed under the terms of the Creative Commons Attribution-NonCommercial-ShareAlike 4.0 License, which allows others to remix, tweak, and build upon the work non-commercially, as long as appropriate credit is given and the new creations are licensed under the identical terms.
This article was originally published by Wolters Kluwer - Medknow and was migrated to Scientific Scholar after the change of Publisher.
Abstract
Introduction:
Chronic kidney disease (CKD) is a major health problem in India. Prevalence of CKD will continue to rise, reflecting the growing elderly population and increasing number of patients with diabetes and hypertension.
Methods:
A total of 67 patients with CKD participated in the study. Patients were randomized into two groups. Group 1 received oral bicarbonate and Group 2 was the control group. Their baseline, 6 and 9 months estimated glomerular filtration rate (eGFR), bicarbonate, muscle mass and serum albumin were estimated. We analysed the effect of bicarbonate supplementation on the progression of CKD.
Results:
Bicarbonate supplementation decreased the metabolic acidosis in CKD patients. After bicarbonate supplementation, the serum bicarbonate level increased time-dependently from 16.62 to 18.02 and 19.77 mEq/L after 6 and 9 months, respectively. It also restored the eGFR to its baseline value. The eGFR values of Group 1 at baseline, after 6 months and 9 months were 22.39, 22.66, and 22.65 mL/min/1.73 m2, respectively. In contrast, the eGFR value in Group 2 reduced significantly. Patients who received bicarbonate supplementation displayed increased serum albumin levels compared with the controls. The albumin level was significantly increased from 4.05 to 4.24 and 4.34 g/dL, respectively, after 6 and 9 months (P = 0.0001). Also, bicarbonate supplementation showed significant improvement in muscle mass.
Conclusion:
Study confirms the role of bicarbonate in relieving the metabolic acidosis and thereby its possible role in the management of CKD progression.
Keywords
Bicarbonate supplementation
chronic kidney disease
glomerular filtration rate
metabolic acidosis
renal disease

Introduction
Chronic kidney disease (CKD) is one of the serious public health problems, characterized by structural and functional abnormalities in the kidney. CKD affects millions of people worldwide with a prevalence of 800 per million populations in India. Diabetes mellitus and hypertension are the common underlying diseases associated with CKD.[1] The major complications of CKD are anemia, cardiovascular disease, renal osteodystrophy, and metabolic acidosis.[2] These complications are mainly responsible for the increased morbidity and mortality of the disease.[2] As the prevalence of patients with CKD is predicted to rise, it is of paramount importance to look for therapeutic approaches to control and treat CKD.
Metabolic acidosis is one of the earliest hallmarks of the CKD. Metabolic acidosis arises due to the inability of the kidney to synthesize ammonia and excrete hydrogen ions. This often results in adverse effects such as bone resorption and osteopenia,[3456] increased muscle protein catabolism,[789101112] exacerbation of secondary hyperparathyroidism,[1314] increased risk of acute illness due to reduced respiratory reserve and exhaustion of body buffer systems,[15] and systemic inflammation.[1617] Thus, overcoming metabolic acidosis is necessary for relieving complications of CKD. Earlier reports have suggested the role of oral bicarbonate supplementation in correcting the metabolic acidosis.[1819] However, we are still in dark in achieving more success toward this. Therefore, in this study, we sought to analyze the effect of oral supplementation of bicarbonate on the progression of CKD.
Materials and Methods
Site and study design
This was a parallel randomized controlled trial, carried out at K. S. Hegde Medical Academy, Mangaluru, India. The approval from the ethical committee was obtained for the study INST.EC/E.C/36/2012-13. Informed consent was taken from the patients.
Study population
Patients with CKD who were visiting Justice K. S. Hegde Charitable Hospital, Mangalore, were considered as the study subjects. A total of 67 patients participated in the study. Patients were randomly grouped into two groups through block randomization. The first group of patients received oral sodium bicarbonate, whereas the second group of patients was on standard therapy without oral sodium bicarbonate supplementation.
The inclusion criteria for the selection of subjects included the following:
Age: >18 years
Estimated glomerular filtration rate (eGFR): 15–30 mL/min/1.73 m2
Serum bicarbonate: 10–20 mM/L
Clinical condition: stable.
The exclusion parameters are as follows:
Patients on steroid therapy
Congestive heart failure
Uncontrolled hypertension (>150/90 mmHg)
Cognitive impairment
Ongoing sepsis
Morbid obesity [body mass index (BMI) ≥40 kg/m2]
Malignancies.
Group 1 received 600 mg sodium bicarbonate orally three times a day. The dosage was increased accordingly to achieve bicarbonate levels >23 mmol/L. All the subjects were followed up on 6 and 9 months. Parameters such as weight, height, and BMI of all the subjects were measured. Also, the subjects were checked for any underlying renal diseases. Venous blood collected from each subject under the aseptic condition and the serum was collected as described by AlRawi 2011.[20] Serum bicarbonate was quantified by following enzymatic procedures using cobas kit (Roche Diagnostics, Switzerland) as per the manufacturer's instructions. The consumption of NADH in the reaction is quantified by measuring absorbance at 340 nm on an automated analyzer (Roche Diagnostics), which is proportional to the bicarbonate concentration in the serum. The concentration of creatinine in serum was analyzed on an automated analyzer using the Roche/cobas CREJ2 assay based on Jaffe's method. The analysis was performed by measuring the absorbance at 505 nm using a green filter. eGFR was measured from the serum creatinine level by applying the MDRD formula (equation 1) using computer software.
eGFR = 186 × serum creatinine−1.154 × age−0.203 × 0.742 (only if female) (Equation 1)
Photometrical estimation of albumin in serum was performed on an automated analyzer using a kit developed for Roche/cobas c systems. Albumin in serum binds with bromocresol green to form a blue-green complex at pH 4.1, which is measured at 630 nm.
Nutritional assessment
For mid-arm circumference (MAC) subject's elbow was flexed to 90° and the midpoint between the tip of acromion and olecranon process was located. The MAC was measured with the subject standing erect by recording the arm circumference with the arm relaxed and elbow extended.
Corrected arm muscle area (CAMA) was measured from MAC using equation 2.
CAMA = {[(MAC − (π × TSF)]2/ 4π} – 10 (Equation 2)
Triceps skinfold (TSF) was measured in the midline of the posterior aspect of the arm, over the triceps muscle, at a point midway between the acromion process and the olecranon process, using the Harpenden skinfold caliper.
Muscle mass (kg) = Height in cm × (0.0264 + (0.0029 × CAMA)) (Equation 3)
Statistical analysis
Comparison of the parameters was done using one-way analysis of variance. Student's t-test was used to calculate the significance between means. Significance was established upon a P value of less than 0.05.
Results
A total of 67 patients were divided into two groups. Group 1 consisted of 33 subjects, out of which 23 (69.7%) were males and 10 (30.3%) were females. Group 2 included 34 patients, of which 25 (73.53%) were males and 9 (26.47%) were females. Out of 67 participants, 5 (7.5%) were of the age less than or equal to 40 years. A total of 31 patients (46.3%) were between 41 and 60 years of age, while the same number of subjects were of the age range 61–80 years. Groups 1 and 2, respectively, consist of 39.4% and 52.9% of subjects in the age range 41–60 years. Furthermore, patients of age range 61–80 years in groups 1 and 2 were 51.5% and 41.2%, respectively. The etiology of patients with CKD in both the groups is represented in Table 1.
| Diagnosis | Group | Total | |
|---|---|---|---|
| Group 1 | Group 2 | ||
| Hypertension | 7 | 8 | 15 |
| 21.2% | 23.5% | 22.4% | |
| Hypertension and diabetes | 10 | 11 | 21 |
| 30.3% | 32.4% | 31.3% | |
| Hypertension, Diabetes and other causes | 3 | 3 | 6 |
| 9.1% | 8.8% | 9.0% | |
| Hypertension and other causes | 4 | 6 | 10 |
| 12.1% | 17.6% | 14.9% | |
| Diabetes | 3 | 0 | 3 |
| 9.1% | 0% | 4.5% | |
| Diabetes and other causes | 3 | 6 | 9 |
| 9.1% | 17.6% | 13.4% | |
| Other causes | 3 | 0 | 3 |
| 9.1% | 0% | 4.5% | |
| Total | 33 | 34 | 67 |
| 100% | 100% | 100% | |
Fisher’s exact test P=0.327. CKD: Chronic kidney disease
The mean weight of groups 1 and 2 was 58.18 and 61.97 kg, respectively, whereas the mean height of groups 1 and 2 was 161.71 and 162.12 cm, respectively. The mean BMI of group 1 was 22.40 and of group 2 was 23.48. It was observed that the difference of mean values of weight, height, and BMI between both the groups was not statistically significant.
Quantification of serum bicarbonate
The bicarbonate concentrations of groups 1 and 2 at baseline were in agreement [Figure 1]. The mean bicarbonate levels of groups 1 and 2 patients were 16.62 and 16.84 mEq/L, respectively [Table 2]. After 6 months, the bicarbonate level of group 1 significantly increased to 18.02 mEq/L, which was further increased to 19.77 mEq/L after 9 months (P = 0.001). In contrast, the bicarbonate level in group 2 remains unchanged after 6 and 9 months (P = 0.301).

- Estimation of serum bicarbonate levels at different time points in both groups
| Parameter | Group | n | Mean | Standard deviation | Lower boundary | Upper boundary | ANOVA F | P |
|---|---|---|---|---|---|---|---|---|
| HCO3 (mEq/L) | Group 1 | <0.001 | ||||||
| Baseline | 33 | 16.62 | 3.05 | 15.54 | 17.70 | 23.867 | ||
| At 6 months | 31 | 18.48 | 1.24 | 18.02 | 18.94 | |||
| At 9 months | 30 | 19.77 | 1.86 | 19.07 | 20.47 | |||
| Group 2 | 0.301 | |||||||
| Baseline | 34 | 16.84 | 2.17 | 16.08 | 17.60 | 1.226 | ||
| At 6 months | 33 | 16.85 | 1.46 | 16.33 | 17.37 | |||
| At 9 months | 28 | 16.32 | 1.80 | 15.62 | 17.02 | |||
| eGFR (mL/min/1.73 m2) | Group 1 | |||||||
| Baseline | 33 | 22.39 | 4.08 | 20.94 | 23.84 | 0.116 | 0.736 | |
| At 6 months | 31 | 22.66 | 5.72 | 20.56 | 24.76 | |||
| At 9 months | 30 | 22.65 | 5.92 | 20.44 | 24.86 | |||
| Group 2 | ||||||||
| Baseline | 34 | 21.21 | 4.37 | 19.68 | 22.73 | 5.060 | 0.010 | |
| At 6 months | 33 | 20.06 | 4.93 | 18.32 | 21.81 | |||
| At 9 months | 28 | 19.88 | 3.92 | 18.36 | 21.41 | |||
| Serum albumin (g/dL) | Group 1 | 0.000 | ||||||
| Baseline | 33 | 4.05 | 0.59 | 3.84 | 4.27 | 9.716 | ||
| At 6 months | 31 | 4.24 | 0.47 | 4.07 | 4.41 | |||
| At 9 months | 30 | 4.34 | 0.44 | 4.18 | 4.51 | |||
| Group 2 | ||||||||
| Baseline | 34 | 4.13 | 0.45 | 3.97 | 4.28 | 1.149 | 0.325 | |
| At 6 months | 33 | 4.04 | 0.42 | 3.89 | 4.18 | |||
| At 9 months | 28 | 4.02 | 0.54 | 3.81 | 4.23 | |||
| Muscle mass (kg) | Group 1 | |||||||
| Baseline | 33 | 20.03 | 4.74 | 18.35 | 21.71 | 8.833 | 0.000 | |
| At 6 months | 31 | 21.54 | 4.99 | 19.71 | 23.37 | |||
| At 9 months | 30 | 21.52 | 4.57 | 19.81 | 23.23 | |||
| Group 2 | ||||||||
| Baseline | 34 | 21.96 | 5.67 | 19.99 | 23.94 | 2.987 | 0.046 | |
| At 6 months | 33 | 21.25 | 4.40 | 19.69 | 22.81 | |||
| At 9 months | 28 | 20.29 | 4.86 | 18.40 | 22.17 |
eGFR: Estimated glomerular filtration rate; ANOVA: Analysis of variance
Post hoc analysis confirmed that the difference in the serum bicarbonate levels of group 1 subjects between different time intervals was statistically significant [Table 3]. The highest difference in the bicarbonate levels was found between baseline and 9 months' subjects (mean difference of − 3.330, P < 0.0001). Furthermore, when both the groups were compared, the difference in the serum bicarbonate value at different time points is highly significant [Table 4].
| Parameter | Group | Mean difference | Standard error | Change (%) | P | |
|---|---|---|---|---|---|---|
| HCO3 | Group 1 | Baseline and 6 months | −2.157 | 0.553 | −11.21 | 0.002 |
| Baseline and 9 months | −3.330 | 0.567 | −18.97 | <0.001 | ||
| 6 and 9 months | −1.173 | 0.299 | −6.98 | 0.001 | ||
| eGFR | Group 2 | Baseline and 6 months | 0.705 | 0.704 | 5.40 | 0.976 |
| Baseline and 9 months | 2.117 | 0.694 | 6.24 | 0.015 | ||
| 6 and 9 months | 1.412 | 0.633 | 0.88 | 0.102 | ||
| Serum albumin | Group 1 | Baseline and 6 months | −0.217 | 0.066 | −4.62 | 0.009 |
| Baseline and 9 months | −0.283 | 0.084 | −7.12 | 0.006 | ||
| 6 and 9 months | −0.67 | 0.046 | −2.39 | 0.476 | ||
| Muscle mass | Group 1 | Baseline and 6 months | −1.757 | 0.375 | −7.54 | 0.000 |
| Baseline and 9 months | −1.394 | 0.569 | −7.46 | 0.046 | ||
| 6 and 9 months | 0.364 | 0.346 | 0.08 | 0.907 | ||
| Group 2 | Baseline and 6 months | 0.725 | 0.544 | 3.23 | 0.582 | |
| Baseline and 9 months | 1.219 | 0.452 | 7.64 | 0.036 | ||
| 6 and 9 months | 0.494 | 0.504 | 4.55 | 1.000 | ||
eGFR: Estimated glomerular filtration rate
| Parameter | Time points | Group | Mean difference | Standard error | P |
|---|---|---|---|---|---|
| HCO3 | Baseline to 6 months | Group 1 | −2.157 | 0.553 | 0.006 |
| Group 2 | −0.04 | 0.255 | |||
| Baseline to 9 months | Group 1 | −3.330 | 0.567 | 0.000 | |
| Group 2 | 0.414 | 0.375 | |||
| 6 to 9 months | Group 1 | −1.173 | 0.299 | 0.000 | |
| Group 2 | 0.418 | 0.277 | |||
| eGFR | Baseline to 6 months | Group 1 | −0.096 | 0.704 | 0.164 |
| Group 2 | 0.705 | 0.704 | |||
| Baseline to 9 months | Group 1 | 0.211 | 0.680 | 0.045 | |
| Group 2 | 2.117 | 0.694 | |||
| 6 to 9 months | Group 1 | 0.307 | 0.563 | 0.103 | |
| Group 2 | 1.412 | 0.633 | |||
| Serum albumin | Baseline to 6 months | Group 1 | −0.217 | 0.066 | 0.000 |
| Group 2 | 0.039 | 0.040 | |||
| Baseline to 9 months | Group 1 | −0.283 | 0.084 | 0.001 | |
| Group 2 | −0.096 | 0.070 | |||
| 6 to 9 months | Group 1 | −0.067 | 0.046 | 0.001 | |
| Group 2 | 0.057 | 0.076 | |||
| Muscle mass | Baseline to 6 months | Group 1 | −1.757 | 0.375 | 0.000 |
| Group 2 | 0.725 | 0.544 | |||
| Baseline to 9 months | Group 1 | −1.394 | 0.569 | 0.001 | |
| Group 2 | 1.219 | 0.452 | |||
| 6 to 9 months | Group 1 | 0.364 | 0.346 | 0.001 | |
| Group 2 | 0.494 | 0.504 |
eGFR: Estimated glomerular filtration rate
Effect of bicarbonate supplementation on eGFR
The effect of bicarbonate supplementation on eGFR is shown in Figure 2. The baseline eGFR values in group 1 and 2 subjects were 22.39 and 21.20 mL/min/1.73 m2, respectively. The difference between these values was not significant (P = 0.257). Similarly, no significant difference was observed in group 1 after 6 and 9 months [Table 2]. The mean eGFR of group 1 patients after 6 and 9 months was equivalent to baseline. In group 2, the eGFR was decreased significantly (P = 0.01) upon time. The mean eGFR after 6 months of duration was 20.06 mL/min/1.73 m2, which further reduced to 19.88 mL/min/1.73 m2 after 9 months. Post hoc analysis [Tables 3 and 4] corroborated that in patients without bicarbonate supplementation (group 2), a significant reduction in the eGFR with a change of about 6.2% from baseline to 9 months was observed (P = 0.045).

- Estimation of eGFR at different time points in both groups
Estimation of serum albumin
Serum albumin levels in both the groups were analyzed. The group without any bicarbonate supplementation did not show any significant change in the serum albumin levels [Figure 3]. There was a slight decrease in the albumin level of group 2 patients at 6 and 9 months (4.04 and 4.10 g/dL, respectively) compared with baseline (4.13 g/dL). Interestingly, group 1 patients displayed increased serum albumin levels compared with baseline (P = 0.0001) [Table 2]. In group 1, statistically significant difference in the serum albumin levels between different time intervals was observed Table 3, wherein baseline to 9 months was highly significant (P = 0.006). When both the groups subjects were compared, the difference in the serum bicarbonate value at different time points was found to be highly significant [Table 4].
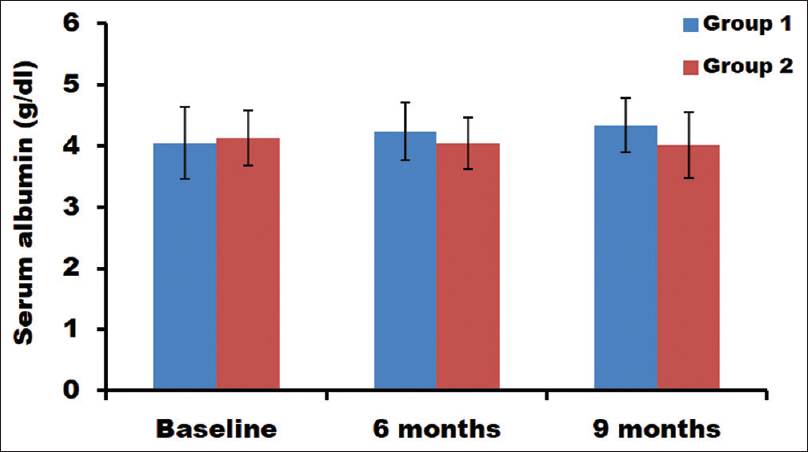
- Estimation of serum albumin levels at different time points in both groups
Muscle mass
In patients with bicarbonate supplementation, significant improvement in muscle mass was observed after a period of 6 and 9 months [Table 2]. The muscle mass of groups 1 and 2 at baseline was 20.03 and 21.96 kg, respectively. After 6 months, the muscle mass was increased in group 1 to 21.54 kg and decreased in group 2 to 21.25 kg. After 9 months, the muscle mass further decreased to 20.29 kg in group 2. These changes in the muscle mass were statistically significant [Figure 4].
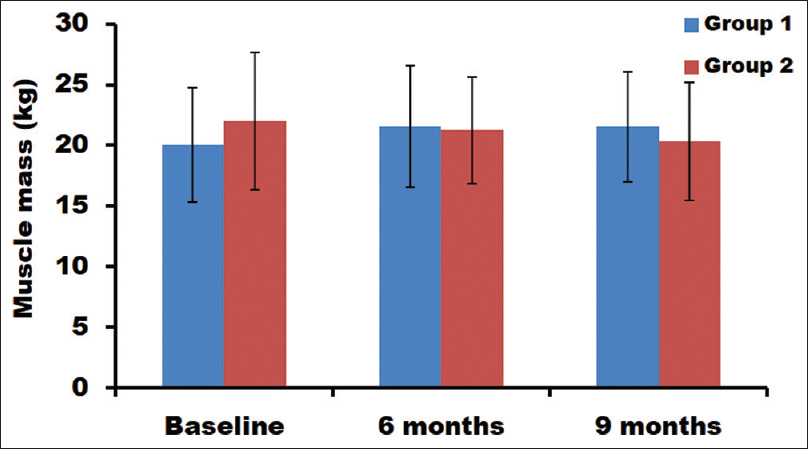
- Estimation of muscle mass at different time points in both groups
When compared between time points, significant improvement in the muscle mass was observed from baseline to 6 months (7.54%) and baseline to 9 months (7.46%) in group 1 [Table 3]. However, no significant improvement was found between 6 and 9 months. In group 2, a significant decrease in muscle mass was observed from baseline to 9 months (7.64%). But no significant changes were noticed between baseline and 6 months, as well as between 6 and 9 months subjects. Furthermore, when compared between the groups [Table 4], at all time points, the muscle mass was significantly different (P = 0.001).
Discussion
High prevalence of CKD in India is a matter of concern due to its associated mortality, morbidity, and complications. Besides diabetes and hypertension, some of the issues which contribute to CKD in India include pollutants, nephrotoxins, poor sanitation, water contamination, consanguinity, and genetic inbreeding.[21] Since the population of patients with diabetes and hypertension in India is growing, management of CKD has become highly important.
Strategies to manage CKD involve delaying the progression of the disease by modifying some of the associated factors. Such modifiable factors which were focused earlier to manage CKD are hypertension, glycemic control, and proteinuria.[2223] Research over the last decade has identified metabolic acidosis as one of the potential factors causing progression of the disease. Typically, serum bicarbonate values during metabolic acidosis condition will be less than 22 mmol/L.[2425] The beneficial effect of oral bicarbonate supplementation on kidney function was reported earlier.[2627] We investigated the role of bicarbonate supplementation in relieving disease complications in patients with CKD. Time-dependent significant increase in the mean bicarbonate levels of group 1 was observed, while no change was reported in group 2. Thus, it was very clear that oral supplementation of bicarbonate decreases the metabolic acidosis during CKD condition, which was also suggested by earlier report.[18]
It is well-known that a decrease in eGFR is very common in patients with CKD. Actually, eGFR rate is an indicator to analyze the severity of disease and to monitor the treatment response.[28] A previous report by Krolewski et al. has confirmed an eGFR loss of ≥3.3% per year in CKD.[29] In our study, bicarbonate supplementation has resulted in the maintenance of eGFR to its baseline value, wherein eGFR was deteriorated in the group without bicarbonate supplementation. This is in agreement with an earlier study which also showed a slower decline in the eGFR post bicarbonate supplementation.[26]
A study by Ballmer et al.[30] validated that metabolic acidosis results in increased nitrogen excretion and decreased albumin synthesis due to increased protein degradation. Consequently, correction of metabolic acidosis in such patients is important to prevent protein (muscle) wasting. de Brito-Ashurst et al.[27] have observed that sodium bicarbonate supplementation was associated with better nutritional status with improved dietary protein intake and decreased protein catabolism in parallel with increased serum albumin and lean body mass. The results of our study support the above conclusion since an improvement in the serum albumin level and the muscle mass in patients who were supplemented with oral sodium bicarbonate was evidenced. Taken together, bicarbonate supplementation helps in delaying the progression of CKD by relieving the effects of metabolic acidosis. Thus, it can be useful in the management of CKD.
Conclusion
In conclusion, the serum bicarbonate level of subjects was increased upon oral bicarbonate supplementation. Oral supplementation also resulted in the maintenance of GFR and increase in serum albumin level among patients with CKD. Furthermore, bicarbonate supplementation also improved the muscle mass in patients with CKD. All these suggest the effect of bicarbonate in relieving the metabolic acidosis and thereby its possible role in the management of CKD progression.
Financial support and sponsorship
Nil.
Conflicts of interest
There are no conflicts of interest.
References
- The effects of chronic acid loads in normal man: Further evidence for the participation of bone mineral in the defense against chronic metabolic acidosis. J Clin Invest. 1966;45:1608-14.
- [Google Scholar]
- Mechanism of acid-induced bone resorption. Curr Opin Nephrol Hypertens. 2004;13:423.
- [Google Scholar]
- Effects of metabolic and respiratory acidosis on bone. Curr Opin Nephrol Hypertens. 1993;2:588.
- [Google Scholar]
- Risks of chronic metabolic acidosis in patients with chronic kidney disease. Kidney Int Suppl 2005:S21.
- [Google Scholar]
- Acidosis impairs insulin receptor substrate-1-associated phosphoinositide 3-kinase signaling in muscle cells: Consequences on proteolysis. Am J Physiol Renal Physiol. 2004;287:F700.
- [Google Scholar]
- Catabolism in uremia: The impact of metabolic acidosis. J Am Soc Nephrol. 1998;9:S78.
- [Google Scholar]
- Correction of acidosis in hemodialysis decreases whole-body protein degradation. J Am Soc Nephrol. 1997;8:632.
- [Google Scholar]
- Metabolic acidosis accelerates whole body protein degradation and leucine oxidation by a glucocorticoid-dependent mechanism. Miner Electrolyte Metab. 1992;18:245.
- [Google Scholar]
- Metabolic balance studies in primary renal tubular acidosis: Effects of acidosis on external calcium and phosphorus balances. J Pediatr. 1966;69:610.
- [Google Scholar]
- Correction of acidosis in hemodialysis patients increases the sensitivity of the parathyroid glands to calcium. J Am Soc Nephrol. 1997;8:627.
- [Google Scholar]
- Electrolyte disorders in chronic renal failure. In: Narins RG, ed. Maxwell and Kleeman's Clinical Disorders of Fluid and Electrolyte Metabolism (5th ed). New York: McGraw-Hill; 1994. p. :1195.
- [Google Scholar]
- Metabolic acidosis and malnutrition-inflammation complex syndrome in chronic renal failure. Semin Dial. 2004;17:455.
- [Google Scholar]
- Low environmental pH is responsible for the induction of nitric-oxide synthase in macrophages. Evidence for involvement of nuclear factor-kappaB activation. J Biol Chem. 1998;273:5086.
- [Google Scholar]
- Oxidative stress, antioxidant status and lipid profile in the saliva of type 2 diabetics. Diab Vasc Dis Res. 2011;8:22-8.
- [Google Scholar]
- Is the lower blood pressure target for patients with chronic kidney disease supported by evidence? Curr Opin Cardiol. 2012;27:370-3.
- [Google Scholar]
- Timing of onset of CKD-related metabolic complications. J Am Soc Nephrol. 2009;20:164-71.
- [Google Scholar]
- Daily oral sodium bicarbonate preserves glomerular filtration rate by slowing its decline in early hypertensive nephropathy. Kidney Int. 2010;78:303-9.
- [Google Scholar]
- Bicarbonate supplementation slows progression of CKD and improves nutritional status. J Am Soc Nephrol. 2009;20:2075-84.
- [Google Scholar]
- Renal function trajectory is more important than chronic kidney disease stage for managing patients with chronic kidney disease. Am J Nephrol. 2012;36:1-10.
- [Google Scholar]
- Early progressive renal decline precedes the onset of microalbuminuria and its progression to macroalbuminuria. Diabetes Care. 2014;37:226-34.
- [Google Scholar]
- Chronic metabolic acidosis decreases albumin synthesis and induces negative nitrogen balance in humans. J Clin Invest. 1995;95:39-45.
- [Google Scholar]


