

Translate this page into:
The Utility of Assessing CD68+ Glomerular Macrophages in Assessing Endocapillary Hypercellularity in IgA Nephropathy
-
Received: ,
Accepted: ,
This is an open access journal, and articles are distributed under the terms of the Creative Commons Attribution-NonCommercial-ShareAlike 4.0 License, which allows others to remix, tweak, and build upon the work non-commercially, as long as appropriate credit is given and the new creations are licensed under the identical terms.
This article was originally published by Wolters Kluwer - Medknow and was migrated to Scientific Scholar after the change of Publisher.
Abstract
Introduction:
IgA nephropathy (IgAN) is the most common form of glomerulonephritis across the world. Oxford classification defines criteria and effects of endocapillary hypercellularity on E score but the reproducibility of the same is debatable. Hence, there is a need for an objective marker that could establish a gold standard in assessing endocapillary hypercellularity.
Methods:
Forty biopsies of proven IgAN were taken and grouped into two groups based on the presence or absence of endocapillary hypercellularity (n = 20 each). These biopsies were then stained by CD68 immune stain and the glomerular macrophages were quantified. Mean serum creatinine, presence of hypertension, degree of proteinuria and haematuria at the time of biopsy were also recorded and the correlation between these parameters and endocapillary hypercellularity was also studied.
Results:
Mean glomerular CD 68+ cell count was significantly higher in glomeruli showing endocapillary hypercellularity. Utilising the objective cutoff values of 0.6 CD68+ per glomerulus, more than 8 glomerular CD68+ cells in the entire biopsy and/or around 4 CD68+ cells in the most inflamed glomerulus, endocapillary hypercellularity can be predicted with a sensitivity of 70–80% and specificity of 70%. After regrouping the biopsies based on the cutoff values obtained from the receiver operating curve analysis the mean urine RBC count per high power field showed a significant correlation with endocapillary hypercellularity.
Conclusion:
Glomerular CD68+ macrophage count seems to be a promising approach in assessing endocapillary hypercellularity. Further studies with emphasis on correlation with the clinical outcome are needed to validate its utility as an objective tool.
Keywords
E score
endocapillary hypercellularity
IgA nephropathy

Introduction
Immunoglobulin A (IgA) nephropathy (IgAN) is the most common form of glomerulonephritis worldwide and most commonly affects young adults. Since 2009, Oxford classification has largely replaced all the previous classifications which were earlier used for IgAN.[12] Patients whose biopsies score E1 (endocapillary hypercellularity) on histopathology are more likely to receive immunosuppression.[3] Score E1 has been independently associated with more rapid loss of renal function and worse renal survival.[4] The Oxford Classification E score (endocapillary hypercellularity) carries prognostic significance and can predict renal function deterioration in IgAN patients but is poorly reproducible.[5] Macrophage infiltration is often seen in glomerular injury and hence, identification of glomerular macrophages by immunohistochemistry (IHC) might assist in identifying endocapillary hypercellularity.
This study aims at assessing the utility of CD68+ glomerular macrophages in identifying E1 lesion in cases of IgAN along with the determination of an objective cutoff value for CD68+ macrophages, which can predict the presence of endocapillary hypercellularity. Besides, we have studied the correlation between the presence and absence of endocapillary hypercellularity and proteinuria, serum creatinine, hypertension and haematuria at the time of biopsy.
Methods
Kidney biopsies with proven IgAN on light microscopy were studied. All the biopsies included in the study had a minimum of 8 viable glomeruli. The clinical and laboratory data were recorded. All the biopsies were reviewed for endocapillary cellularity. The biopsies were then scored following the Oxford classification 2016 on PAS stained sections and were divided into two groups; E1 and E0 based on the presence or absence of endocapillary hypercellularity, respectively [Figures 1 and 2]. Each group had 20 biopsies. Glomerular macrophages were assessed and quantified on CD 68 IHC stained sections using clone KP1 of monoclonal mouse anti-human antibody on Ventana benchmark XT. Mononuclear cells with histomorphological characteristics of macrophage with granular cytoplasmic staining pattern were considered positive [Figures 1 and 2]. The macrophage count was done in every non-sclerosed viable glomerulus.

- E0 lesion on PAS (1, 2); Absence of CD68+ cells on IHC (3, 4) (400×)
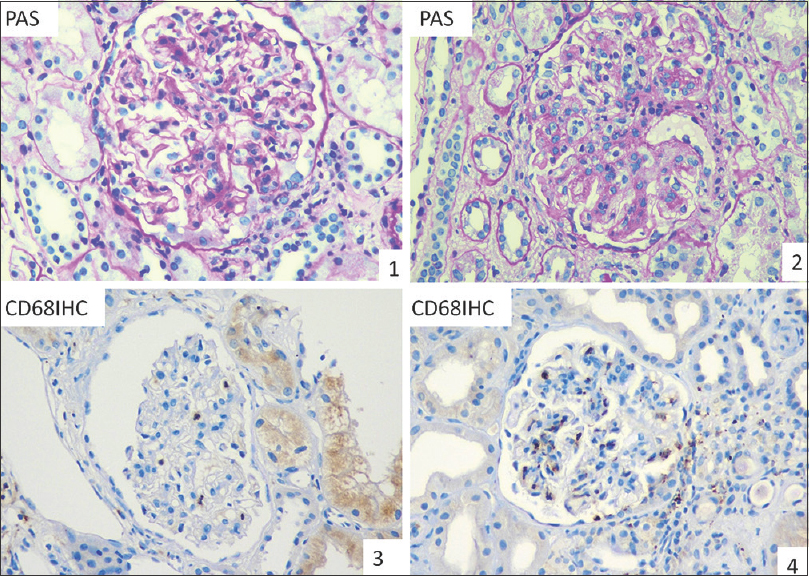
- E1 lesion on PAS (1, 2); CD68+ cells as seen on IHC (3, 4), (400×)
Glomerular macrophage infiltration on IHC stained sections was evaluated under three parameters. A total number of glomerular CD68+ cells in the entire biopsy (CD68+ cell) were estimated. CD68+ cells per glomerulus were obtained by dividing the total number of glomerular CD68+ cells seen in the biopsy by the number of glomeruli seen in a biopsy. This was recorded as CD68+/glom. Besides, CD68+ cells in the most inflamed glomerulus were recorded and documented as CD68 max. The mean values for all of these three variables were obtained and compared between E0 and E1 groups using an independent sample t-test. A cutoff value was also obtained for all of these three parameters using receiver operating characteristic analysis (ROC curve). The respective sensitivity and specificity of the cutoff values of CD68+ cells, CD68+/glom and CD68+ max in determining the presence or absence of endocapillary hypercellularity was also calculated. The relationship between CD68+ macrophage count and continuous M, E, S, T and C variables were estimated through Pearson's product-moment correlation.
Serum creatinine levels were recorded and a mean value was obtained for each group. The intensity of proteinuria on urine dipstick test was assessed as presence or absence of ≤ or >2+ protein and the percentage of cases in each category was recorded. Similarly, the presence or absence of hypertension was documented and recorded as a percentage in both groups. Urine RBC count per high-power field (hpf) was recorded and the mean values were obtained in each group. All these clinical and laboratory parameters were then compared between both the groups by using independent sample t-test and P values were obtained for each of them.
All the 40 biopsies were subsequently regrouped into E0 and E1 group utilising the cutoff values of the parameter glomerular CD68+ macrophages obtained from the ROC curve analysis. The correlation between the clinical parameters and the E score was studied again in a similar manner and P values were obtained for each parameter.
Results
In all the 40 biopsies segregated into E0 and E1 groups based on the presence or absence of endocapillary hypercellularity (n = 20 each), the mean value of CD68+/glom was 0.45 in E0 group while it was recorded as 1.57 in E1 group [Table 1]. The P value obtained was highly significant (P < 0.001). Mean values of glomerular macrophage infiltration in the most inflamed glomerulus CD68+ max [Table 1] were 2.3 and 7.25, respectively in E0 and E1 group. (P < 0.001) The mean values of CD68+ cells in the entire biopsy were recorded as 6.65 in the E0 group and as 26.7 in the E1 group [Table 1]. The P value obtained was highly significant (P < 0.001). There was no significant correlation observed between M, S, T and C scores and glomerular macrophage count.
| Test parameter | E0 (n=20) | E1 (n=20) | P | M score P | S score P | T score P | C score P |
|---|---|---|---|---|---|---|---|
| CD68+/glom | 0.45 | 1.57 | <0.001 | 0.71 | 0.48 | 0.70 | 0.50 |
| CD68+ max | 2.3 | 7.25 | <0.001 | 0.73 | 0.35 | 0.47 | 0.32 |
| CD68+ cells | 6.65 | 26.7 | <0.001 | 0.99 | 0.71 | 0.84 | 0.90 |
Data expressed as mean values; P<0.05 is considered significant
Figure 3 shows that the area under the ROC curve for the test parameter CD68+/glom is 86.8% which implies that the parameter CD68+ cells/glom has good accuracy in distinguishing the two groups i.e., E0 and E1. A maximum cutoff value of 0.6 was derived and had a sensitivity of 75% and specificity of 70% [Table 2]. Similarly the area under the curve for CD68+ max was 87.5%. The cutoff value for CD68+ max was 3.5 with a sensitivity and specificity of 70%. A cutoff value of 8 was calculated for CD68+ cells in the entire biopsy with a sensitivity of 80% and specificity of 70%. The area under the ROC curve for this parameter was 86.9%. The mean value of serum creatinine in both E0 and E1 group was 2.02 (P = 0.995).
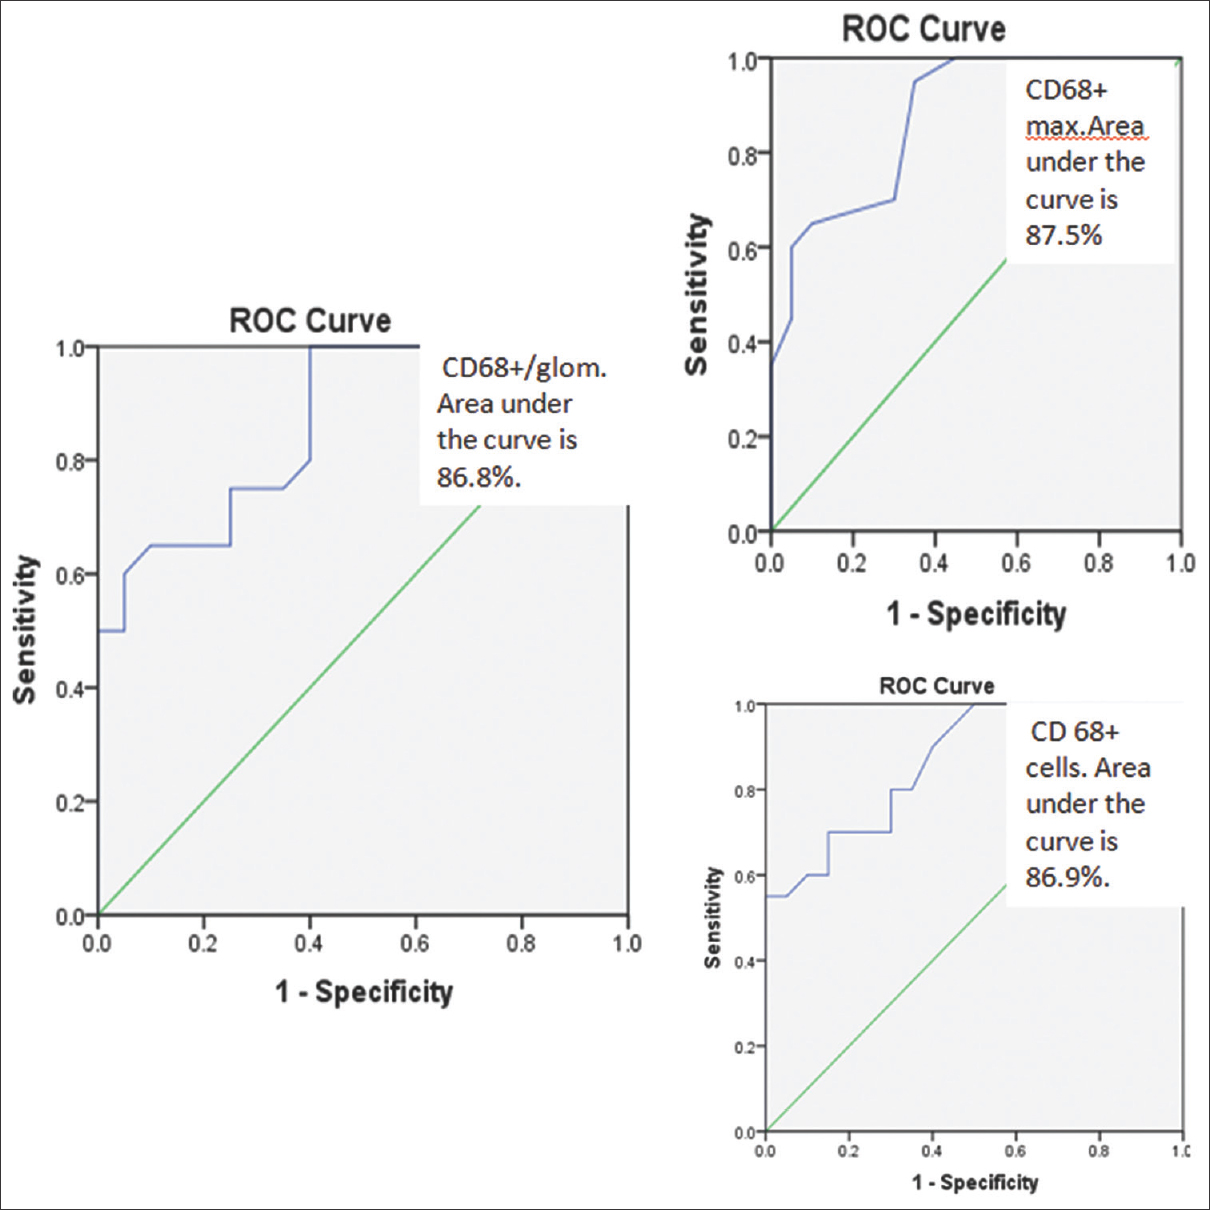
- ROC Curve % (Ref. area >= 90% is excellent, >= 80 is good and >= 70 is fair.)
| Diagnostic parameter | Cutoff value | Sensitivity (%) | Specificity (%) |
|---|---|---|---|
| CD68+/glom | 0.6 | 75 | 70 |
| CD68+ max | 3.5 | 70 | 70 |
| CD68+ cells | 8 | 80 | 70 |
Hypertension in the E0 group was in 76.9% cases while in E1 in 57.14% cases (P = 0.28). Around 55.6% of cases included in the E0 group showed more than 2+ proteinuria on urine dipstick while 51.3% of cases in the E1 group showed a similar intensity of proteinuria (P = 0.61). Mean urine RBC count per high power field did not show any statistical difference between both the groups (P = 0.256). The mean count was 21.79 in the E0 group while it was 27.55 in the E1 group [Table 3].
| E0 | E1 | P | |
|---|---|---|---|
| s.Creatinine (mean) | 2.02 | 2.02 | 0.995 |
| Hypertension (%present) | 76.9 | 57.14 | 0.28 |
| Proteinuria >2+(%) | 55.6 | 51.3 | 0.61 |
| Urine RBC/hpf (mean) | 21.79 | 27.55 | 0.256 |
Using the cutoff value of glomerular CD68+ macrophages in the most inflamed glomerulus (CD68 max) obtained from the ROC curve analysis, all the 40 kidney biopsies were regrouped in E0 and E1 groups [Table 4]. After applying the cutoff values, 4 cases included in the E1 group were regrouped as E0 and similarly, 6 cases included in the E0 group were regrouped as E1. The clinical and laboratory parameters were compared again between both the groups. Mean s.creatinine levels were 2.07 mg/dL in the E0 group and 1.97 mg/dL in the E1 group. (P = 0.40). The percentage of cases showing hypertension in the E0 group was 69.2% while 64.3% of cases had hypertension in the E1 group. Though cases showing more than 2+ urine protein were higher in the E1 group (61.1%) in comparison to the E0 group (40%), it did not reach statistical significance (P = 0.23). Mean RBC count per high power field in urine was significantly higher in the E1 group (35.8) when compared to the E1 group (9.7), (P < 0.001).
| E0 | E1 | P | |
|---|---|---|---|
| s.Creatinine (mean) | 2.07 | 1.97 | 0.40 |
| Hypertension (% present) | 69.2 | 64.3 | 0.79 |
| Proteinuria >2+(%) | 40 | 61.1 | 0.23 |
| Urine RBC/hpf (mean) | 9.7 | 35.8 | <0.001 |
P<0.05 is significant
Discussion
IgAN is the most common cause of primary kidney disease globally and up to one-third of patients with IgAN will progress to kidney failure by 10 years following diagnosis.[67] In India, the prevalence has been estimated to be between 12 to15% of all renal biopsies.[8] As per the Oxford classification of IgAN, endocapillary hypercellularity is defined as “hypercellularity due to an increased number of cells within glomerular capillary lumina, causing narrowing of the lumina”.[9] The identification of endocapillary hypercellularity is an important prognostic factor in determining the clinical course of IgAN. In the original Oxford classification and many of the subsequent studies, E score has not shown a significant correlation with the clinical outcome in patients of IgAN. However, these studies reflect treatment bias as the patients with E score were more likely to receive immunosuppressive therapy which could explain the improved outcome in these patients.[3].
Studies by Karoui et al. and Chakera et al.[41011] reported that the E 1 score was independently associated with more rapid loss of renal function and worse renal survival. The patients in both studies did not receive immunosuppressive therapy. Similar findings were reported by Lee et al.[12] Patients with E1 lesion especially the ones who did not receive immunosuppression showed more rapid loss of renal function. The resolution of endocapillary hypercellularity following immunosuppression further supports the prognostic significance of E score.[13].
Recently the reproducibility of the E score between pathologists has been questioned.[5] Bellur et al. in their study reported that the reproducibility for endocapillary hypercellularity and mesangial proliferation between local and central pathologists was poor.[14] Though Roberts et al.[9] reported moderate reproducibility for global or segmental endocapillary hypercellularity, poor or fair reproducibility was reported for a percentage of glomeruli showing segmental endocapillary hypercellularity. An objective marker that could assess endocapillary hypercellularity with reasonable precision would be extremely helpful to assign a definite E score.
In our study, we were able to demonstrate that the glomerular CD68+ macrophages were significantly higher in the biopsies which showed endocapillary hypercellularity. The area under the ROC curve for all the three test parameters CD68+/glom, CD68+ max, CD68+ cells was >80%; hence all three parameters are good diagnostic tests to identify an E1 lesion. We recommend CD68 max as the preferred method for identifying E1, as endocapillary hypercellularity can manifest as a segmental lesion and might not necessarily be diffuse. Besides, Soares et al.[5] have used similar criteria in their study.
Macrophages have been demonstrated in proliferative glomerulonephritis as a part of endocapillary hypercellularity.[1516] Qiong et al.[17] have emphasised the use of CD 68 positive macrophages to identify endocapillary hypercellularity. Similar findings were reported by Viola et al.[18] The number of glomerular macrophages and the area of glomerular endothelial cells was significantly greater in IgAN than in minimal change disease indicating glomerular inflammation is associated with endothelial cell enlargement. Role of macrophages has also been studied previously in the pathogenesis of lupus nephritis with the highest macrophage infiltration seen in biopsies with diffuse class IV and the lowest number in ISN/RPS class V lupus nephritis.[19].
We used clone KP1 of monoclonal mouse anti-human antibody in our study. Aberrant immunoexpression of CD68 in non-human myeloid-derived cells is more frequent for clones KP1 and EBM11 in cryostat sections in comparison to the clone PG-M1 which was used by Soares et al.[5] to assess the E score. However, in our study cytoplasmic positivity for CD 68 was recorded strictly in an endocapillary lumen in mononuclear cells with histomorphological characteristics of macrophage. Utilising the objective cutoff values of 0.6 CD68+/glom, more than 8 glomerular CD68+ cells in the entire biopsy and/or around 4 CD68+ max, endocapillary hypercellularity can be predicted with a sensitivity of 70–80% and specificity of 70%. Since the number of glomeruli in a biopsy can be variable and also considering the segmental distribution of E1 score in a biopsy, using a maximum number of CD68+ cells in the most inflamed glomerulus (CD68 max) should be favoured. Soares et al.[5] advocated a strong correlation between median glomerular CD68 count and endocapillary hypercellularity. They have proposed that a maximum glomerular CD68 count of 6 is the best cutoff for distinguishing E0 from E1 (sensitivity 94.1%, specificity 71%, area under the ROC curve = 89%). Besides, they emphasise that identification of endocapillary hypercellularity in biopsies with a maximum glomerular CD68-count >6 was reproducible with a kappa score of 0.8.
Though we did not observe any statistically significant association for presence or absence of hypertension, more than 2+ proteinuria, urine RBC count and s.creatinine levels at the time of biopsy with E score, after regrouping the clinical data based on the cutoff value values of glomerular CD68+ cells obtained, mean URBC count showed a significant association with the presence of endocapillary hypercellularity. Tiwari et al.[20] described the correlation of haematuria with renal histology. They were able to show a correlation of gross haematuria with a degree of endocapillary proliferation and tubular atrophy and interstitial fibrosis. It was concluded that haematuria correlates well with the presence of severe lesions like endocapillary proliferation on biopsy.
Identification of CD 68+ tissue macrophages by immunohistochemistry to assess endocapillary hypercellularity seems to be a promising approach. A limitation of this study was that follow-up data were not available for these patients. Further studies with larger sample numbers, multivariate analysis, and clinical correlation are required to validate it.
Declaration of patient consent
The authors certify that they have obtained all appropriate patient consent forms. In the form, the patient(s) has/have given his/her/their consent for his/her/their images and other clinical information to be reported in the journal. The patients understand that their names and initials will not be published and due efforts will be made to conceal their identity.
Financial support and sponsorship
Nil.
Conflicts of interest
There are no conflicts of interest.
References
- The Oxford classification of IgA nephropathy: Rationale, clinicopathological correlations, and classification. Kidney Int. 2009;76:534-45.
- [Google Scholar]
- The Oxford IgA nephropathy clinicopathological classification is valid for children as well as adults. Kidney Int. 2010;77:921-7.
- [Google Scholar]
- IgAN classification Working group of the International IgA nephropathy network and the renal pathology society. Oxford classification of IgA nephropathy 2016: An update from the IgA nephropathy classification working group. Kidney Int. 2017;91:1014-21.
- [Google Scholar]
- Prognostic value of endocapillary hypercellularity in IgA nephropathy patients with no immunosuppression. J Nephrol. 2016;29:367-75.
- [Google Scholar]
- Relationship between glomerular macrophages and the Oxford classification of IgA Nephropathy. Histopathology. 2019;74:629-37.
- [Google Scholar]
- IgA nephropathy in Kerala, India: A retrospective study. Indian J Pathol Microbiol. 2009;52:14-6.
- [Google Scholar]
- The Oxford classification of IgA nephropathy: Pathology definitions, correlations, and reproducibility. Kidney Int. 2009;76:546-56.
- [Google Scholar]
- A clinicopathological study of thrombotic microangiopathy in IgA nephropathy. J Am Soc Nephrol. 2012;23:137-48.
- [Google Scholar]
- Focal segmental glomerulosclerosis plays a major role in the progression of IgA nephropathy. II. Light microscopic and clinical studies. Kidney Int. 2011;79:643-54.
- [Google Scholar]
- Validation of the Oxford classification of IgA nephropathy: A single-center study in Korean adults. Korean J Intern Med. 2012;27:293-300.
- [Google Scholar]
- Reversal of active glomerular lesions after immunosuppressive therapy in patients with IgA nephropathy: A repeat biopsy based observation. J Nephrol. 2015;28:441-9.
- [Google Scholar]
- Reproducibility of the Oxford classification of immunoglobulin A nephropathy, impact of biopsy scoring on treatment allocation and clinical relevance of disagreements: Evidence from the Validation of IGA study cohort. Nephrol Dial Transplant. 2019;34:1681-90.
- [Google Scholar]
- Clinical usefulness of CD68 staining in children with various glomerular diseases. Nihon Jinzo Gakkai Shi. 2014;56:532-7.
- [Google Scholar]
- Identification of alternatively activated macrophages in new-onset paediatric and adult immunoglobulin A nephropathy: Potential role in mesangial matrix expansion. Histopathology. 2011;58:198-210.
- [Google Scholar]
- Characterization and quantification of proliferating cell patterns in endocapillary proliferation. Nephrol Dial Transplant. 2012;27:3234-41.
- [Google Scholar]
- Prognostic value of morphologic and morphometric analyses in IgA nephropathy biopsies. Transl Med Commun. 2016;1:7.
- [Google Scholar]
- CD163+M2c-like macrophages predominate in renal biopsies from patients with lupus nephritis. Arthritis Res Ther. 2016;18:90.
- [Google Scholar]
- Correlates of hematuria on glomerular histology and electron microscopy in IgA nephropathy. Med J Armed Forces India. 2016;72:120-4.
- [Google Scholar]


