

Translate this page into:
Reverse Epidemiology for Lipid Disorders in Hemodialysis-Dependent Patients: Role of Dilutional Hypolipidemia
-
Received: ,
Accepted: ,
This article was originally published by Wolters Kluwer - Medknow and was migrated to Scientific Scholar after the change of Publisher.
Abstract
Introduction:
Atherosclerotic cardiovascular disease is a major cause of mortality and morbidity in dialysis patients. Compared to general population, dialysis patients have lower lipid levels and higher vascular events. This paradox is popularly known as reverse epidemiology. Present study is an attempt to understand reasons for low lipids in dialysis patients.
Subjects and Methods:
This was a prospective observational multicentric study involving three stages across six dialysis units with Care Hospitals, Hyderabad. Maintenance hemodialysis patients were studied with fasting lipid profiles [TC, LDL-c, HDL-c, and TG], pre- and post-dialysis blood lipids and effluent water lipid profiles. Other parameters studied were use of statins, interdialytic weight gain, and ultrafiltration. All patients had uniform dialysis protocols regarding filter used and dialysis duration.
Results:
Of the 91 patients studied, we observed significant rise in post-dialysis TC, LDL, and HDL [P < 0.01] and lower lipids [P < 0.01] just before the next dialysis. Lipids were least filtered across the membrane except HDL, which was found in effluent water for more than 60% of patients. Single use of dialyser was associated with higher rise in post dialysis lipids as well as HDL getting filtered in effluent [P = 0.24]. Rosuvastatin was associated with lower lipid values [P = 0.08] and BMI [P = 0.19].
Conclusions:
Low lipid levels in dialysis patients are due to dilutional hypolipidemia and needs correction with an equation proposed in present study. Corrected lipids should be used for risk stratification and deploying treatment.
Keywords
Atherosclerotic cardiovascular disease
dilutional hypolipidemia
haemodialysis
lipid disorders

Introduction
Lipids are heterogeneous biological molecules having roles in energetic processes, cellular membrane functions, synthesis of bile acids, and steroid hormones besides synthesis of vitamin D. Lipids are transported in blood in the form of hydrophobic monolayer of triglycerides and esterified cholesterol enveloped by hydrophilic layer of apolipoproteins, phospholipids, and other polar proteins. Lipoproteins are macromolecular particles composed of characteristic lipids and proteins that serve to transport the otherwise insoluble triglycerides and cholesterol molecules. Circulating lipoproteins range in size from 5 to >1,000 nm and can be separated according to density. HDL is smallest, containing the least lipid and the most protein, whereas chylomicrons are largest and lipid rich.
CKD patients are usually characterized by high triglycerides and low HDL levels, normal or slightly reduced LDL cholesterol.[1] LDL Cholesterol is not a reliable predictor of cardiovascular risk factor in patients with advanced CKD. Moreover, in patients with ESRD, low cholesterol levels have been related to high mortality risk, probably reflecting chronic inflammation and malnutrition, leading to a seemingly paradoxical reversal of the well-established association of higher lipid levels with mortality in the general population.[2]
CKD is associated with a reduced activity of lecithin-cholesterol acyl transferase (LCAT), an enzyme linked to HDL and responsible for the conversion of cholesterol into its esterified forms, allowing hepatic removal of cholesterol. LCAT dysfunction causes morphological changes to HDL, which acquire a spherical rather than disc shaped structure, with resulting alteration of their catabolism.[346] Furthermore, downregulation of LP and LPL could be induced by a mechanistically poorly understood secondary hyperparathyroidism, a common complication observed in CKD leading to worsening dyslipidaemia.[57] Therefore, in advanced CKD or dialysis-dependant patient's low lipid levels are associated with atherosclerosis and CV mortality and morbidity.[89] These low cholesterol levels may be because of malnutrition, systemic inflammation, and use of cholesterol lowering agents.[1011]
Even within the domain of lipids and lipoproteins, increased serum LDL cholesterol level is not a prominent feature in dialysis patients. Instead, hypertriglyceridemia is the hallmark of uremic dyslipidaemia.[12] This could be the reason why guidelines published by KDIGO discourage use of or initiating use of cholesterol lowering agents in advanced CKD and dialysis population.
We at Care Hospital, Hyderabad tried to look into a newer aspect of lower and abnormal lipid levels in dialysis population. The lower levels of cholesterol and other lipids could be attributable to their loss during dialysis itself. Just as macromolecule like albumin (weight 63 kDa) are lost during hemodialysis, we tried to demonstrate if cholesterol/lipids were also lost in dialytic process repeatedly that could contribute to lower/abnormal lipid levels in hemodialysis patients. Moreover, loss of cholesterol during dialysis may result in deranged lipidomic and contribute to dyslipidaemia and reverse epidemiology seen in dialysis patients. Indian studies on the effect of hemodialysis on lipid levels are indeterminate and inconsistent. There is insufficient data on the effect of hemodialysis on lipoproteins in ESRD patient on haemodialysis. Hence, the present study was delineated to assess alterations in the lipoproteins before and after hemodialysis session.
Aims
-
To study the lipid profile pattern in hemodialysis dependant patients.
-
To study filtration of cholesterol/lipids across dialysis membrane and its impact on lipid profile.
-
To study alteration in lipid profile pre and post hemodialysis
-
To study the effect of other factors like dialysis filter re use.
Subjects and Methods
Inclusion criteria
Randomly selected adult patients with ESRD on maintenance hemodialysis and who consent to study and sample collection were selected.
Exclusion criteria
-
Patients with acute kidney injury
-
Patients with chronic liver disease
Patient attending dialysis units for MHD were randomly selected. During run in stage, baseline characteristics like anthropometry, presence of coronary artery disease, and use of cholesterol lowering agents along with baseline fasting cholesterol levels were noted. This was an observational study, hence we used simple formula for sample size calculation (4PQ/d2). We had our sample size at 87. Following base line data collection and analysis stage 1 was initiated. We measured pre- and post-dialysis blood lipid profiles and dialysis effluent lipid profiles. After stage 1 analysis, stage 2 was initiated. In stage 2, we measured pre- and post-HD lipid profiles with lipids spent in dialysis effluent along with next day fasting lipids profile. After completing 2 stages of study, stage 3 was initiated. In stage 3 lipid profile just prior to next dialysis were estimated [Figure 1]. It was designed to look for factor/s that caused elevation in serum lipid profiles in between two dialysis. These factors included ultrafiltration, single use/re use of dialyzer, dialyzer type. To confirm dialysis efficacy, urea/creatinine clearance and Kt/V were also measured for the same dialysis session. Total number of patients participated in each stage was as follows: Stage one 91, stage two 17, and stage three 32 [total 140].

- A new look at lipid disorders in haemodialysis dependant patients: Role of plasma dilution. [Study workflow]
All patients used low flux hemodialyzer (Fresenius F6/F5) only. Every dialysis was outpatient dialysis of 4-h duration with blood flow rates of 250–350 ml/min and dialysate flow of 500–600 ml/min. Single use and re use practices for hemodialyzer were noted for all patients and tabulated. Ultrafiltration was based on interdialytic weight gain and targeted ideal body weight.
Results
Stage 1 – This was the first part of study of lipid profile variations in patients on single dialysis session. It included 98 patients on thrice a week MHD. Out of these 98 patients, 91 patients consented to participate in study and they were tested for pre-HD, post-HD, and effluent lipid profile (TC, LDL-c, HDL, TG). Study population had male predominance (74.7%). Table 1 compares all four components of lipid profile. It showed statistically significant rise of TC, LDL, and HDL post-hemodialysis (P = <0.01). Triglycerides was insignificantly decreased post dialysis.
| Variable | Post dialysis | Pre dialysis | P |
|---|---|---|---|
| TC | 165.25±52.78 | 141.98±38.28 | <0.01 |
| LDL | 80.76±33.86 | 69.33±28.4 | <0.01 |
| HDL | 42.33±13.05 | 35.53±11.15 | <0.01 |
| TG | 129 (52-994) | 137 (40-1200) |
Though mean HDL was higher in post dialysis period, we could find that 36 patients losing HDL in effluent with mean loss of 0.3 mg/dl/session. Table 2 shows two groups; HDL losers and non-losers. It showed lower cholesterol (TC) levels in patients who lost HDL in effluent (P = 0.19). Among the 36 patients who had HDL in their effluent, majority were re-using dialyzer (n = 31, P = 0.24 Stage-2 included 18 patients from another dialysis unit with Care Hospitals. Out of 18 patients, 17 consented for the study. Patient information and data collection was done on the same lines of stage 1, except fasting lipid profile samples obtained a day after HD [Table 3]. It showed consistent rise in post-HD lipids. Moreover, fasting lipid values were still lower than pre-HD lipids. We compared patient on single use or re use of dialyzers. Single use of dialyzer was associated with higher rise in post HD TC, LDL, HDL (P = 0.16, P = 0.38, P = 0.21, respectively).
| Variable | HDL in effluent (n=36) | Effluent without HDL (n=55) | P |
|---|---|---|---|
| Chol | 139.28±38.37 | 141.27±33.81 | 0.19 |
| CAD | 20 (55.6%) | 32 (50.8%) | 0.64 |
| Re-use | 31 (86.1%) | 48 (76.2%) | 0.24 |
| Single-use | 5 (13.9%) | 15 (23.8%) |
| Variable | Fasting (n=16) | Pre HD (n=17) | Post HD (n=17) | P |
|---|---|---|---|---|
| TC | 130 (100-199) | 129 (95-173) | 142 (78-229) | 0.04 |
| LDL | 60.13±21.26 | 67.06±17.42 | 76.76±23.16 | 0.07 |
| HDL | 28.87±7.74 | 33.73±8.68 | 37.57±10.67 | 0.03 |
| TG | 123±85.14 | 152.18±100.81 | 181.29±151.23 | 0.36 |
In another dialysis unit, post-dialysis rise in lipid profile was studied. Table 4 shows post-dialysis rise in lipid levels in 32 patients in stage 3 of the study. Rise in lipids post-dialysis was higher with single use dialyzer. We also found that ultrafiltration and reuse or single use of dialyzer affected this rise. These observations were used to derive equations to nullify dilutional effect and get accurate lipid values for patients on hemodialysis.
| Variable | Pre-Dialysis | Post-Dialysis | P |
|---|---|---|---|
| Total (n=32) | |||
| TC | 135.06±33.85 | 153.66±44.17 | <0.01 |
| LDL | 65.16±22.52 | 76.78±28.67 | <0.01 |
| HDL | 33.74±11.32 | 46.41±16.21 | <0.01 |
| Re-Use (n=22) | |||
| TC | 125.55±31.68 | 139.91±40.66 | <0.01 |
| LDL | 58.32±19.31 | 67±24.1 | <0.01 |
| HDL | 37.41±11.47 | 45.5±16.74 | <0.01 |
| Single use (n=10) | |||
| TC | 156±29.52 | 183.9±37.19 | 0.01 |
| LDL | 80.2±22.59 | 98.3±27 | 0.02 |
| HDL | 37.2±11.59 | 48.4±15.65 | 0.01 |
Discussion
Guidelines for management of lipid abnormalities in general population and those with CKD including ESRD differ significantly. Recent guidelines by American Heart Association (AHA) 2018[13] rely on risk stratification calculators and coronary calcium scores along with other parameters. Consensus is to keep LDL at or below 70 mg/dl in those who require lipid lowering agents (LLA).[6] But in hemodialysis-dependent patients, use of LLAs is largely discouraged. KDIGO do not recommend a target level of LDL or other lipid components to achieve with prevailing drug therapy. At the same time, we acknowledge higher atherosclerotic risk in dialysis population coupled with comparatively low or normal lipid levels than general population. This paradox is largely popularized as reverse epidemiology.
Present study was an interrogation into lipid profile values in MHD patients and impact of thrice weekly dialysis on lipid level dynamics. We studied total 140 patients on MHD from 6 different dialysis centers. They were studied in 3 stages with fasting lipid profiles, pre-HD, and post HD lipid profiles. Clearance of lipids in dialysate effluent was also measured for all 4 components of lipids.
Rise of lipids: In stage one, we had baseline cholesterol values for all dialysis patients. After enrollment, their pre-HD lipids were found to be significantly lower (P = <0.01) than post-HD lipid values. Post-dialysis rise in lipids was for TC, LDL-c, and HDL-c; but not so for TG. Higher post-HD lipid values were associated with significantly falling lipids (P = <0.01) just before next dialysis session. This explained that lipid levels for MHD depend on timing of sample collection in relation to dialysis session. By obvious logic, post-dialysis patients are euvolemic and nearing their ideal body weight. Pre-HD lipid levels are diluted due to volume overload creating a state of spurious dilutional hypolipidemia. These findings prompted us to consider post-HD lipid levels as true lipids that should be used to guide risk stratification and treatment.
Use of statins: Patients with MHD are high risk patients for development of atherosclerosis irrespective of their age and dialysis vintage.Study population had average age of 60 years, 75% of these being males. But, in stage one , 37% and in stage two 61% patients were not using any of the lipid lowering agents owing to their low fasting lipids. Among those using statins, rosuvastatin associated with lower cholesterol and BMI. Significant number of patients with CAD (22.9% P = <0.01) and 31.4% of diabetic patients (P = < 0.01) did not use statins.
Clearance of lipids in dialysis: Lipids are macromolecules having molecular weight in thousands of dalton (LDL-c 3–5 million Da) and have higher diameters (LDL-c 26 nm) that cannot be filtered by low flux dialyzer. In present study, lipid profiles were tested for dialysis effluent water. It was found to have very negligible amount of lipids in it. But, 36 patients in stage 1 (39.5%) and 10 patients in stage 2 (58.8%) had HDL in the effluent water. Average amount of HDL lost in one dialysis session is 0.3 mg/dl. Such a minimal quantity of HDL if lost persistently over 1 year may translate into a cumulative loss of 43.2 mg/dl of HDL per year (presuming 144 dialysis sessions per year). For a dialysis session of 4 h and with dialysate flow rate of 500 ml/min, we calculated HDL clearance at 5.70 ml/min. This was derived with simple UV/P equation with (U) at 0.30 mg/dL, (V) 120 L and average (P) at 26.3 mg/dL. Clearance equations were not derived for other lipid fractions as their values being negligible in effluent water. How body deals with dialytic loss of HDL may be a matter worth discussion. Patients with dialysis clearance of HDL had lower BMI, higher CAD prevalence but not statistically significant. More number of patients with reuse of dialysis filter were associated with loss of HDL in effluent. Rise of lipids post-HD was more pronounced with single use of dialyzer (P = 0.16).
Dialysis filters reuse reduces cost of dialysis and also the inflammatory responses towards new dialyzer. But as number of reuse increases, efficiency of filter goes down as it gets coated with plasma proteins. We observed 81.1% of people having HDL in their dialysate effluent were reusing the filter (P = 0.24). Post-dialysis rise in TC was higher with single use than reuse of filter (P = 0.16). Numerically more patients with diabetes (78.6%, P = 0.53) and CAD (P = 0.52) were reusing their dialysis filter. All these findings were insufficient to prove that re use practices adversely affected lipid profiles and increased risk of atherosclerosis.
Once it was confirmed that lipids rise after hemodialysis, we needed to know determinants of its rising levels. For this purpose, we initiated third stage of the study. It included 32 patients from 3 different dialysis centers. We studied ultrafiltration and reuse practices for dialyzer filters as determinants for post-dialysis rise in serum lipids. All dialyzers were F6 filters and reuse methods were uniform. TC and LDL-c followed similar pattern post-dialysis. Roughly for every 1 L of fluid removal, rise in TC and LDL-c was 10 +/- 3 mg/dl above pre-HD value. It explained that more interdialytic fluid/weight gain leads to lower measurements of per HD lipid levels. We observed mean ultrafiltration of 2.6 L per 4 h session. Once patient reached euvolemia after adequate ultrafiltration, we achieved higher measurements of lipids in blood. Second determinant that drew our attention was reuse of dialyzer. In patients with single use of dialyzer, extent of rise in post-HD lipid values was higher compared to patients reusing filter. Single use dialyzer has less coating of plasma proteins, hence adsorbs lesser number of lipids/lipoproteins. This led to greater post dialytic rise in serum lipids when dialyzer was single use. Moreover, ultrafiltration was better with single use dialyzers rather than reuse of dialyzer. Additionally, use of lipid lowering agents was more pronounced with patients reusing their dialyzers. Nonetheless, amount of ultrafiltration happening was contributing more to post dialytic rise in lipid fractions rather than reuse practices.
Hemodialysis is a multidimensional process, adequacy of which depends on multiple factors like access recirculation, use or no use of anticoagulation, access used for dialysis and dialysis dose per week. Post-dialysis samples may not be available every time for measuring lipids. Hence, we needed to predict post-dialysis value from fasting lipids with a correction factor incorporated. Correction factor was based on amount of fluid overload above ideal body weight and use or reuse of dialyzers.
Deriving correction formula for fasting lipids
From regression analysis of data out of stage 3 of study, we could prepare a correction for fasting lipids. This employs two parameters, one weight gain/ultrafiltration required and two single use or reuse of dialyzer. Instead of checking lipids post dialysis, we used these equations to derive their corrected lipid levels. These corrected values should dictate their risk for atherosclerotic cardiovascular disease (ASCVD) and therapy required. Following graphs (Stage 3: Graph 1) indicate that post-dialysis lipids derived from formula and actual laboratory values for post-dialysis lipids match significantly. As calculated and actually measured lipid values matched, we believe these equations are validated and can be used for further studies. If further studies also show similar pattern, these equations can be used as standard of care for patients with CKD 5D.
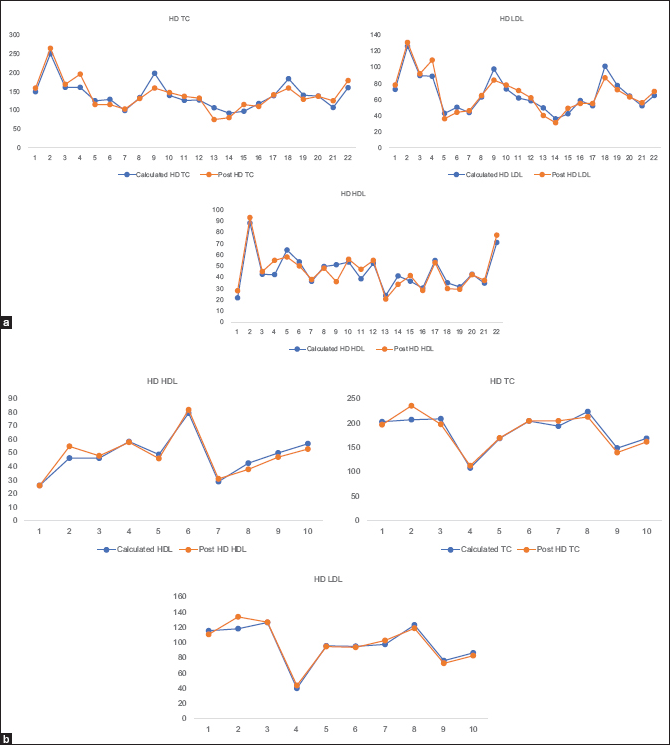
- (a) Post dialysis lipids derived from Correcting Equations and (b) measured laboratory values for post dialysis lipids. [Blue line - calculated values from equations and orange line – actually measured values]. (a) Dialyzer Reuse: [ Number of patients: 22]. Measured versus Calculated Total Clolesterol / LDLc / HDLc. (b) Dialyzer Single Use: [Number of patients: 10] Measured versus Calculated Total Clolesterol / LDLc / HDLc
Reuse
c TC = (-20.59) + (1.08 × fa TC) + (10.07 × Weight gain)
c LDL = (-9.96) + (4.32 × Weight gain) + (1.13 × fa LDL)
c HDL = (-7.91) + (2.68 × Weight gain) + (1.24 × fa HDL)
Single use
c TC = (-105.08) + (1.483 × fa TC) + (20.71 × UF)
c LDL = (-35.80) + (1.32 × fa LDL) + (9.93 × UF)
c HDL = (-9.105) + (1.142 × fa HDL) + (5.410 × UF)
cTC: corrected total cholesterol [mg/kg]
cLDL: corrected LDL [mg/dl]
cHDL: corrected HDL [mg/dl]
weight gain [kg]: actual body weight [kg] - ideal body weight [kg]
fa TC: fasting total cholesterol [mg/kg]
fa LDL: fasting LDL [mg/dl]
fa HDL: fasting HDL [mg/dl]
Till now we measured lipids in fasting state for dialysis patients and believed they are low or low normal. This could be one reason why lipid lowering agents are not used frequently in dialysis patients though CKD stage 5D is high risk state for ASCVD. At the same time, we have no concrete ways to deal with ASCVD in dialysis population. We found that fasting lipids are spuriously low due to dilution effect. We suggest calculating corrected lipids and device treatment based on those values and use Risk Score Calculators with CKD5D incorporated in it. This gives us one aspect to modify treatment for dialysis patients. If this approach translated into better outcomes, it may be worth watching in future.
Conclusions
This study brings up another aspect of low lipid levels which is dilution of blood with interdialytic fluid gain. This “dilutional hypolipidemia” was seen significantly and persistently in all patients in this study population. Hence, we suggest, lipid levels be checked in hemodialysis dependent patients either after adequate ultrafiltration (patient reaching dry weight) or with a correcting equation/formula proposed in the present study. Single use of dialysis filter (dialyzer) was associated with higher rise in post-dialytic lipids. We suggest, therapy be based on these corrected lipid levels.
Declaration of patient consent
The authors certify that they have obtained all appropriate patient consent forms. In the form the patient(s) has/have given his/her/their consent for his/her/their images and other clinical information to be reported in the journal. The patients understand that their names and initials will not be published and due efforts will be made to conceal their identity, but anonymity cannot be guaranteed.
Financial support and sponsorship
Departmental Funds from Nephrology and Laboratory Medicine.
Conflicts of interest
There are no conflicts of interest.
Acknowledgements
Our sincere thanks to Dr. P. Vikranth Reddy and Dr C Narasimhan for guiding us throughout the course of the study.
References
- Dyslipidemia of chronic renal failure: The nature, mechanisms, and potential consequences. Am J Physiol Renal Physiol. 2006;290:F262-72.
- [Google Scholar]
- Association between cholesterol level and mortality in dialysis patients: Role of inflammation and malnutrition. JAMA. 2004;291:451-9.
- [Google Scholar]
- Down-regulation of hepatic lecithin: Cholesterol acyltransferase gene expression in chronic renal failure. Kidney Int. 2001;59:2192-6.
- [Google Scholar]
- Role of secondary hyperparathyroidism in the genesis of hypertriglyceridemia and VLDL receptor deficiency in chronic renal failure. Kidney Int. 1998;53:626-30.
- [Google Scholar]
- Intensive lipid lowering with atorvastatin in patients with coronary heart disease and chronic kidney disease: The TNT (Treating to New Targets) study. J Am Coll Cardiol. 2008;51:1448-54.
- [Google Scholar]
- Focused atorvastatin therapy in managed-care patients with coronary heart disease and CKD. Am J Kidney Dis. 2009;53:741-50.
- [Google Scholar]
- Lipoprotein metabolism and lipid management in chronic kidney disease. J Am Soc Nephrol. 2007;18:1246-61.
- [Google Scholar]
- Clinical assessment and management of dyslipidemia in patients with chronic kidney disease. Clin Exp Nephrol. 2012;16:522-9.
- [Google Scholar]
- Role of dyslipidemia in impairment of energy metabolism, oxidative stress, inflammation and cardiovascular disease in chronic kidney disease. Clin Exp Nephrol. 2014;18:265-68.
- [Google Scholar]
- Atorvastatin in patients with type 2 diabetes mellitus undergoing haemodialysis. N Engl J Med. 2005;353:238-48.
- [Google Scholar]
- Disorders of lipid metabolism in chronic kidney disease? Blood Purif. 2018;46:144-52. doi: 10.1159/000488816
- [Google Scholar]
- American Heart Association (AHA) guidelines on lipid management 2018


