

Translate this page into:
Whole slide imaging vs eyeballing: The future in quantification of tubular atrophy in routine clinical practice
-
Received: ,
Accepted: ,
This article was originally published by Wolters Kluwer - Medknow and was migrated to Scientific Scholar after the change of Publisher.
Abstract
Introduction:
Histologic assessment of interstitial fibrosis and tubular atrophy is an accepted method of assessing chronic damage to the kidney and correlates with renal function in native and allograft renal biopsies. The challenge, however, is to quantify the interstitial fibrosis and tubular atrophy with accuracy and to minimize the inter-observer variability. Though “eyeballing” on light microscopy is the most commonly practised method used for the quantification of tubular atrophy, it may not be very accurate. To complement this method, Whole Slide Imaging (WSI) techniques that have more accurate results and have a higher reproducibility can be used. There is not much data on the correlation of the results obtained by the ‘eyeballing’ technique with those by digital WSI.
Methods:
Tubular atrophy in 151 consecutive adequate native kidney biopsies were graded 0 to III by ‘conventional’ eyeballing by a single experienced renal pathologist. These results were compared with the grades obtained on the same cases by WSI and digital marking of the atrophy.
Results:
The concordance of the two groups in the entire cohort was only 66.2% with over grading in 30.4% and under grading in 3.3%. Whilst accuracy of grading was over 74% in all grades, the sensitivity in grades I and II were low at 52% and 47.3% respectively as was the positive predictive value at 32.5 and 44% respectively.
Conclusion:
Assessment of tubular atrophy on digital images will be the way forward for accurate quantification.
Keywords
Eyeballing
tubular atrophy
whole slide imaging

Introduction
Kidney biopsies are a part of routine clinical practice in most centres, being used to confirm diagnosis, to help in management and for prognosis. Assessment of chronic changes, namely global glomerular sclerosis, interstitial fibrosis (IF), tubular atrophy (TA) and arteriosclerosis as stated in the biopsy report is used as a valuable prognostic index by the clinician. The Renal Pathology Society has advocated the use of the chronicity index for many glomerular pathologies.[1] However, despite its immense importance, histopathological analysis has its own shortcomings with a lack of reproducibility and a high inter-observer variability while attempting to determine the extent of chronic lesions by light microscopy.[23456] Accuracy while doing the above is important, as it has a bearing on the management of the patient and the ultimate outcome.
In routine practice, IF and TA are assessed by ‘eyeballing’. Here, the microscopist arrives at a rough estimate of the percentage of atrophic tubules in the cortical area by scanning serial sections of the biopsy slides stained with haematoxylin and eosin (H&E), periodic acid schiff (PAS), Jones silver methenamine and the Masson trichrome stain. This is therefore a subjective assessment. With the advent of whole slide imaging (WSI) by digital scanners, it is possible to accurately quantify these atrophic tubules by digital annotation of slides and this is an objective measure unlike the subjective ‘eyeballing’. This study was undertaken to compare the quantification of TA as assessed by ‘eyeballing’ with that obtained by accurate digital measurements, which was considered the gold standard. IF and TA go hand-in-hand. However, as atrophic tubules are clearly delineated on the PAS stain, this measure was chosen for comparison.
Methods
This study was done in 2 phases:
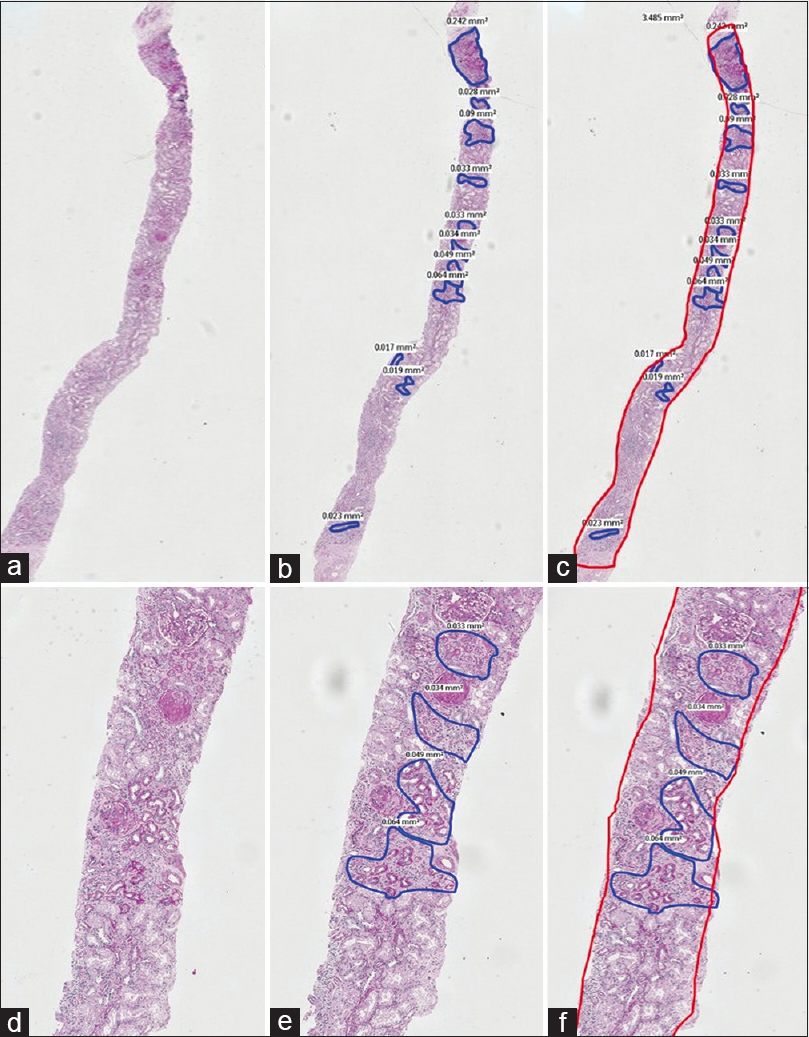
1st phase: PAS stained sections of 151 consecutive archival native renal biopsies, with at least 10 glomeruli, irrespective of the final diagnosis, reported by a single Pathologist, with over 25 years of experience in renal biopsy reporting, were scanned (Whole Slide imaging) using the Philips IntelliScan system. The images of these scanned sections were viewed on a larger screen and one optimal PAS stained section was chosen. The zones of TA in the cortex, seen on the screen were outlined manually [Figures 1 and 2] and the area occupied by each zone read in mm2, using the Philips Software. Addition of all these individual areas in each slide gave us the total area occupied by TA in each slide. Following this, the total area occupied by the renal cortices in the same tissue sections was determined in a similar way, using the Philips software. The medullary areas were excluded. The total area of the digitally mapped TA, was then expressed as a percentage of the total digitally mapped cortical area of the same section. The percentages were categorised as grade 0 (<10%), grade I (10 to 25%), grade II (26 to 50%) and grade III (>50%). This value was taken as the gold standard.

- A composite PAS stained image with A, B and C in low power (2X) and D, E and F in a higher power (10X) captured by WSI. The areas of tubular atrophy are annotated in blue in images B and E and the read out of the exact areas are seen alongside. In images C and F, the entire area of the cortex is outlined in red alongside the areas of atrophy in blue. This case was estimated as 40 to 50% tubular atrophy by ‘eyeballing’ and the actual digital measurement was 25.35%
- A composite picture of PAS stained sections at low (2X) and high (10X) magnification annotated similar to Figure 1. Here, the atrophy on ‘eyeballing’ was estimated at 30% whilst that by digital measurement was only 18.13%
In phase 2, the renal biopsy reports of the same 151 cases were retrieved from the archives and the percentage TA recorded in each were noted and graded similar to the system above. The grades obtained by eyeballing in phase 2 were compared with the grades obtained by WSI, in Phase 1. in a tabulated form
Statistics analysis: The data was compiled and analyzed using MS Excel (R) office 365, GraphPad prism 8.4.2 and SPSS version 23. Descriptive statistics was presented in the form of proportions/percentages for categorical variables (grade-wise classification) and median/Interquartile range along with mean & standard deviation for continuous data (Absolute TA percentage). Chi Square test (along with degree of freedom) was used for the comparison of proportions (Categorical variables). Continuous variables were analyzed using the paired T test (for paired data related to TA percentage values). For assessing inter-group agreement (continuous data parameters), a linear correlation between the percentage values assessed by two methods was performed and Pearson's correlation coefficient calculated. Cronbach alpha value for internal consistency and Intraclass coefficient (ICC) for reliability between the two groups was calculated. For assessing inter-group agreement (categorical data parameters), a contingency analysis was performed and concordance, accuracy, specificity, sensitivity, positive predictive value (PPV) and negative predictive value (NPV) were calculated overall for the study and individually for each grade. The analysis was done for grade wise observation based on eyeballing compared to the digital assessment. Concordance was calculated based on the number of true positive pairs divided by overall sample size/sample size in that group. Accuracy was calculated for individual grade based by using the formula = (True positives + True negatives)/Total sample size*100.
Results
Table 1 gives the distribution of cases in the four grades by the two methodologies. Table 2 gives the summary of the correct grade and the percentage of under and over grading, overall and in the four grades taking the digital grading as the gold standard. The overall concordance was only 66.22% with over grading in 30.46% and under grading in 3.31%. Table 3 gives the accuracy, sensitivity, specificity, positive and negative predictive values for each of the grades of the ‘eyeballing’ method, using digital method as the reference standard. Whilst the values seem acceptable in grades 0 and III, the sensitivity in grades I and II are low with a low positive predictive value, indicating that ‘eyeballing’ tends to over-assess atrophy in these grades.
| Overall | IFTA Grade - Digital | Grand Total | |||
|---|---|---|---|---|---|
| Grade 0 | Grade 1 | Grade 2 | Grade 3 | ||
| IFTA grade - eyeballing | |||||
| Grade 0 | 71 | 1 | 0 | 0 | 72 |
| Grade 1 | 23 | 13 | 4 | 0 | 40 |
| Grade 2 | 3 | 11 | 11 | 0 | 25 |
| Grade 3 | 1 | 0 | 8 | 5 | 14 |
| Grand Total | 98 | 25 | 23 | 5 | 151 |
| Overall | Grade 0 | Grade 1 | Grade 2 | Grade 3 | |
|---|---|---|---|---|---|
| Concordant grade | 66.22 | 72.44 | 52 | 47.82 | 100 |
| Over graded | 30.46 | 27.56 | 44 | 34.78 | 0 |
| Under graded | 3.31 | 0 | 4 | 17.39 | 0 |
| Grade 0 | Grade 1 | Grade 2 | Grade 3 | |
|---|---|---|---|---|
| Accuracy | 81.40% | 74.17% | 82.78% | 94.03% |
| Sensitivity | 72.45% | 52% | 47.83% | 100% |
| Specificity | 98.11% | 78.57% | 89.06% | 93.84% |
| PPV* | 98.61% | 32.50% | 44% | 95.71% |
| NPV** | 65.82% | 89.19% | 90.48% | 100% |
*Positive predictive value, **Negative predictive value
Discussion
Considering the prognostic importance of IFTA in the management of patients with chronic kidney disease, it is important that this assessment on biopsy be accurate and reproducible. Grading of IFTA finds a place in the chronicity index of lupus nephritis,[7] MEST score of IgA nephropathy,[8] RPS classification of diabetic nephropathy[9] and in the Banff scores in allograft nephropathy[10] and they assume that this grading is reliable, when in fact it may be subject to interpretive errors and inter-observer variations. This biopsy data is being integrated into big data-driven tools such as the risk score for IgA nephropathy,[11] and the iBox score for transplant kidney survival using Banff scores (http: www.paristransplantgroup.org) and this assumes that there is a reproducibility of the scores when in actual practice it may not be so.
Farris and Alpers[12] in their review of IF argue that this uncertainty of measurement could arise from different conceptual ways of considering the percentage of fibrosis (some pathologists consider IF percentage as the percent of overall tissue occupied by fibrous matrix, whereas others consider the area containing both fibrotic matrix and intact glomeruli and tubular structures), the threshold of matrix needed in order to identify a region as being involved by fibrosis, the stains used and the subjective estimation. Similarly, TA could take the form of small tubules with thickened basement membranes and a widened interstitium, best appreciated on the PAS stain, the endocrine type of atrophy seen as small crowded clusters of simplified cells without marked basement membrane thickening or interstitial widening and as thyroidisation seen as small tubules with a flattened lining and PAS positive hyaline casts within. The first and the third types of atrophy are the more prevalent and they stand out in a PAS stained section and this may be the reason for an overcall of the grade in ‘eyeballing’.
The assessment of TA is also confounded by the fact that the atrophic tubules may occupy one large continuous area, may be discontinuous with zones of non-atrophic tubules between or not too uncommonly, may be few or many atrophic tubules dispersed inconspicuously among normal tubules. While the human eye can roughly quantitate the first two patterns, the third one may be difficult. The Pathologist views the slides, field by field, under low magnification, making a mental calculation of the proportion of atrophic tubules in each field and then summing them up to a final score. It is also not clear whether the microscopist is always able to subtract the area occupied by glomeruli in the assessment and this is easily done digitally. This, as can be well imagined, cannot be very accurate even in experienced hands, and the figure mentioned in the final report can at best be only a rough estimate.
Studies on inter-observer variability of TA in lupus nephritis have yielded kappa values of the correlation coefficient from as low as 0.08 to a modest degree of correlation at 0.51.[345] In IgA nephropathy, the values were 0.78 amongst experts and 0.53 amongst generalists, highlighting the difficulty non-experts feel in quantitation.[2] In transplant biopsies, in the study by Professor Furness of 14 small groups across the UK and Europe, the value was a mere 0.314 and there was no significant improvement in this figure after numeric or graphical feedback.[6] There have been no studies however comparing the assessment of TA by ‘eyeballing’ with the gold standard, namely the actual measurement of the area, as in this study.
WSI scanners scan the whole slide and digital images of the section can be seen on the monitor and they have considerable advantages over conventional microscopy.[13] The images can be zoomed in and out with great ease. When areas of TA are actually outlined with the tools available in the system, all three types of atrophy as well as all areas of atrophy, small or large, are recognised and importantly the non-atrophic tubules and glomeruli are excluded. This could be one of the reasons for the grade being lower on the WSI compared to ‘eyeballing’.
Our study shows that at the extreme ends of atrophy, grade 0 (<10%) and grade III (>50%), the human eye matches the digital measurement with concordance of 72.44 and 100% respectively. The number of cases in grade III in this study was only 5, and larger studies will throw light on the accuracy of assessment in this grade. It is also worth noting that in all grades, there was a tendency to over-assess the grade by ‘eyeballing’, rather than under-assess. It is possible that management decisions and prognosis could have changed in some of them had the tubular atrophy score been more accurate.
WSI systems are expensive and may not be available at all centres of reporting, especially in countries like India. However, these systems are being used to develop algorithms for accurate diagnosis using convolutional neural networks (CNN) and deep machine learning in all areas of Pathology including Renal Pathology.[14] There has been recent development of applications in Nephropathology of quantitating open and sclerosed glomeruli in rodent and human kidneys,[1516] classification of diabetic nephropathy[17] and in segmentation of glomeruli and glomerular cell types in mouse and human kidneys.[18] In the study by Hermsen et al., assessment of fibrosis in native kidney biopsies is better with CNN.[19] It is possible therefore to develop tools of artificial intelligence which could be used to accurately quantify tubular atrophy, which is an important parameter in renal biopsies. For a start, without employing sophisticated artificial intelligence tools, an application could be developed of an instant readout of the atrophic area on a digital image where the pathologist has outlined the areas of atrophy. Thus, the cumbersome and often inaccurate subjective method which is currently being employed can be dispensed with.
Conclusions: Tubular atrophy by ‘eyeballing’ seems to over assess atrophy when compared to accurate quantification by using WSI and digital tools. Whilst the results are comparable in grades 0 and III, there is a significant discrepancy in grades II and III, which are the common grades of atrophy reported in routine clinical practice. With the advent of digital microscopy, machine learning and artificial intelligence, it is possible to develop a tool that Pathologists can use effectively to accurately quantify this important parameter.
Financial support and sponsorship
Nil.
Conflicts of interest
There are no conflicts of interest.
Acknowledgements
Dr Vikramjit Singh, Faststat Clinical Data Solutions, for the statistical analysis.
References
- A proposal for standardized grading of chronic changes in native kidney biopsy specimens. Kidney Int. 2017;91:787-9.
- [Google Scholar]
- Reproducibility of the Oxford classification of immunoglobulin A nephropathy, impact of biopsy scoring on treatment allocation and clinical relevance of disagreements: Evidence from the VALidation of IGA study cohort. Nephrol Dial Transplant. 2019;34:1681-90.
- [Google Scholar]
- Reliability of histologic scoring for lupus nephritis: A community-based evaluation. Ann Intern Med. 1993;119:805-11.
- [Google Scholar]
- Inter-observer variability of the histological classification of lupus glomerulonephritis in children. Lupus. 2017;26:1205-11.
- [Google Scholar]
- Interobserver agreement of scoring of histopathological characteristics and classification of lupus nephritis. Nephrol Dial Transplant. 2008;23:223-30.
- [Google Scholar]
- International variation in histologic grading is large, and persistent feedback does not improve reproducibility. Am J Surg Pathol. 2003;27:805-10.
- [Google Scholar]
- Prognostic factors in lupus nephritis.Contribution of renal histologic data. Am J Med. 1983;75:382-91.
- [Google Scholar]
- The Oxford classification of IgA nephropathy: Rationale, clinicopathological correlations, and classification. Kidney Int. 2009;76:534-45.
- [Google Scholar]
- Pathologic classification of diabetic nephropathy. J Am Soc Nephrol. 2010;21:556-63.
- [Google Scholar]
- Fibrosis and atrophy in the renal allograft: Interim report and new directions. Am J Transplant. 2002;2:203-6.
- [Google Scholar]
- Evaluating a new international risk-prediction tool in IgA nephropathy JAMA Intern Med. . 2019;179:942-52.
- [Google Scholar]
- What is the best way to measure renal fibrosis? A pathologist's perspective. Kidney Int Suppl. 2014;4:9-15.
- [Google Scholar]
- Clinical applications of whole-slide imaging in anatomic pathology. Adv Anat Pathol. 2017;24:215-21.
- [Google Scholar]
- Artificial intelligence and machine learning in nephropathology. Kidney Int. 2020;98:65-75.
- [Google Scholar]
- Region-based convolutional neural nets for localization of glomeruli in trichrome-stained whole kidney sections. J Am Soc Nephrol. 2018;29:2081-8.
- [Google Scholar]
- Deep learning global glomerulosclerosis in transplant kidney frozen sections. IEEE Trans Med Imaging. 2018;37:2718-28.
- [Google Scholar]
- Computational segmentation and classification of diabetic glomerulosclerosis. J Am Soc Nephrol. 2019;30:1953-67.
- [Google Scholar]
- An integrated iterative annotation technique for easing neural network training in medical image analysis. Nat Mach Intell. 2019;1:112-9.
- [Google Scholar]
- Deep learning-based histopathologic assessment of kidney tissue. J Am Soc Nephrol. 2019;30:1968-79.
- [Google Scholar]


