

Translate this page into:
Efficacy and Outcomes of CYP3A5 Genotype-Based Tacrolimus Dosing Compared to Conventional Body Weight-based Dosing in Living Donor Kidney Transplant Recipients
-
Received: ,
Accepted: ,
This is an open access journal, and articles are distributed under the terms of the Creative Commons Attribution-NonCommercial-ShareAlike 4.0 License, which allows others to remix, tweak, and build upon the work non-commercially, as long as appropriate credit is given and the new creations are licensed under the identical terms.
This article was originally published by Wolters Kluwer - Medknow and was migrated to Scientific Scholar after the change of Publisher.
Abstract
Introduction:
Clinical use of tacrolimus has been challenging due to its narrow therapeutic index and highly variable pharmacokinetics. In this study, we compared patients who received body weight-based tacrolimus dosing pre-transplant (transplanted from 2016 to 2018) with those who received CYP3A5 genotype-based dosing (2018 to 2020).
Methods:
Eighty-two renal transplant recipients were non-randomly assigned to genotype-adapted or bodyweight-based tacrolimus dosing groups. The primary end point was to study the proportion of subjects who achieved the target tacrolimus C0 on post-op day 4. Secondary end points included clinical outcomes and safety.
Results:
The proportion of subjects who achieved the target tacrolimus C0 on postoperative days 4 and 10 were significantly higher in the adapted group, 53.6% and 47.5%, compared to 24.3% and 17% in controls, respectively (P = 0.01). Adapted group subjects achieved their first target tacrolimus C0 significantly earlier (4 days) compared to 25 days in controls (P = 0.01). The total number of tacrolimus dose modifications required in the first postop month were lower in the adapted group; 47 compared to 68 in the controls (P = 0.05). The proportion of subjects with sub-therapeutic tacrolimus exposure on postoperative day 4 was significantly higher in the controls, 56% versus 10% in the adapted group (P < 0.001). There were no significant differences between the groups in the rate of biopsy proven acute rejections, adverse events, and graft function at the end of 3 months follow up.
Conclusion:
Genotype-based tacrolimus dosing leads to more subjects achieving the target tacrolimus C0 earlier. However, there may be a higher risk of tacrolimus nephrotoxicity.
Keywords
CYP3A5 genetic polymorphisms
pharmacokinetics
renal transplant
tacrolimus

Introduction
Tacrolimus is the cornerstone of immunosuppressive therapy for preventing rejection after kidney transplantation.[1] However, its clinical use has been challenging due to its narrow therapeutic range and highly variable pharmacokinetics.[2] It is crucial to achieve early and stable therapeutic trough concentration C0, to avoid toxicity and graft rejection. Sub-therapeutic concentration in the early post-transplant period increases the risk of rejection, while concentration above the target range causes nephrotoxicity.[3]
The KDIGO Transplant Work Group states that dosing of tacrolimus is an important, yet relatively under-investigated domain.[4] Though retrospective studies have revealed that whole-blood tacrolimus C0 and tacrolimus dose requirements correlate with CYP3A5 polymorphisms,[5] patients on the transplantation wait-list do not undergo genotyping routinely. They still receive body weight-based dose, and target concentrations are achieved by “trial and error” approach. Hence, the role of tacrolimus dose adaptation based on pre-transplantation genotyping in patient management needs to be addressed.
Since this prospective approach has been tested infrequently, we conducted this study to evaluate whether adaptation of tacrolimus dosing pre-transplant according to CYP3A5 genotype would allow optimization of tacrolimus C0 post-transplant and improve clinical outcome.
Patients and Methods
Study design
This is a single-centered study done in South Indian population. It was designed to compare the pharmacokinetic characteristics of tacrolimus in patients receiving doses adapted according to their genotype with those receiving conventional body weight-based dose. The study was approved by institutional ethics committee and was carried out in compliance with the provisions of the Declaration of Helsinki and the Good Clinical Practice guidelines.
The adapted group comprised of subjects who underwent living donor renal transplantation from November 2018 to February 2020. They were assigned to receive tacrolimus dose as determined by their pre-transplant genotype status. Subjects were categorized as: Extensive metabolizers – CYP3A5*1/*1 alleles (rs6986 AA), intermediate metabolizers – CYP3A5 *1/*3 alleles (rs6986 AG), and poor metabolizers – CYP3A5 *3/*3 alleles (rs6986 GG). They received tacrolimus doses of 0.2, 0.15, and 0.1 mg/kg/day, respectively. The subjects were followed up for 3 months [Figure 1].

- Adapted group
The historical control group included subjects who had undergone living donor renal transplantation from January 2016 to October 2018. They had received the conventional bodyweight-based tacrolimus dose of 0.1 mg/kg/day. Both the cohorts received the same generic version of tacrolimus. Patients on tacrolimus-based immunosuppressive regimen who had completed at least 3 months of post-transplant period were considered for enrollment. Subjects in this group underwent tacrolimus genotype testing using fresh blood samples which were collected during their follow-up visit to our outpatient department between November 2018 and March 2019. A total of 113 transplants were done from January 2016 to October 2018; out of which 65 subjects underwent genotyping after applying exclusion criteria, and among them 41 were included in the study after matching [Figure 2].
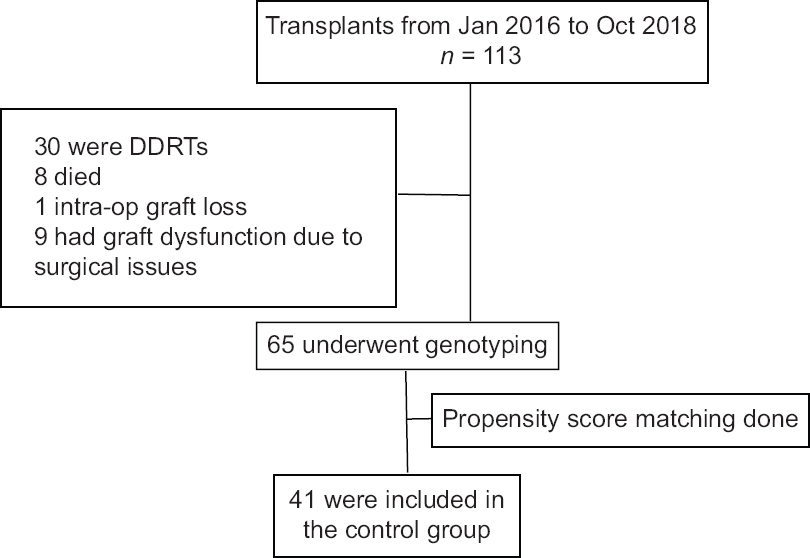
- Control group
Inclusion and exclusion criteria
Subjects aged ≥15 years and <60 years who have undergone living donor kidney transplantation were included. Subjects who had received drugs known to interact with tacrolimus at the time of transplantation, deceased donor transplant recipients, ABO incompatible transplant recipients, retransplant patients, subjects with poor drug compliance, subjects who required switch from tacrolimus regimen, and had graft dysfunction due to surgical complications were excluded from the study.
Interventions
The control subjects were included after matching with those in adapted group using propensity scores in descending order, by the nearest neighbor matching technique. Covariates like age, gender, BMI, and metabolizer status were used to calculate the propensity scores. Matching was done using a caliper width of 0.106, which was the standard deviation of the propensity scores obtained. Quality of matching was assured by assessing the distribution of covariates using two sample “t”’ tests. The first steady-state trough concentration of tacrolimus (C0) in whole blood was measured on postoperative day (POD) 4, after the intake of 10 oral doses, following which physicians could modify the daily dose in order to achieve a prespecified target range of C0. The subsequent tacrolimus levels were measured on POD 10, 30, 60, and 90. Additional tacrolimus levels were done between these days based on the discretion of the treating nephrologist and a maximum dose increment of 2 mg/day was allowed at a time. The prespecified tacrolimus target ranges were 8.0–13.0 ng/mL in the first week, 7.0–10.0 ng/mL from the second to fourth week, and 5.0–8.0 ng/mL thereafter until 6 months post-transplant period.
The tacrolimus dose was rounded off to the nearest 0.5 mg to enable twice daily oral dosing of an equal dose. The first dose of tacrolimus was administered at 07:00 h in the morning, on the day prior to the transplant. Immunosuppressive therapy comprised of Basiliximab induction as 20-mg dose administered intravenously on day 0 (intraop) and day 4 after transplantation for recipients with spousal donor. For recipients with related donors, no induction therapy was given. Mycophenolate mofetil was started concurrently with tacrolimus at a dose of 600 mg/m2/day.
Glucocorticoid therapy included oral prednisolone 0.5 mg/kg/day in two divided doses, started 24 h prior to the surgery. Intravenous methylprednisolone of 15 mg/kg was administered intra-op, followed by i.v hydrocortisone 100 mg T.D.S. on POD 0. Oral prednisolone 0.5 mg/kg/day in two divided doses was resumed from POD 1. It was tapered gradually to 10 mg/day at the end of 3 months following transplantation.
Allograft biopsies were reviewed by nephropathologist. Allograft rejections were graded according to the 2018 BANFF classification of renal allograft rejection. CNI nephrotoxicity was defined as the presence of acute tubular injury with isometric vacuolization of the tubular epithelial cells or myocyte necrosis of the arterioles or thrombotic micro-angiopathy in the allograft biopsy along with clinical features of CNI toxicity and the presence of tacrolimus C0 either in the target range or supra-therapeutic range.
DNA extraction and genotyping
Peripheral blood samples for genotypic analysis were obtained from all subjects (2 mL of blood added with ethylenediamine tetraacetic acid preservative) and transported at 4°C temperature for genotyping. Genotyping for CYP3A5 polymorphisms was performed by the allele-specific polymerase chain reaction in combination with melting point analysis (ASPCR-MPA). All whole blood tacrolimus trough concentrations were measured by chemi-luminescence immunoassay (CLIA) from a single laboratory.
End points
The primary end point was the proportion of subjects within the desired tacrolimus whole blood C0 range (8–13 ng/mL) at the first steady state, i.e. on the morning of POD 4. Secondary pharmacokinetic end points included proportion of subjects who were within the target tacrolimus C0 on days 10, 30, 60, and 90, the time required to reach the first therapeutic C0 range, the number of tacrolimus dose modifications required in each group, subjects with sub-therapeutic (defined as C0 < 5.0 ng/mL) and supra-therapeutic (defined as C0 > 15.0 ng/mL) exposures, and interpatient variability of tacrolimus concentrations. Secondary clinical end points included the incidence of slow and delayed graft function, the incidence of BPARs, graft function at the end of the third month follow up, tacrolimus toxicity, and other adverse events.
Statistical analysis
This was a pilot study. The data was analyzed using R Software Version 3.6.1. All categorical parameters were represented as frequency and percentages; continuous observations were summarized as mean (SD) or median (IQR) based on the distribution. Associations of all categorical clinical parameters between groups were assessed using Chi-Square test, and the difference between the average measures for continuous observations between the groups was done using Independent Sample t-test or Mann–Whitney U test based on the normal distribution assumption. For all comparison, P value was considered significant at 5% level of significance.
Results
Patients
Forty-one patients from adapted group were matched to 41 from the control group. There were no significant differences between the groups with respect to demographic, clinical, and donor–recipient characteristics [Table 1]. With respect to the frequency of various alleles, the observed genotype distributions did not deviate from Hardy–Weinberg equilibrium. The distribution of CYP3A5 alleles did not differ between the adapted group and the control group [Table 2].
| Control group (n=41) | Adapted group (n=41) | |
|---|---|---|
| Age of recipient (years) | 28.7 (25-34.7) | 30.9 (24-38) |
| Male recipient (n, %) | 35 (85.3%) | 34 (83%) |
| Body mass index (kg/m2) | 18.5 (17.5-20.1) | 17.7 (16.8-20) |
| Native Kidney disease | ||
| Chronic glomerulonephritis (n, %) | 10 (24) | 9 (22) |
| Chronic interstitial nephritis (n, %) | 5 (12) | 7 (17) |
| Not known (n, %) | 26 (63) | 25 (61) |
| Recipient Blood Group | ||
| A (n, %) | 9 (22) | 11 (27) |
| B (n, %) | 20 (48) | 17 (41.4) |
| O (n, %) | 11 (27) | 12 (29) |
| AB (n) | 1 | 1 |
| Donor | ||
| Unrelated (n, %) | 6 (14) | 7 (17) |
| Male donors (n, %) | 11 (27) | 9 (21) |
| Donor GFR (mL/min) | 43 (42-47) | 42 (38.2-45) |
| Dialysis vintage (months) | 5 (4-8.7) | 6 (6-8) |
| Induction therapy (n, %) | 6 (14) | 7 (17) |
| Warm ischemia time (minutes) | 1.5 (1-1.9) | 1.6 (1.05-2) |
| Cold ischemia time (minutes) | 49.5 (47-53.7) | 50 (47-53.4) |
Continuous variables are shown as median values (1st-3rd quartiles)
| Genotype | Total | Control group | Adapted group |
|---|---|---|---|
| CYP3A5*1/*1 | 16 | 8 | 8 |
| CYP3A5*1/*3 | 28 | 14 | 14 |
| CYP3A5*3/*3 | 38 | 19 | 19 |
Efficacy end points
Pharmacokinetic data
At the first steady state (POD 4), 53.6% subjects in the adapted group were within the target tacrolimus C0 range compared to 24.3% in the control group (P = 0.01). The median tacrolimus C0 was 8.6 ng/mL in the adapted group versus 5.1 ng/mL in the controls (P < 0.001). The median tacrolimus C0 was within the target range for CYP3A5*1/*1 and CY3A5*3/*3 subjects of the adapted group; CYP3A5*1/*3 subjects showed an intermediate result [Table 3]. In controls, the median tacrolimus C0 was within the target range only in CY3A5*3/*3 subjects. [Figure 3]
| End point | Control group (n=41) | Adapted group (n=41) | P |
|---|---|---|---|
| Primary end point | |||
| Proportion of patients with tacrolimus C0 in target range after 10 oral doses (%) | 24.3 | 53.6 | 0.01 |
| Tacrolimus C0 on day 4 (ng/mL) | 5.1 (2.6-7.9) | 8.6 (6.2-9.8) | <0.001 |
| CYP3A5*1/*1 | 2.8 (2.6-3.2) | 8.3 (6.2-12) | 0.007 |
| CYP3A5*1/*3 | 3.3 (2.4-4.5) | 6.9 (5.4-8.4) | <0.001 |
| CYP3A5*3/*3 | 9.1 (7.4-9.5) | 10.7 (8.8-11.7) | 0.12 |
Continuous variables are shown as median values (1st-3rd quartiles)
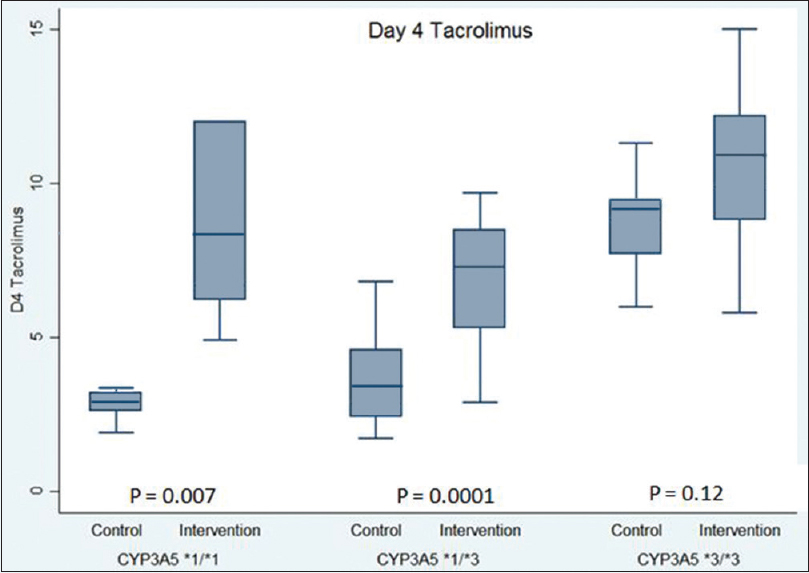
- Tacrolimus trough levels on post op day 4 categorized by CYP3A5 genotypes
On POD 4, 56% of control subjects had sub-therapeutic exposure for tacrolimus compared to only 10% in the adapted group (P < 0.001). Subjects in the adapted group achieved their first target tacrolimus C0 significantly earlier (4 days) compared to 25 days in controls (P = 0.01) [Figure 4]. The total number of tacrolimus dose modifications required in the first month were 47 in the adapted group versus 68 in the controls (P = 0.05).

- Time taken for the subjects to achieve their first tacrolimus target therapeutic concentration
Concentration dose (C/D) ratio indicates the ability of an individual to metabolize a drug at a given dose, expressed as ng/mL/mg/day, i.e. blood level of tacrolimus that would be achieved for each milligram dose of the drug. Higher the value, lower the ability to metabolize tacrolimus. The non-expressor population (CY3A5*3/*3) of controls had significantly higher C/D ratios compared to expressors (CYP *1/*1 and CY3A5*1/*3) on POD 4 (P = 0.002) and 10 (P = 0.001) revealing the effect of CYP3A5 polymorphisms on inter-individual variability of tacrolimus metabolism. [Figure 5]
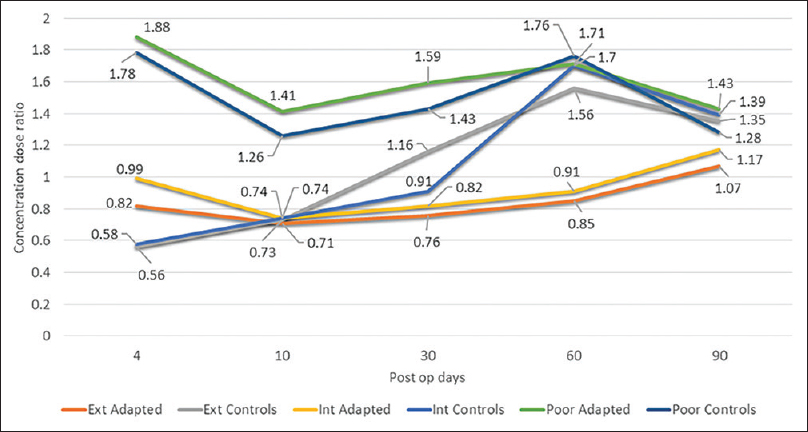
- Concentration dose ratios of control and adapted dose groups
The effect of genotyping on tacrolimus C0 was higher in the early post-transplant period. This was evident by the significant differences between the two groups in the proportion of subjects who were within the target tacrolimus range on POD 4 and 10. TDM gradually nullified the effect of genotyping, evidenced by the similar proportion of subjects within the target ranges in both groups, from POD 30. [Figure 6]
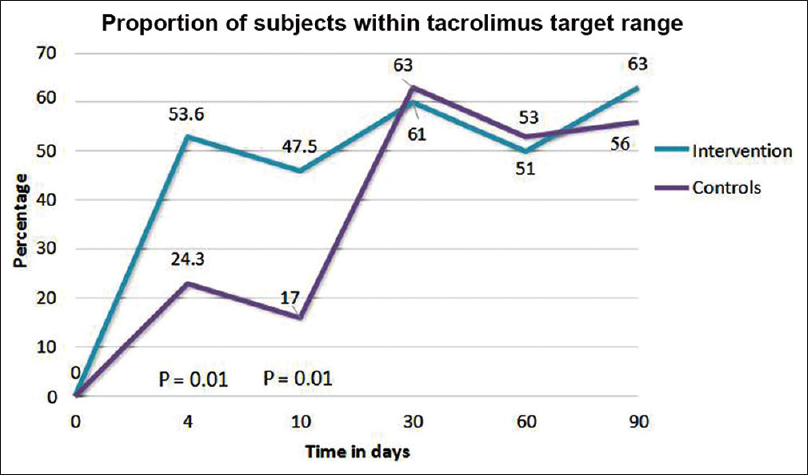
- Effect of genotyping in the early post-transplant weeks, being nullified by therapeutic drug monitoring from postoperative day 30
Univariate and multivariate regression analyses were done to assess the role of baseline clinical parameters on tacrolimus C0 and allograft function; metabolizer status was the only variable which determined the tacrolimus C0 levels on POD 4 and 10. Recipient's age, donor kidney GFR, occurrences of acute cell-mediated rejection, and graft pyelonephritis were the factors that determined the eGFR at the end of 3 month follow up.
Graft survival and acute rejection
Graft survival at the end of the third month was similar (100%) in both groups. The incidence of slow graft function and delayed graft function was similar in both groups. The incidence of BPAR was 17% (n = 7) in the adapted group and 29% (n = 12) in the control group (P = 0.19). Estimated glomerular filtration rate at 3 months follow up was 73.8 ml/min/1.73 m2 in control subjects compared to 71.2 mL/min/1.73 m2 in the adapted group (P = 0.49).
Safety
In total, 24 adverse events were observed in the adapted group and 16 in the controls (P = 0.69). The commonly reported adverse events were tacrolimus-related neurotoxicity, nephrotoxicity, gastrointestinal disorders, and infections. The incidence of tacrolimus nephrotoxicity was higher in the adapted group; 27% versus 14.6% in controls (P = 0.27). None of the expressors in the control group (0/22) had tacrolimus nephrotoxicity compared to 32% (7/22) in the adapted group (P = 0.01). This could be attributed to the increased tacrolimus exposure in expressors of the adapted group because of genotype-based dosing [Table 4]. There was no significant difference between the groups in the incidence of PTDM, hyperkalemia, and antihypertensive requirement.
| Secondary end points | Control group (n=41) | Adapted group (n=41) | P |
|---|---|---|---|
| Proportion of patients with tacro C0 in target range on day 10 (%) | 17 | 47.5 | 0.01 |
| Tacro C0 at day 10 (ng/mL) | 5.9 (4.2-6.3) | 6.8 (4.9-7.6) | 0.08 |
| CYP3A5*1/*1 | 4.5 (3.5-5.9) | 6.9 (5.2-7.9) | 0.17 |
| CYP3A5*1/*3 | 4.8 (3.3-5.8) | 5.8 (4.2-7.4) | 0.11 |
| CYP3A5*3/*3 | 6.9 (5.5-8.4) | 7 (5.6-8.6) | 0.86 |
| Sub-therapeutic exposure (n, %) | 23 (56) | 4 (10) | <0.001 |
| Time to achieve target tacro C0 (days) | 25 (13-35) | 4 (4-24) | 0.01 |
| Number of tacrolimus levels measured per patient | 7.4 | 6.2 | |
| Number of tacrolimus dose modifications per group in the first post-op month (n) | 68 | 47 | 0.05 |
| Number of tacrolimus dose modifications per group at the end of three months (n) | 132 | 96 | 0.03 |
| CYP3A5*1/*1 | 31 | 19 | |
| CYP3A5*1/*3 | 59 | 39 | |
| CYP3A5*3/*3 | 42 | 38 | |
| Slow graft function (n, %) | 6 (14.6) | 5 (12) | |
| CNI nephrotoxicity (n) | 6 (14.6) | 11 (27) | 0.27 |
| Subgroup | |||
| CYP3A5*1/*1 & CYP3A5*1/*3 combined | 0 | 7 | 0.01 |
| CYP3A5*3/*3 | 6 | 4 | |
| Acute T cell mediated rejections (n, %) | 12 (29) | 7 (17) | 0.19 |
| Borderline ACR | 2 | 1 | |
| ACR BANFF IA | 7 | 5 | |
| ACR BANFF IB | 2 | 1 | |
| ACR BANFF II A | 1 | 0 | |
| ABMR (n) | 2 | 1 | |
| Delayed graft function (n) | 2 | 2 | |
| Serum creatinine at day 90 | 1.2 (1.1-1.3) | 1.3 (1.2-1.4) | 0.31 |
| eGFR at day 90 (mL/min/1.73 m2) | 73.8 (67.1-82.4) | 71.2 (60.6-80.9) | 0.49 |
Continuous variables are shown as median values (1st-3rd quartiles); Tacro, tacrolimus; CNI, Calcineurin inhibitor; ACR, Acute cell-mediated rejection; ABMR, Antibody-mediated Rejection; eGFR, estimated glomerular filtration r
Discussion
The first living donor transplant in our institute was performed in 1985. Till date, we have performed 864 transplants (including living and deceased donor). In this trial, adaptation of the initial dose of tacrolimus based on the CYP3A5 genotype prior to renal transplantation allowed significantly better prediction of tacrolimus C0 compared to the conventional weight-based dosing. The greatest difference in the first measured tacrolimus C0 was observed between extensive and intermediate metabolizers of the two groups.
The genotype-based dosing led to a decrease in the frequency of dose modifications and allowed earlier achievement of target tacrolimus C0. Though these findings in our study were consistent with the previously published literature,[678] this difference could also be attributed to the improving experience of the physicians with tacrolimus dose adjustments in the 2018–2020 cohort compared to the 2016–2018 cohort. However, Shuker et al.[9] did not report any difference in the proportion of patients achieving first steady-state therapeutic concentrations with CYP3A5 genotype-guided dosing.
There was significant inter-individual variability in tacrolimus metabolism between non-expressors (CYP3A5*3/*3) and expressors (CYP3A5*1/*1 and CYP3A5*1/*3), whereas the difference between CYP3A5*1/*1 and CYP3A5*1/*3 subgroups was minimal. This stresses the need for pre-transplant genotyping which would allow the physician to tailor the prescription on an individual basis. Usually, the C/D ratios must remain consistently different between the three genotypes throughout the post-transplant course, but there was an overlap among them between POD 30 and 60 in the control group. This aberrancy could be partly explained by the fact that during the initial postop weeks, the tacrolimus dose usually remained unchanged in the poor metabolizer subgroup, as they had achieved the desired target trough concentration on POD 4. This led to a fall in the tacrolimus C/D ratio subsequently due to exposure to high doses of glucocorticoids, improvement in the uremic milieu (leading to increase in CYP3A5 expression), and improvement in graft function.
The intermediate and extensive metabolizers of the control group were exposed to frequent increments in the administered doses of tacrolimus, causing CYP3A5 enzyme saturation along with tapering doses of prednisolone and infrequent monitoring of tacrolimus C0. These factors could have let to sudden overshoot of subsequent tacrolimus levels causing further increase in their C/D ratios to values similar to the poor metabolizers. Further extension of the study, when the controls would have been on the stable doses of tacrolimus and prednisolone, might have given a better picture of the same.
Lower tacrolimus area under the curve in the early post-transplant period has been significantly associated with acute rejection episodes[1011] especially in the CYP3A5*1/*1 subjects,[12] reinforcing the importance of genotyping in this specific subgroup. There was a declining trend in the incidence of acute rejections in the adapted group, but it was associated with an increased incidence of tacrolimus nephrotoxicity. The earlier achievement of target tacrolimus levels did not translate into better clinical outcomes at the end of three months follow up; however, our study was underpowered to assess the differences in clinical outcomes.
Results of our study support the suggestions that the initial dose of tacrolimus may be increased 2-fold for extensive metabolizers and 1.7–2 fold for intermediate metabolizers [1314], and that the risk of tacrolimus nephrotoxicity could be mitigated by initiating the poor metabolizers at a dose slightly lower than 0.1 mg/kg/day,[15] considering 0.1 mg/kg/day as the conventional dose.
Limitations
The first limitation of our study is that the subjects were allocated in a nonrandomized manner which cannot eliminate for all potential confounders. The two cohorts belonged to two different time periods. Hence, improving experience of the physicians with tacrolimus dose modifications could have led to better rate of achieving the target therapeutic values in the 2018–2020 cohort. Another potential confounder is that the adapted group was the prospective study group and hence physicians could have concentrated more in achieving the target tacrolimus C0 levels. The subjects in the control group had underdosing of immunosuppression in the initial postop weeks as the maximum protocolized increment of tacrolimus dose was 2 mg/day at a time. This practice could have predisposed to increased rate of rejections. The C/D ratios which should remain consistently different between the three genotypes overlapped in the controls, between POD 30 and 60. Since our study was primarily designed to assess the pharmacokinetics of tacrolimus with genotypic variation, the demonstration of the clinical relevance of this approach could not be achieved. We did not evaluate the role of ABCB1. However, studies indicate that the contribution of the ABCB1 polymorphism appears to be weaker than that of CYP3A5 in tacrolimus metabolism.[1617] There are evolving concepts stating that donor genotype plays a role in determining the degree of intrarenal metabolism of tacrolimus in the allograft,[18] which was not determined in our study. Tacrolimus levels were measured by CLIA method, which is not the gold standard.
Conclusion
Genotype-based dosing of tacrolimus leads to more subjects achieving the target tacrolimus levels earlier. However, there may be a higher risk of tacrolimus nephrotoxicity.
Financial support and sponsorship
Nil.
Conflicts of interest
There are no conflicts of interest.
References
- Clinical pharmacokinetics and pharmacodynamics of tacrolimus in solid organ transplantation. Clin Pharmacokinet. 2004;43:623-53.
- [Google Scholar]
- Opportunities to optimize tacrolimus therapy in solid organ transplantation: Report of the European consensus conference. Ther Drug Monit. 2009;31:139-52.
- [Google Scholar]
- KDIGO clinical practice guideline for the care of kidney transplant recipients. Am J Transplant. 2009;9(Suppl 3):S1-155.
- [Google Scholar]
- The effect of CYP3A5 and MDR1 (ABCB1) polymorphisms on cyclosporine and tacrolimus dose requirements and trough blood levels in stable renal transplant patients. Pharmacogenetics. 2004;14:147-54.
- [Google Scholar]
- A randomized clinical trial of age and genotype-guided tacrolimus dosing after pediatric solid organ transplantation. Pediatr Transplant. 2018;22:e13285.
- [Google Scholar]
- Therapeutic concentration achievement and allograft survival comparing usage of conventional tacrolimus doses and CYP3A5 genotype-guided doses in renal transplantation patients. Br J Clin Pharmacol. 2019;85:1964-73.
- [Google Scholar]
- Optimization of initial tacrolimus dose using pharmacogenetic testing. Clin Pharmacol Ther. 2010;87:721-6.
- [Google Scholar]
- A randomized controlled trial comparing the efficacy of CYP3A5 genotype-based with body-weight-based tacrolimus dosing after living donor kidney transplantation. Am J Transplant. 2016;16:2085-96.
- [Google Scholar]
- Pharmacokinetics of tacrolimus-based combination therapies. Nephrol Dial Transplant. 2003;18(Suppl-1):i12-5.
- [Google Scholar]
- Low systemic exposure to tacrolimus correlates with acute rejection. Transplant Proc. 1999;31:296-8.
- [Google Scholar]
- The influence of pharmacogenetics on the time to achieve target tacrolimus concentrations after kidney transplantation. Am J Transplant. 2004;4:914-9.
- [Google Scholar]
- A published pharmacogenetic algorithm was poorly predictive of tacrolimus clearance in an independent cohort of renal transplant recipients. Br J Clin Pharmacol. 2013;76:425-31.
- [Google Scholar]
- Genomewide association study of tacrolimus concentrations in African American kidney transplant recipients identifies multiple CYP3A5 alleles. Am J Transplant. 2016;16:574-82.
- [Google Scholar]
- CYP3A5 and ABCB1 polymorphisms and tacrolimus pharmacokinetics in renal transplant candidates: Guidelines from an experimental study. Am J Transplant. 2006;6:2706-13.
- [Google Scholar]
- Tacrolimus pharmacogenetics: Polymorphisms associated with expression of cytochrome p4503A5 and P-glycoprotein correlate with dose requirement. Transplantation. 2002;74:1486-9.
- [Google Scholar]
- Influence of CYP3A5 and MDR1 (ABCB1) polymorphisms on the pharmacokinetics of tacrolimus in renal transplant recipients. Transplantation. 2004;78:1182-7.
- [Google Scholar]
- Severe acute nephrotoxicity in a kidney transplant patient despite low tacrolimus levels: A possible interaction between donor and recipient genetic polymorphisms. J Clin Pharm Ther. 2013;38:333-6.
- [Google Scholar]


