

Translate this page into:
Comparison of Standard and Global Coagulation Tests in Hemodialysis Patients
*Smita Divyaveer and Sarah Chahal are joint first authors.
Corresponding author: Smita Divyaveer, Department of Nephrology, Post Graduate Institute of Medical Education and Research (PGIMER), Chandigarh, India. Email: divyaveer.ss@gmail.com
-
Received: ,
Accepted: ,
How to cite this article: Divyaveer S, Chahal S, Kashyap M, Premkumar M, Kekan K, Sen A, et al. Comparison of Standard and Global Coagulation Tests in Hemodialysis Patients. Indian J Nephrol. 2025;35:259-64. doi: 10.25259/ijn_473_23
Abstract
Background
Chronic kidney disease (CKD) is associated with an increased tendency of bleeding and thrombosis. There are multiple factors that interact with each other to cause either in CKD patients. Conventional or standard coagulation tests (SCT) have several limitations. Global coagulation test (GCT), such as Sonoclot, gives a real-time detailed analysis of coagulation status.
Materials and Methods
This is a prospective observational cross-sectional study of 50 adult CKD stage 5D (dialysis) patients conducted from January 2020 to January 2022. Clinical details were noted and blood samples were taken for conventional and global coagulation tests prior to dialysis. Correlation between SCT and GCT as well as clinical hemostatic events was analyzed.
Results
Fifty patients were enrolled. Bleeding and thrombosis occurred in 7 and 5 patients, respectively. There was a significant correlation between some SCT and GCT parameters. None of the SCT parameter derangement was associated with any thrombotic episodes except increased fibrinogen level which was associated with thrombotic events. On the contrary, patients with hypocoagulability according to SCT actually had thrombotic events. Parameters of GCT, such as clot rate, time to peak, and platelet function were significantly associated with thrombotic episodes.
Conclusion
SCT and GCT parameters do not correlate with each other. SCT is not associated with clinically significant bleeding and thrombotic events. Some GCT parameters are associated with thrombotic events. GCT are real time and are better than SCT to reflect the coagulation status in patients on dialysis.
Keywords
CKD
Coagulation
Dialysis
Prothrombin time
Sonoclot

Introduction
Chronic kidney disease (CKD) is associated with increased thrombosis and bleeding.1 Despite treatment of advanced renal failure with hemodialysis, these disorders continue to occur frequently. Thrombosis contributes to cardiovascular disease which is a leading cause of mortality in CKD.1 The heightened bleeding risk in CKD makes it difficult to prevent thrombotic conditions using anti-platelet or anticoagulants.2,3
A multitude of factors interplay to cause bleeding in CKD of which platelet dysfunction is the most powerful one. Other contributory factors are anemia, small and large molecular weight uremic toxins.4,5 Hemodialysis can correct these derangements partially, but it can aggravate bleeding due to anticoagulation and its effects on younger platelets.6 Paradoxically, CKD patients are equally predisposed to thrombosis. Thrombotic events, such as arterial and venous thrombosis and vascular access failures, are common in CKD.7–11 In order to study coagulation changes occurring in dialysis patients, researchers have earlier tried tests such as bleeding time, and standard coagulation tests (SCT) like PT/APTT/factor assays, fibrinogen, d-dimer concentration, inter factor complexes, etc. but they cannot qualify or quantify thrombotic tendency.
Global coagulation assays (GCA) have become automated and easy to use over time and are being used as a bedside tool to assess coagulation in liver transplantation,12 cardiac surgeries13 and, more recently in other hypercoagulable states.13,14 They unravel bleeding and thrombotic risks and have a very short turnaround time.
We compare the coagulation profile of dialysis patients using SCT and GCA, to assess the association of their parameters with clinical bleeding and thrombotic events.
Materials and Methods
This is a prospective cross-sectional study conducted at the Department of Nephrology at the Postgraduate Institute of Medical Education and Research, Chandigarh. We enrolled 50 adult patients on dialysis for this pilot study. Exclusion criteria was pre-existing diseases of coagulation, sepsis, disseminated intravascular coagulation, malignancy, therapeutic anticoagulation, pregnancy, use of progesterone or estrogens. Patients who had a clinical event more than 24 hours prior to sample collection were excluded from analysis. Additionally, patients in whom dialysis was terminated before 4 hours were excluded from analysis.
Institutional ethics committee approval was obtained prior to enrollment, and informed and written consent was also obtained from the participants. The study was conducted as per the principles for medical research by declaration of Helsinki. This study is registered with CTRI number: CTRI/2020/10/028389.
Clinical and lab data were recorded. SCT including prothrombin time (PT), prothrombin time index (PTI), international normalized ratio (INR), activated partial prothrombin time (aPTT), fibrinogen, D-dimer and GCA in the form of Sonoclot were done prior to dialysis.
GCA was done using Sonoclot Coagulation and Platelet Function Analyzer, Sienco Inc., Arvada, CO, USA according to the manufacturer’s instructions. The parameters included activated clotting time (ACT), clot rate (CT), time to peak (TP), peak amplitude (PA), platelet function (PF).15 Changes in GCA parameters, i.e. increase in clot rate, increase in peak amplitude, increase in PF, decrease in ACT, decrease in time to peak indicate hypercoagulability. The changes in reverse direction indicate hypocoagulability. The ACT reflects the time before clot formation initiates, clot rate is defined as the rate of fibrin formation, time to peak is the amount of time required for completion of fibrin formation from fibrinogen, peak amplitude is defined as the maximum clot signal, i.e. completion of fibrin formation and platelet function is a measure of all changes occurring during clot retraction phase as seen in Figure 1. Sonoclot can also reveal accelerated fibrinolysis. For each patient, two kits of Sonoclot technique were used: (1) using glass beads as activators for inducing clot initiation, i.e. GB Sonoclot and (2) heparinase glass beads (HGB) for cleaving heparin given to dialysis patients for anticoagulation.16
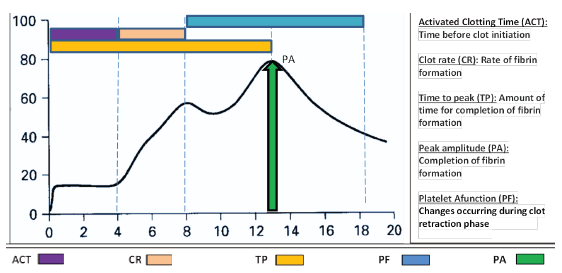
- Graphical presentation of Sonoclot signature curve and its interpretation.
Quantitative data was expressed in mean ± standard deviation or median with interquartile range and depends on the normality of distribution. Qualitative data were expressed in percentage and statistical differences between the proportions were tested by chi-square test or Fisher’s exact test. Spearman correlation coefficient was used to assess the correlation.
Results
Total of 60 patients were enrolled. Data of 10 patients was excluded from the analysis for the following reasons: occurrence of clinical events more than 24 hours prior to sample collection, termination of dialysis before 4 hours due to hypotension, severe hypertension and severe chills. Data of 50 patients was analyzed; mean age was 40.54 ± 15.88 years with maximum number of patients in the age group of 21–30 years [n = 12 (24%)]. Out of 50 patients, 37 (74%) were males and 13 (26%) were females. The mean duration since diagnosis of CKD was 66.56 + 74.181 (SD) months, whereas the median (IQR) was 36 (12–120) months. The mean dialysis vintage was 16.35 + 8.28 (SD) months. Glomerular diseases were the most common underlying cause of CKD (26%), followed by diabetic kidney disease (20%) and hypertensive renal disease (12%), and unknown etiology (20%) and others (22%). Other clinical characteristics and lab parameters are shown in Table 1.
| Age | 40.54 (±15.88) |
| Gender | M; 37 |
| F; 13 | |
| Diabetic | 15 |
| HTN | 44 |
| HTN duration (months) | 24 (14.07) |
| Antiplatelet agents use currently# | 5 (10.0) |
| Previous thrombotic events (occurred more than 3 months back) | |
| CAD# | 5 (10.0) |
| Ischemic CVA# | 1 (2.0) |
| PVD# | 0 (0) |
| DVT# | 1 (2.0) |
| AV fistula thrombosis# | 10 (20.0) |
| Catheter thrombosis# | 8 (16.0) |
| Circuit thrombosis# | 6 (12.0) |
| Any thrombotic event# | 21 (42.0) |
| Previous bleeding events (occurred more than 3 months back) | |
| Organ hemorrhage# | 6 (12.0) |
| Bleeding at catheter or AVF site# | 3 (6.0) |
| Any bleeding event# | 7 (14.0) |
| Baseline investigations | |
| Hemoglobin (g/dl)* | 8.05 (1.70) |
| TLC (Cells per mm3)* | 7674.00 (2933.39) |
| Platelets (1000 per microliter)* | 168.46 (79.64) |
| Creatinine (mg/dl)* | 9. 720 (4.63) |
| SGOT(AST)* | 32.59 (6.7) |
| SGPT(ALT)* | 37.10 (7.4) |
| Bilirubin total* | 1.8 (1) |
*SD: standard deviation, #Percentage, HTN: Hypertension, CKD: Chronic kidney disease, CAD: Coronary artery disease, PVD: Peripheral vascular disease, DVT: Deep vein thrombosis, AV: Arteriovenous, TLC: Total leucocyte count, SGOT: Serum glutamic-oxaloacetic transaminase, SGPT: Serum glutamate pyruvate transaminase, AST: Aspartate aminotransferase, ALT: Alanine aminotransferase, CVA: Cerebral vascular accident, PVD: Peripheral vascular disease, DVT: Deep vein thrombosis.
Nearly half (n = 27) were undergoing HD through fistulas, followed by (n = 14) through temporary venous catheter (IJV or femoral) and rest (n = 9) through permcath.
Out of 35 who got heparin during dialysis, 8 were given standard dose and 27 were given low dose heparin. Fifteen patients received heparin-free hemodialysis. Baseline pre hemodialysis SCT and GCA parameters are shown in Table 2. The sample was run simultaneously in both GB (to check actual coagulation status) and HGB (to nullify effect of heparin) kits for each patient before starting hemodialysis. The correlation between SCT and GCA parameters is shown in Table 3. Positive correlation was obtained between apTT and ACT, apTT and TP, fibrinogen and CR, and negative correlation between apTT and CR, fibrinogen and TP for GB and HGB Sonoclot. Additionally, positive correlation was also found between apTT and PF for HGB. Platelet count was negatively correlated with TP for GB Sonoclot alone. Table 4 shows the association of SCT and GCA parameters with clinically apparent hemostatic events respectively. GB CR, GB and HGB PF demonstrated association with thrombosis. All the parameters were within the normal range except ACT, which was raised more for GB than HGB test and positively correlated with apTT. None of the SCT parameters was significantly associated with bleeding or thrombosis events except fibrinogen levels, which are associated with thrombosis as seen in Table 4. The overall nature of coagulation was indicative of thrombotic tendency. Unexpectedly, high normal levels of PT, PTI, INR were observed for patients with thrombotic events compared to those with no thrombotic event.
| Parameter | Units | Mean (SD) | Normal range | ||
|---|---|---|---|---|---|
| SCT | Prothrombin time | Seconds | 14.2 (2.19) | (10–13) | |
| APTT | Seconds | 34.26 (22.17) | (30–40 sec) | ||
| PTI | Percent | 90.48 (10.10) | % | ||
| INR | 1.10 (0.17) | 0.8–1.1 | |||
| Fibrinogen | g/dL | 3.71 (0.96) | 2–4 g/dL | ||
| GCA | GB Sonoclot | ACT | Sec | 310.12 ± 501.79 | 100–155 sec |
| CR | Signal units/min | 37.15 ± 17.60 | 15–45 signals | ||
| PA | Signal units | 92.48 ± 11.71 | 75–100 signals | ||
| TP | Min | 7.12 ± 4.92 | 4–15 min | ||
| PF | - | 3.87 ± 1.39 | >1.5 | ||
| HGB Sonoclot | ACT | Sec | 169.42 ± 57.11 | 100–155 sec | |
| CR | Signal units/min | 37.37 ± 23.60 | 15–45 signals | ||
| PA | Signal units | 100.62 ± 9.74 | 75–100 signals | ||
| TP | Min | 7.17 ± 2.96 | 4–15 min | ||
| PF | - | 4.06 ± 1.07 | >1.5 | ||
ACT: Activated clotting time, CR: Clot rate, PA: Peak amplitude, TP: Time to peak, PF: Platelet function, GB: Glass beads, HGB: Heparinase glass beads, SCT: Standard coagulation test, GCA: Global coagulation assay, APTT: Activated partial thromboplastin time, PTI: Prothrombin index, INR: International normalised ratio, SD: Standard deviation.
| Pre dialysis parameters | Platelets | PT | PTI | INR | APTT | D Dimer | Fibrinogen | ||
|---|---|---|---|---|---|---|---|---|---|
| Glass bead Sonoclot (GB Sonoclot) | ACT | r value | .037 | .056 | .015 | -.003 | .565 | -.269 | -.207 |
| p value | .797 | .697 | .920 | .984 | .000 | .097 | .168 | ||
| CR | r value | −.028 | .125 | −.096 | .084 | −.635 | .209 | .435 | |
| p value | .855 | .420 | .535 | .590 | .000 | .227 | .005 | ||
| PA | r value | .211 | −.118 | .164 | −.135 | .061 | −.030 | .048 | |
| p value | .169 | .446 | .287 | .382 | .693 | .862 | .768 | ||
| TP | r value | −.300 | −.284 | .218 | −.227 | .482 | −.154 | −.655 | |
| p value | .048 | .062 | .155 | .139 | .001 | .377 | .000 | ||
| PF | r value | .205 | .156 | −.138 | .151 | .261 | −.194 | .209 | |
| p value | .187 | .316 | .379 | .335 | .091 | .272 | .203 | ||
| Heparinase treated glass bead Sonoclot (HGB Sonoclot) | ACT | r value | .034 | −.044 | .206 | −.196 | .518 | −.207 | −.223 |
| p value | .816 | .760 | .161 | .183 | .000 | .206 | .136 | ||
| CR | r value | −.168 | .020 | −.080 | .046 | −.380 | .211 | .299 | |
| p value | .243 | .890 | .588 | .754 | .006 | .198 | .043 | ||
| PA | r value | .192 | .083 | .006 | .035 | .153 | .149 | .065 | |
| p value | .183 | .565 | .966 | .813 | .290 | .365 | .669 | ||
| TP | r value | −.144 | −.117 | .212 | −.216 | .485 | −.197 | −.590 | |
| p value | .318 | .417 | .148 | .140 | .000 | .229 | .000 | ||
| PF | r value | .114 | .105 | −.078 | .111 | .344 | −.017 | .146 | |
| p value | .434 | .473 | .604 | .457 | .015 | .918 | .339 |
ACT: Activated clotting time, CR: Clot rate, PA: Peak amplitude, PF: Platelet function, TP: Time to peak, APTT: Activated partial thromboplastin time, PT: Prothrombin time, PTI: Prothrombin time index, INR: International normalised ratio. Values in bold indicate satistically significant correlation.
| Parameter | Thrombotic events | No thrombotic events | p value | Bleeding events | No bleeding events | p value | |
|---|---|---|---|---|---|---|---|
| PT | 16.1 (15.1–72.25) | 13.9 (13.3–15.2) | 0.01 | 13.9 (12.4–15.7) | 14.1 (13.5–15.5) | 0.42 | |
| APTT | 27.7 (25.25–74.9) | 28.8 (26.3–32.25) | 0.78 | 29.2 (25.3–26.6) | 28.8 (26.8–32) | 0.97 | |
| INR | 1.35 ± 0.32 | 1.07 ± 0.14 | 0.01 | 1.07 ± 0.09 | 1.1 ± 0.18 | 0.61 | |
| PTI | 75.0 ± 15.12 | 91.89 ± 8.44 | 0.01 | 92.85 ± 7.51 | 90.07 ± 10.5 | 0.50 | |
| Fibrinogen | 4.84 ± 1.08 | 3.60 ± 0.89 | 0.01 | 3.7 ± 1.17 | 3.71 ± 0.94 | 0.72 | |
| GB sonoclot | ACT | 144.6 ± 94.99 | 328.5 ± 525.48 | 0.22 | 432.7 ± 664.9 | 290.16 ± 477.17 | 0.24 |
| CR | 60.0 ± 23.15 | 34.87 ± 15.54 | 0.01 | 27.66 ± 20.0 | 38.65 ± 17.0 | 0.16 | |
| PA | 86.12 ± 6.83 | 93.12 ± 11.96 | 0.05 | 91.66 ± 13.29 | 92.61 ± 11.63 | 0.93 | |
| TP | 3.5 ± 1.0 | 7.48 ± 5.01 | <0.01 | 11.08 ± 9.51 | 6.5 ± 3.6 | 0.10 | |
| PF | 5.02 ± 0.49 | 3.75 ± 1.4 | 0.02 | 3.03 ± 1.79 | 4.01 ± 1.29 | 0.16 | |
| HGB sonoclot | ACT | 137.4 ± 94.63 | 172.98 ± 51.85 | 0.06 | 175.86 ± 22.89 | 168.37 ± 61.01 | 0.41 |
| CR | 66.7 ± 53.94 | 34.11 ± 15.72 | 0.18 | 37.28 ± 13.99 | 37.39 ± 24.93 | 0.66 | |
| PA | 103.0 ± 14.4 | 100.35 ± 9.28 | 0.72 | 97.35 ± 3.11 | 101.15 ± 10.35 | 0.09 | |
| TP | 6.4 ± 5.41 | 7.25 ± 2.65 | 0.07 | 7.42 ± 2.09 | 7.12 ± 3.09 | 0.34 | |
| PF | 3.36 ± 0.88 | 4.13 ± 1.06 | 0.03 | 4.24 ± 0.74 | 4.02 ± 1.1 | 0.98 | |
GB sonoclot: Glass bead sonoclot, HGB: Heparinase treated glass bead sonoclot, ACT: Activated clotting time, CR: Clot rate, PA: Peak amplitude, TP: Time to peak, PF: Platelet function, PT: Prothrombin time, APTT: Activated partial thromboplastin time, INR: International normalized ratio, PTI: Prothrombin time index, significant values are highlighted in bold.
Discussion
In this study, we report a comprehensive analysis by Sonoclot signature, a GCA in dialysis patients along with comparison with SCT. SCT assess only initial part of the hemostasis until the beginning of the thrombin burst while Sonoclot, a GCA assesses not only thrombin formation but also maximum clot formation, clot strength and clot contraction as shown in Figure 1.17 The SCT generally reflects bleeding risk18 when values are deranged but not the thrombotic risk with the exception of fibrinogen levels. However, fibrinogen levels are not routinely tested in CKD patients. We also report the association of Sonoclot signature versus SCT with clinical bleeding and thrombotic events for the first time. Other GCAs like TEG (thromboelastography), calibrated automated thrombogram (CAT), overall hemostatic potential (OHP), ROTEM (rotational thromboelastometry) as well as Sonoclot have been tested in CKD patients, all based on some or all of the phases of the process of clot formation and lysis. ROTEM is a modification of TEG and both techniques rely on impedance to movement caused by increasing viscosity of clot. CAT method detects fluorescence signal in the increasingly coagulating sample while in OHP measures optical density of clot; neither are elaborate but report some coagulation steps. Amongst these, Sonoclot and ROTEM give the most comprehensive overview of bleeding and thrombotic tendencies. ROTEM generates parameters such as clotting time (CT), alpha angle, maximum clot formation (MCF), which are relatable to Sonoclot parameters of activated clotting time, time to peak, peak amplitude (PA), respectively. Although some differences exist, ROTEM analyses can study change in extrinsic coagulation pathways and fibrin levels. Additionally, ROTEM can also analyze clot lysis in more details via clot formation time (CFT), maximum lysis (ML), unlike Sonoclot that determines platelet function. ROTEM itself is not sufficient for PF analysis unless combined with platelet aggregometry. Amongst these, Sonoclot and ROTEM give the most comprehensive overview of bleeding and thrombotic tendencies.
A study by Lim et al.19 tested TEG, CAT and OHP and concluded that CKD patients have hypercoagulable tendency, increased clot strength and decreased clot lysis than controls, respectively. Of SCTs, only fibrinogen was higher in patients with thrombosis, while multiple global coagulation test (GCT) parameters were significantly high in thrombotic patients. The authors have shown that patients on hemodialysis had increased subsequent thrombotic events as compared to pre-dialysis CKD patients.18 An abstract by Lim et al.20 evaluated the same GCAs in dialysis patients in comparison with healthy controls and concluded that dialysis patients are hypercoagulable.19 SCT parameters were not reported. Study by Pluta et al.21 on advanced CKD patients used ROTEM and Aggregometry to assess hemostatic parameters and platelet function. This study, too, demonstrated an increased thrombotic tendency.20 A study by Abdelmaguid et al. evaluated coagulation and platelet function assays using ROTEM, CAT and multiple electrode aggregometry (MEA), a modification of aggregometry in CKD patients. The study found poor correlations of INR and apTT with ROTEM parameters, which were all within the normal range. This study reported hypofibrinolysis and hypercoagulable tendencies in CKD patients. Platelet aggregation was significantly lower in advanced CKD.21 Another study has shown that patients with renal dysfunction and cerebrovascular accident have a hypercoagulable state on thromboelastography (TEG).22 Our study is in congruence with these previous studies reporting increased thrombotic tendency. Unlike PT which was paradoxically high normal range in patients with thrombosis as compared to those without; GCA parameters CR and PF had relevant association with thrombosis, implying that GCA indicates thrombotic risk better than SCT. Sonoclot can be of help in individualized anticoagulation or anti-platelets prescription for patients with increased risk of thrombosis while avoiding their use in those with low risk. The track trial is underway to determine if low dose anticoagulation can improve outcomes in CKD (ClinicalTrials.gov Identifier: NCT03969953). Sonoclot can be a good adjunct for similar studies in future.
In our study, hypocoagulability indicated by ACT can be partially attributed to heparin, as it was minimally reversed by heparinase. Uremic toxins also possibly contribute to hypocoagulability. Previous studies using SCT have shown an increased bleeding tendency in advanced CKD,23 however, some did not find any abnormality in coagulation. Dialysis itself removes uremic toxins and this is believed to improve uremic bleeding.24 The utility of Sonoclot as a bedside test to adjust anticoagulation in dialysis has been demonstrated earlier25–27 but the association of Sonoclot parameters with actual clinical bleeding events is rather poor. A possible reason for the absence of significant association of clinical bleeding events with GCT parameters could be that the study participants were on maintenance hemodialysis and did not have severe uremia. Most of the bleeding events were associated with some local lesion or abnormality. Nonetheless, GCT may be useful for monitoring coagulation status of CKD patients on novel oral anticoagulants (NOAC).28 The use of NOAC is expanding in nephrology29 and GCT can serve as a tool to avoid complications of catastrophic bleeding associated with their use.
Strengths of this study include comprehensive comparison and analysis of Sonoclot signature, interpretation of Sonoclot waveform by a single expert, a thorough clinical history and record of thrombosis and bleeding events, and analysis of association of coagulations tests with clinical hemostatic events. It is obvious that local causes of bleeding/thrombosis surgical cause angiodysplasia, aneurysm, etc. will not reflect in in-vitro tests. Limitations of this study include relatively small number of patients, exclusion of patients from analysis if they had a clinical bleeding or thrombotic event more than 24 hours prior to collection, absence of a control arm, variable vascular access for dialysis and unavailability of repeated Sonoclot measurements.
The SCT and GCT do not correlate well. SCT can imply bleeding risk but does not offer any information on thrombotic risk. GCA parameters can indicate both bleeding and thrombotic risk and some parameters such as clot rate, time to peak and platelet function are significantly associated with clinically apparent thrombotic events.
In view of its ability to split and display the coagulation steps in parts, its real-time nature and a rapid turnaround time, GCT such as Sonoclot can be of tremendous importance to analyze the exact coagulation abnormality in patients with ESRD on dialysis which would not only help to identify the baseline coagulation status but can also help in guiding appropriate corrective steps. Hemostasis in CKD is a complex process. There is a mix of bleeding and thrombotic tendency in CKD (multi factorial) and a shift towards one over the other may contribute to clinical bleeding or thrombotic episode. Role of GCAs needs to be explored further in future studies in the management of CKD patients.
Acknowledgements
We thank Mrs. Lalita Arora and Mrs. Renu Bhalla for providing technical help for the Sonoclot procedure. We also thank all the doctors, dialysis technicians and paramedical staff involved in care of all study participants.
Conflicts of interest
There are no conflicts of interest.
References
- Disorders of hemostasis associated with chronic kidney disease. InSeminars in thrombosis and hemostasis. 2010;31:034-040. © Thieme Medical Publishers
- [CrossRef] [PubMed] [Google Scholar]
- Cardiovascular disease in chronic kidney disease: pathophysiological insights and therapeutic options. Circulation. 2021;143:1157-72.
- [CrossRef] [PubMed] [PubMed Central] [Google Scholar]
- Stroke and bleeding in atrial fibrillation with chronic kidney disease. N Engl J Med. 2012;367:625-35.
- [CrossRef] [PubMed] [Google Scholar]
- Effects of antiplatelet therapy on mortality and cardiovascular and bleeding outcomes in persons with chronic kidney disease: A systematic review and meta-analysis. Ann Intern Med. 2012;156:445-59.
- [CrossRef] [PubMed] [Google Scholar]
- Hemostasis in renal disease: pathophysiology and management. Am J Med. 1994;96:168-79.
- [CrossRef] [PubMed] [Google Scholar]
- Coagulation and haemodialysis access thrombosis. Nephrol Dial Transplant. 2000;15:1755-60.
- [CrossRef] [PubMed] [Google Scholar]
- Sonoclot coagulation analysis: new bedside monitoring for determination of the appropriate heparin dose during haemodialysis. Nephrol Dial Transplant. 2002;17:1457-62.
- [CrossRef] [PubMed] [Google Scholar]
- Cardiovascular outcomes and all-cause mortality: Exploring the interaction between CKD and cardiovascular disease. Am J Kidney Dis. 2006;48:392-401.
- [CrossRef] [PubMed] [Google Scholar]
- Cardiovascular mortality in end-stage renal disease. Am J Med Sci. 2003;325:163-7.
- [CrossRef] [PubMed] [Google Scholar]
- Adverse safety events in patients with Chronic Kidney Disease (CKD) Expert Opin Drug Saf. 2016;15:1597-607.
- [CrossRef] [PubMed] [Google Scholar]
- Antiplatelet therapy in the management of cardiovascular disease in patients with CKD: What is the evidence? Clin J Am Soc Nephrol. 2013;8:665-74.
- [CrossRef] [PubMed] [PubMed Central] [Google Scholar]
- Chronic kidney disease and venous thromboembolism: epidemiology and mechanisms. Curr Opin Pulm Med. 2009;15:408.
- [CrossRef] [PubMed] [PubMed Central] [Google Scholar]
- Sonoclot signature analysis in patients with liver disease and its correlation with conventional coagulation studies. Adv Hematol. 2013;2013:237351.
- [CrossRef] [PubMed] [PubMed Central] [Google Scholar]
- A general review of major global coagulation assays: thrombelastography, thrombin generation test and clot waveform analysis. Thromb J. 2015;13:1-6.
- [CrossRef] [PubMed] [PubMed Central] [Google Scholar]
- Sonoclot signature analysis: A new point-of-care testing method for defining heat stroke-induced coagulopathy. Int J Gen Med 2021:6925-33..
- [CrossRef] [PubMed] [PubMed Central] [Google Scholar]
- Platelet fuznction monitoring with the sonoclot analyzer after in vitro tirofiban and heparin administration. J Thorac Cardiovasc Surg. 2006;131:1314-22.
- [CrossRef] [PubMed] [Google Scholar]
- Bleeding and thrombotic complications of kidney disease. Blood Rev. 2011;25:271-8.
- [CrossRef] [PubMed] [Google Scholar]
- Global coagulation assays in patients with chronic kidney disease and their role in predicting thrombotic risk. Thromb Res. 2023;226:127-35.
- [CrossRef] [PubMed] [Google Scholar]
- Global Coagulation assays in patients with chronic kidney disease [abstract] Research and practice in thrombosis and haemostasis. 2020;4 https://abstracts.isth.org/abstract/global-coagulation-assays-in-patients-with-chronic-kidney-disease/. Accessed. 2024 Feb
- [Google Scholar]
- Assessment of the hemostatic parameters and platelet function on thromboelastometry and impedance aggregometry in hemodialysis patients qualified for kidney transplantation: preliminary report. Transplant Proc. 2016;48:1431-4.
- [CrossRef] [PubMed] [Google Scholar]
- Evaluation of novel coagulation and platelet function assays in patients with chronic kidney disease. J Thromb Haemost. 2022;20:845-56.
- [CrossRef] [PubMed] [PubMed Central] [Google Scholar]
- Thrombelastography suggests hypercoagulability in patients with renal dysfunction and intracerebral hemorrhage. J Stroke Cerebrovasc Dis. 2018;27:1350-6.
- [CrossRef] [PubMed] [Google Scholar]
- Chronic kidney disease and bleeding risk in patients at high cardiovascular risk: A cohort study. J Thromb Haemost. 2018;16:65-73.
- [CrossRef] [PubMed] [Google Scholar]
- Uremic bleeding: Pathophysiology and clinical risk factors. Thromb Res. 2006;118:417-22.
- [CrossRef] [PubMed] [Google Scholar]
- Comparison of coagulation monitoring using ROTEM and sonoclot devices in cardiac surgery: A single-centre prospective observational study. Minerva Anestesiol. 2022;88:680-9.
- [CrossRef] [PubMed] [Google Scholar]
- Sonoclot coagulation analysis: new bedside monitoring for determination of the appropriate heparin dose during haemodialysis. Nephrol Dial Transplant. 2002;17:1457-62.
- [CrossRef] [PubMed] [Google Scholar]
- Three anticoagulants on coagulation states of hemodialysis-dependent patients. Indian J Nephrol. 2007;17
- [Google Scholar]
- Preventing stroke in patients with chronic kidney disease and atrial fibrillation: Benefit and risks of old and new oral anticoagulants. Stroke. 2013;44:2935-41.
- [CrossRef] [PubMed] [Google Scholar]


