

Translate this page into:
Hepcidin, GDF-15 and their Impact on Iron Metabolism in CKD
 , KSS Sai Baba1, N.N. Sreedevi1, Sree Bhushan Raju2, Siraj Ahmed Khan1, M. Vijaya Bhaskar1, Noorjahan Mohammed1,
Corresponding author: Noorjahan Mohammed, Department of Biochemistry, Nizam’s Institute of Medical Sciences, Hyderabad, Telangana, India. E-mail: m_noorjahan@yahoo.co.in
-
Received: ,
Accepted: ,
How to cite this article: Das P, Sai Baba KSS, Sreedevi NN, Raju SB, Khan SA, Vijaya Bhaskar M, et al. Hepcidin, GDF-15 and their Impact on Iron Metabolism in CKD. Indian J Nephrol. doi: 10.25259/IJN_242_2024
Abstract
Background
Anemia is an important complication in chronic kidney disease (CKD). We studied the diagnostic accuracy of hepcidin and growth differentiation factor-15 (GDF-15) as early markers of iron deficiency anemia (IDA) in non-dialysis (ND-CKD) patients.
Materials and Methods
This was a cross-sectional, case-control study comprising 100 cases of CKD (newly diagnosed and non-dialyzed) and 40 healthy controls. Serum levels of hepcidin and GDF-15 were estimated using ELISA-based assays. Receiver operator characteristics were used to evaluate the diagnostic validity of hepcidin and GDF-15 for absolute and functional iron deficiency anemia.
Results
About 33% of the cases were females with a mean age of 47.64 (± 13.68) years. The predictive value of hepcidin for diagnosing functional IDA in CKD was found to be 69.1% (95% CI: 52.5% to 82.7%), and that of GDF-15 was found to be 68.8% (95% CI: 52.6% to 82.1%). Hepcidin significantly correlated with hemoglobin (r = 0.278, p = 0.005) and serum iron (r = 0.222; p = 0.025). GDF-15 positively correlated with ferritin (r = 0.346, p < 0.0001) and hsCRP (r = 0.223, p = 0.0088) and negatively correlated with eGFR (r = -0.462, p < 000001), Hb (r = -0.481, p < 0.00001) and TIBC (r = -0.353, p < 0.0001).
Conclusion
Hepcidin and GDF-15 could predict functional IDA in our patients but not absolute IDA.
Keywords
Hepcidin
GDF-15
Iron deficiency
Anemia
CKD

Introduction
Anemia is an important complication in CKD and is associated with diminished health-related quality of life. The pathogenic mechanisms underlying the development of anemia in CKD are multifactorial, including decreased production of erythropoietin and reticuloendothelial iron blockade, a direct result of chronic kidney inflammation.1
The levels of hepcidin, a 25 amino-acid peptide hormone that orchestrates systemic iron metabolism in the body are increased in CKD. Hepcidin is synthesized within hepatocytes and degrades ferroportin on the cell membranes of enterocytes and macrophages, blocking iron transport from the duodenum and abating serum iron levels. Its production is stimulated by increased iron uptake and inflammation and inhibited by iron deficiency and hypoxia.2 Elevated hepcidin prevents the release of stored intracellular iron, reducing availability for erythropoiesis and causing functional IDA. Considering these earlier findings, it is reasonable to suggest that serum hepcidin level could be a valuable indicator of the iron status of individuals with CKD. However, the efficacy of using hepcidin as a diagnostic tool for iron deficiency anemia in ND-CKD patients is yet to be determined, particularly in the South Indian population.
GDF-15, a regulator of hepcidin and an anti-inflammatory cytokine of the TGF-β superfamily, is produced primarily by macrophages, cardiomyocytes, adipocytes, and cancer cells in response to various stressors such as inflammation, tissue injury, and hypoxia. In a chronic inflammatory state like CKD, copious secretion of GDF-15 by erythroblasts leads to hepcidin suppression, thereby depleting iron stores. Therefore, GDF-15 is potentially involved in iron homeostasis.3 GDF-15 has also emerged as a risk marker of functional iron deficiency in dialysis patients.4 We evaluated the relation betweenh hepcidin and GDF-15 and absolute and functional iron deficiency anemia in CKD patients not on dialysis.
Materials and Methods
This cross-sectional, case-control study was conducted at the Nizam’s Institute of Medical Sciences (NIMS), Hyderabad, from April 2021 to March 2022, comprising 100 adult cases of newly diagnosed pre-dialysis CKD patients diagnosed based on estimated glomerular filtration rate (eGFR) of less than 60 ml/min calculated using Chronic Kidney Disease Epidemiology Collaboration (CKD-EPI) equation, and 40 healthy controls. Patients with pre-existing acute or chronic inflammation (malignancy, end-stage liver disease, and collagen vascular diseases like systemic lupus erythematosus and rheumatoid arthritis), history of oral or IV parenteral iron therapy and blood transfusion within preceding 3 months and currently on EPO therapy were excluded. The control subjects were healthy individuals without comorbidities recruited from the health examination clinics during the same study period and matched to cases by age and sex. The Institutional Ethics Committee approved the study (EC/NIMS/2724/2021) and all subjects gave written informed consent.
Absolute iron deficiency was defined by serum ferritin levels below 100 ng/mL and transferrin saturation (TSAT) below 20% and functional iron deficiency by serum ferritin levels above 100 ng/mL and TSAT below 20%.5 Anemia was defined by hemoglobin level below 13 g/dL in men and below 12 g/dL in women.6 Patients were classified as having iron deficiency anemia (IDA) if they presented with anemia and either absolute or functional iron deficiency.7
A 7 mL venous blood samples were drawn and divided as follows: 2 ml specimens were collected in an EDTA tube for Complete Blood Count (CBC), 5 mL specimens were collected into plain chemistry tube to clot and sera were separated without delay (immediate centrifugation at 3000 RPM; 15 min), then divided into two portions: one for hsCRP, iron profile (serum iron, total iron binding capacity, serum ferritin) and the other portion aliquoted and stored at -40°C until further analysis. CBC was measured using Beckman Coulter DxH 800. We measured the iron profile using the Roche Cobas c501 autoanalyzer. TSAT was calculated as the ratio of serum iron (ferrozine method) and TIBC (calculated), expressed as a percentage. hsCRP (immunoturbidimetry) using Beckman Coulter AU5800. Serum Hepcidin and GDF-15 concentrations were measured by competitive enzyme-linked immunosorbent assay (ELISA) and sandwich ELISA techniques (Krishgen Biosystems, CA, USA), respectively.
Statistical analysis
Statistical analysis was done using Microsoft Excel, GraphPad Prism version 9, and MedCalc version 20.114. The normality of the data was tested using the Kolmogorov–Smirnov test. Categorical variables were presented in number and percentage (%), and continuous variables were presented as mean ± standard deviation and median with interquartile range (IQR) (as applicable). The two groups (controls and cases) were compared using an unpaired t-test and Mann-Whitney U test when parametric and non-parametric data, respectively. p < 0.05 was taken as significant. A chi-square test was used to compare the frequency differences between the two study groups. We conducted a One-Way ANOVA test with Tukey post hoc analysis for parametric data and the Kruskal-Wallis test for non-parametric data to compare more than two groups. The Receiver Operating Characteristic curve assessed the best cut-off points with sensitivity and specificity.
Results
The mean age of cases and controls were 47.6 (±13.6) and 45.1 (± 6.3) years, respectively, and there was an almost equal proportion of males and females in cases (males 67/100) and controls (males 28/40). The spectrum of etiologies in our CKD patients was diverse: diabetic nephropathy (38.6%), chronic glomerulonephritis (20.4%), hypertensive nephrosclerosis (11%), CKD from other causes, drug-induced nephropathy (alternative medicines), and history of AKI (5%) and CKD of unknown etiology (25%).
Table 1 showed a significant difference in all lab parameters (p-value < 0.001) except TSAT and hepcidin between cases and controls. Also, median levels of serum GDF-15 among patients were higher than those of the control group. In stagewise comparison, we noted a statistically significant difference in all analytes except TSAT [Table 2]. Hemoglobin decreased from Stage 3A to 5, although post-hoc analysis showed the difference was insignificant between Stages 3A and 3B and 3B and 4. Serum iron levels showed a significant difference in stage 3B (p = 0.0472), stage 4 (p = 0.049), and stage 5 (p = 0.004), respectively, as compared to controls. A significant difference was noted in stages 3A (p = 0.0161), 3B (p = 0.0002), 4 (p = 0.0001), and 5 (p < 0.0001) vs. controls, and the last difference being the most significant. A significant difference was observed in ferritin levels between stages 3A and 5 (p = 0.0473). Significantly elevated in stage 5 vs controls (p = 0.0002), but no statistically significant difference was found in the ferritin levels between the various stages. Hepcidin levels showed a significant difference between Stages 3A and Stages 4 (p = 0.0334) and stage 5 (p = 0.0436), respectively, and between Stage 3B and Stage 4(p = 0.0005) and Stage 5 (p = 0.0006) respectively. Similarly, for GDF-15, a significant difference was noted between stage 5 and stage 3A (p = 0.0005) as well as controls (p < 0.0001). An increasing trend in GDF-15 was noted from controls to stage 5. Hepcidin has shown a significant positive correlation with hemoglobin (r = 0.278, p = 0.005) and serum iron (r = 0.222; p = 0.025), but with other variables, there was no significant correlation [Table S1]. GDF-15 has shown significant positive correlation with serum ferritin (r = 0.346, p < 0.0001) and serum hsCRP (r = 0.223, p = 0.0088) while eGFR (r = -0.462, p < 000001), Hb (r = -0.481, p < 0.00001) and TIBC (r = -0.353, p < 0.0001 were significantly negatively correlated with GDF-15 among CKD patients [Table S2]. When compared as per iron deficiency anemia status in CKD cases, median levels of hepcidin (pg/ml) were found to be lower in IDA [163.5 (115.8-277.4)] than in non-IDA [214.3(178.3-332.7] and non-anaemic [305.5(224.5-363.6)], (p<0.005). In contrast, median levels of serum GDF-15 (ng/ml) were higher in IDA [30.31(15.36-41.70) as compared to non-IDA 27.57(19.19-39.17) and non-anaemic [21.07(14.32-28.62), p-value <0.02].
| Variable | Mean ± SD, Median (Inter-quartile range) | ||
|---|---|---|---|
| Controls (n = 40) | Cases (n = 100) | p | |
|
Age (years) |
45.1 ± 6.3 |
47.6 ± 13.6 |
0.253 |
|
Gender |
Males- 28 |
Males- 67 |
|
|
Females- 12 |
Females- 33 |
0.351 |
|
|
Serum Creatinine (mg/dl) |
0.83 (0.74-0.92) |
2.35 (1.62-6.78) |
<0.0001 |
| eGFR (ml/min/1.76m2) | 115.22 ± 15.73 | 26.72 ± 17.42 | <0.0001 |
| Hemoglobin (g/dl) | 15.5 ± 1.25 | 10.66 ± 2.49 | <0.0001 |
| Iron (μg/dl) | 86.5 (67.5-107.8) | 60.0 (48-89.5) | <0.0001 |
| TSAT (%) | 28 (21.00-30.75) | 26 (17-36) | 0.8420 |
| TIBC (μg/dl) | 341.5 (317.3-373.3) | 256 (209.5-307) | <0.0001 |
| Ferritin (ng/ml) | 109.5 (54.0-158.3) | 197.0 (69- 383) | 0.0015 |
| hsCRP (mg/L) | 1.37 (0.88-2.13) | 3.49 (1.26-9.18) | <0.0001 |
| Hepcidin (pg/ml) | 282.4 (233.5-355.8) | 233.6 (159.2-329.5) | 0.1921 |
| GDF-15 (ng/ml) | 15.47 (11.63-23.86) | 25.12 (15.32-36.85) | <0.0001 |
Unpaired t test is done for comparison of normally distributed parameters and Mann Whitney U test for non-normally distributed parameters. p < 0.05 is taken as significant. eGFR: estimated Glomerular Filtration rate, GDF-15: Growth Differentiation Factor-15, TSAT: Transferrin Saturation, TIBC: Total Iron Binding Capacity, hsCRP: highly sensitive C-Reactive Protein, IQR: Inter-quartile range.
| Variable | Mean ± SD, Median (IQR) | |||||
|---|---|---|---|---|---|---|
| Controls | Stage 3A | Stage 3B | Stage 4 | Stage 5 | p | |
| Creatinine (mg/dl) | 0.83 (0.74-0.92) | 1.48 (1.43-1.64) | 1.80 (1.57-1.93) | 3.23 (2.58-3.64) | 10.09 (8.50-14.01) | <0.0001 |
| eGFR (ml/min/1.76m2) | 115.2 ± 15.73 | 49.52 ± 6.72 | 37.6 ± 4.68 | 20.29 ± 3.89 | 5.27 ± 2.41 | <0.0001 |
| Hb (g/dl) | 15.5 ± 1.25 | 12.6 ± 1.5 | 11.81 ± 1.95 | 10.53 ± 1.93 | 8.24 ± 2.02 | <0.0001 |
| Iron (μg/dl) | 86.5 (67.5-107.8)a,b,c | 75.0 (51.5-110.5) | 56.0 (51.0-85.25) | 59.0 (44.5-86.5) | 56.0 (41.0-81.0) | 0.0018 |
| TSAT (%) | 28 (21-30.5) | 28 (19-38.5) | 23.5 (17-34.25) | 25 (17-34.5) | 28 (18.5-38.0) | 0.8103 |
| TIBC (μg/dl) | 341.1 (317.3-373.3)d,e | 293.0 (238.0-347.5)g | 273.5 (236.8-315.8)f | 268.0 (227.5-301.5) | 212.0 (181.0-262.0)h | <0.0001 |
| Ferritin (ng/ml) | 109.5 (54.0-158.3)i | 122.0 (69.0-330.5) | 185.5 (69.25-264.8) | 146.0 (33.0-304.0) | 335.0 (182.0-585.0) | 0.0001 |
| hsCRP (mg/L) | 1.37 (0.88-2.13) | 2.78 (1.90-10.61) | 5.62 (2.54-20.03) | 2.42 (0.95-6.49) | 4.28 (1.31-8.88) | 0.0003 |
| Hepcidin (pg/ml) | 282.4 (233.5-355.8) | 295.7 (204.1-365.4)j | 309.5 (254.2-382.6)l,m | 181.7 (120.9-241.7)k | 186.5 (118.0-261.5) | <0.0001 |
| GDF-15 (ng/ml) | 15.47 (11.63-23.86)n | 17.26 (11.05-24.23)o | 24.92 (15.53-31.84) | 26.12 (13.85-32.84) | 36.1 (25.11-47.68) | <0.0001 |
One-way ANOVA is done for comparison of normally distributed parameters and Kruskal-Wallis test for non-normally distributed parameters. p < 0.05 is taken as significant. Dunn’s multiple comparison test was done for post-hoc analysis of non-parametric data. “a” represents p = 0.004 between controls and Stage 5, “b” represents p = 0.049 between controls and Stage 4, “c” represents p = 0.047 between controls and Stage 3B, “d” represents p < 0.0001 between controls and Stage 5, “e” represents p = 0.0001 between controls and Stage 4, “f” represents p = 0.0002 between controls and Stage 3B, “g” represents p = 0.016 between controls and Stage 3A, “h” represents p = 0.047 between Stage 3A and Stage 5, “i” represents p = 0.0002 between controls and Stage 5, “j” represents p = 0.018 between Stage 3A and Stage 5, “k” represents p = 0.018 between Stage 3A and Stage 4, “l” represents p = 0.003 between Stage 3B and Stage 5, “m” represents p = 0.018 between Stage 3B and Stage 4, “n” represents p < 0.0001 between controls and Stage 5, “o” represents p = 0.0005 between Stage 3A and Stage 5. Hb: Hemoglobin, eGFR: estimated Glomerular Filtration rate, GDF-15: Growth Differentiation Factor-15, TSAT: Transferrin Saturation, TIBC: Total Iron Binding Capacity, hsCRP: highly sensitive C-Reactive Protein, IQR: Inter-quartile range, CKD: Chronic kidney disease.
The diagnostic value of Hepcidin in Iron deficiency anemia in CKD patients was found to be 70.2% (95%CI: 56.1% to 82%) at a cut-off of 178.78 pg/ml with 72.73% sensitivity and 70.97% specificity with AUC of 0.702 [Table S3, Figure 1].
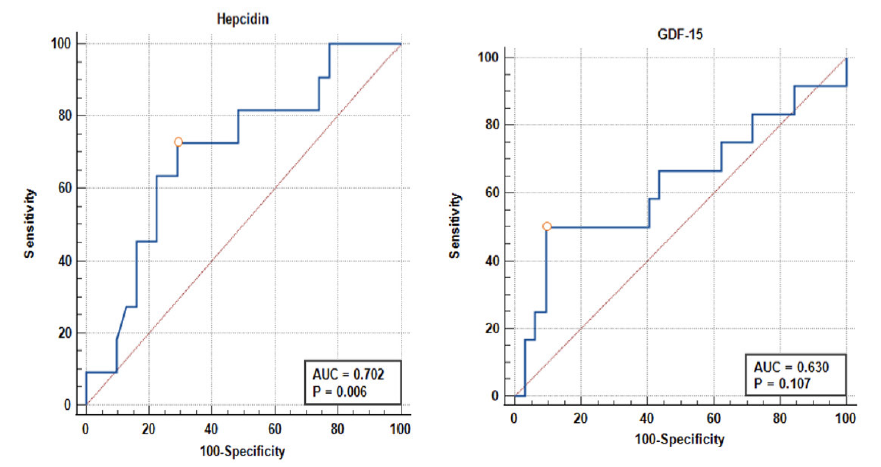
- ROC curve of Hepcidin and GDF-15 in diagnosing Iron-deficiency anemia in CKD. AUC: Area under curve, ROC: Receiver Operating Characteristic, GDF-15: Growth Differentiation Factor-15, CKD: Chronic Kidney Disease
The diagnostic value of GDF-15 in Iron deficiency anemia in CKD patients was found to be 63% (95% CI: 49.1% to 75.5%), with 50% sensitivity and 96.8% specificity at a cut-off of 16.29 pg/ml. However, the result was not significant (p = 0.107) [Table S4, Figure 1].
The predictive value of Hepcidin for diagnosing functional iron deficiency anemia in CKD patients was 69.1% (95%CI: 52.5% to 82.7%). Using the Youden Index, the optimum cut-off for Hepcidin among CKD patients was 233.7 pg/ml, with 73.1% sensitivity and 100% specificity. Likewise, the predictive value of GDF-15 for diagnosing functional iron deficiency anemia in CKD patients was 68.8% (95%CI: 52.6% to 82.1%). Using the Youden Index, the optimum cut-off for GDF-15 among CKD patients was 30.09 ng/ml with 51.9% sensitivity and 93.3% specificity [Table S5, Figure 2].
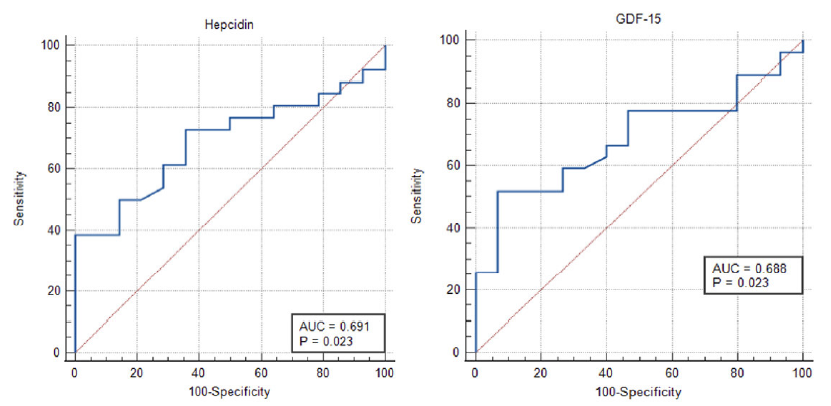
- ROC curve of hepcidin and GDF-15 in diagnosing functional iron deficiency anemia in CKD. AUC: Area under curve, ROC: Receiver Operating Characteristic, GDF-15: Growth Differentiation Factor-15, CKD: Chronic Kidney Disease
Discussion
In our current body of knowledge, this study is the first to examine Hepcidin and GDF-15 as potential indices for IDA among Indians with newly diagnosed non-dialyzed CKD. Serum hepcidin and GDF-15 predicted functional IDA with an accuracy of 69.1% and 68.8%, respectively. Additionally, both these markers predicted IDA with an accuracy of 70.2% and 63.0%, respectively although these results were not significant.
We found no correlation between Hepcidin and eGFR overall; however, across the CKD stages, we found that hepcidin levels increased from stages 3A to 3B but dipped in stages 4 and 5. This aligns with Mercadel et al’s observation that despite rising hepcidin with declining eGFR, CKD patients with absolute iron deficiency still experience a profound hepcidin collapse.8 Moreover, in stagewise analysis, a negative correlation was noted between Hepcidin and eGFR in stage 5, in agreement with other studies.9 Conversely, some authors have found no significant correlation with eGFR.10 These discrepancies may stem from differences in method-sensitivity - our study employed ELISA, while others used mass spectrometry - as well as modest sample sizes and varying population characteristics. This indicates that the hepcidin-eGFR relationship remains unclear and warrants further investigation. Serum ferritin, showed a positive correlation with hepcidin in ESKD patients.11 This finding is concordant with the previous studies.12 In the CKD setting, the direct relationship with ferritin may represent a protective effect of hepcidin against systemic iron overload.13 Ferritin also showed a positive association with hepcidin in non-CKD populations.
In this study, serum GDF-15 was significantly elevated in CKD compared to controls. This is per the observations of other researchers.14 Also, since ferritin is affected by iron status, GDF-15 could be considered a surrogate marker of inflammatory status in CKD15, similar to findings of Nalado et al,.16 Chronic inflammatory state and oxidative injury are the most common mechanisms for raised GDF-15 levels in CKD.17 When serum GDF-15 was compared in the CKD cohort by iron-deficiency status, it was found that GDF-15 declined from IDA to non-IDA and further to non-anemic individuals, a finding similar to other studies.18 We demonstrated a significant positive correlation between GDF-15 and ferritin in contrast to Nalado et al., who found a negative correlation between them.16 Emerging evidence shows that in response to anemia, erythroblasts secrete GDF-15, suppressing hepcidin expression and decreasing iron stores. Yilmaz et al. reported a significant positive correlation between GDF-15 and serum ferritin, but Li et al. reported no significant correlation.4,19 The probable mechanisms that justify the raised GDF-15 levels in IDA are two-fold. Firstly, the expression of GDF-15 increases in the setting of IDA to suppress the high hepcidin levels in the face of ineffective erythropoiesis. Secondly, iron depletion, which independently causes GDF-15 induction, develops in erythroid precursor cells due to iron sequestration in macrophages.20 Our study also found that GDF-15 predicted functional IDA in CKD at a 30.09 ng/ml cut-off with a predictive value of 68.8% (AUC = 0.68), sensitivity of 51.85%, and specificity of 93.33%. Our findings agree with those of Yilmaz et al., who found GDF-15 to be an FID predictor in non-dialyzed CKD patients.4 This is in contrast with the findings of Nalado et al., who maintain that GDF-15 is a predictor of absolute iron deficiency anemia.16 These strikingly different results could be attributed to the differences in the study population, such as racial differences and diversity.
Therefore, our preliminary findings indicate that Hepcidin and GDF-15 may serve as predictive markers for functional iron deficiency in pre-dialysis CKD patients, potentially acting as surrogate markers for IDA when traditional indices like TSAT and ferritin are suboptimal. This could help impede cardiovascular complications, thereby significantly improving clinical outcomes.
Our strengths include a large sample size of non-dialyzed CKD cases across all stages, unlike previous studies focusing on hemodialyzed patients. We stratified anemia based on iron levels and its bioavailability and conducted stagewise comparisons of hepcidin and GDF-15 with other biochemical parameters. However, the cross-sectional design limits our ability to predict the clinical utility of these markers reliably. Serial measurements were not taken, and diurnal variations were not considered.
Our study reveals that hepcidin and GDF-15 hold promise as valuable risk markers to predict functional iron deficiency anemia in newly diagnosed, pre-dialysis CKD patients. This could assist clinicians in assessing iron status and optimizing iron therapy, thereby potentially improving clinical outcomes. However, further validation through randomized prospective studies is required to corroborate our findings and establish reliable cut-offs for serum hepcidin & GDF-15 to predict iron deficiency anemia in these patients.
Acknowledgment
The author gratefully acknowledges the patients who participated in the research and is indebted to her family for their relentless encouragement. Special thanks to faculty and technicians for being a part of this project.
Conflicts of interest
There are no conflicts of interest.
References
- Anemia in renal disease: Diagnosis and management. Blood Rev. 2010;24:39-47.
- [CrossRef] [PubMed] [Google Scholar]
- Hepcidin, an overview of biochemical and clinical properties. Steroids. 2020;160:108661.
- [CrossRef] [PubMed] [Google Scholar]
- GDF-15, iron, and inflammation in early chronic kidney disease among elderly patients. Int Urol Nephrol. 2016;48:839-44.
- [CrossRef] [PubMed] [PubMed Central] [Google Scholar]
- Can serum Gdf-15 be associated with functional iron deficiency in hemodialysis patients? Indian J Hematol Blood Transfus. 2016;32:221-7.
- [CrossRef] [PubMed] [PubMed Central] [Google Scholar]
- Iron deficiency across chronic inflammatory conditions: International expert opinion on definition, diagnosis, and management. Am J Hematol. 2017;92:1068-78.
- [CrossRef] [PubMed] [PubMed Central] [Google Scholar]
- KDIGO clinical practice guideline for anaemia in chronic kidney disease. Kidney Int Suppl. 2012;2:279-335.
- [Google Scholar]
- Assessing iron status: Beyond serum ferritin and transferrin saturation. Clin J Am Soc Nephrol. 2006;1(Suppl 1):S4-8.
- [CrossRef] [PubMed] [Google Scholar]
- The relation of hepcidin to iron disorders, inflammation and hemoglobin in chronic kidney disease. PLoS One. 2014;9:e99781.
- [CrossRef] [PubMed] [PubMed Central] [Google Scholar]
- Serum hepcidin-25 levels and anemia in non-dialysis chronic kidney disease patients: A cross-sectional study. Nephrol Dial Transplant. 2012;27:1076-83.
- [CrossRef] [PubMed] [Google Scholar]
- Serum hepcidin-25 levels in patients with chronic kidney disease are independent of glomerular filtration rate. Nephrol Dial Transplant. 2010;25:848-53.
- [CrossRef] [PubMed] [Google Scholar]
- Plasma hepcidin levels are elevated but responsive to erythropoietin therapy in renal disease. Kidney Int. 2009;75:976-81.
- [CrossRef] [PubMed] [Google Scholar]
- Hepcidin--a potential novel biomarker for iron status in chronic kidney disease. Clin J Am Soc Nephrol. 2009;4:1051-6.
- [CrossRef] [PubMed] [PubMed Central] [Google Scholar]
- Growth differentiation factor-15 and risk of CKD progression. J Am Soc Nephrol. 2017;28:2233-40.
- [CrossRef] [PubMed] [PubMed Central] [Google Scholar]
- The fascinating but deceptive ferritin: To measure it or not to measure it in chronic kidney disease? Clin J Am Soc Nephrol. 2006;1(Suppl 1):S9-18.
- [CrossRef] [PubMed] [Google Scholar]
- Hepcidin and GDF-15 are potential biomarkers of iron deficiency anaemia in chronic kidney disease patients in South Africa. BMC Nephrol. 2020;21:415.
- [CrossRef] [PubMed] [PubMed Central] [Google Scholar]
- MIC-1, a novel macrophage inhibitory cytokine, is a divergent member of the TGF-beta superfamily. Proc Natl Acad Sci U S A. 1997;94:11514-9.
- [CrossRef] [PubMed] [PubMed Central] [Google Scholar]
- Regulation of growth differentiation factor 15 expression by intracellular iron. Blood. 2009;113:1555-63.
- [CrossRef] [PubMed] [Google Scholar]
- Growth differentiation factor GDF-15 does not influence iron metabolism in stable chronic haemodialysis patients. Ann Clin Biochem. 2015;52:399-403.
- [CrossRef] [PubMed] [Google Scholar]
- Growth differentiation factor 15 production is necessary for normal erythroid differentiation and is increased in refractory anaemia with ring-sideroblasts. Br J Haematol. 2009;144:251-62.
- [CrossRef] [PubMed] [Google Scholar]


