

Translate this page into:
Prevalence and Predictors of Sarcopenia, Protein-Energy Wasting, and Sarcopenic Obesity in Patients with Chronic Kidney Disease
 , Freya Kankhara2, Parth Anilbhai Parmar1,, Mansi Mody2, Samyak Sanjaykumar Vyas2, Jainish Samirkumar Patel2
Corresponding author: Parth Anilbhai Parmar, Department of Community Medicine, Shri M P Shah Government Medical College, Jamnagar, India. E-mail: parthparmar6036@gmail.com
-
Received: ,
Accepted: ,
How to cite this article: Yogesh M, Nagda J, Kankhara F, Parmar PA, Mody M, Vyas SS, et al. Prevalence and Predictors of Sarcopenia, Protein-Energy Wasting, and Sarcopenic Obesity in Patients with Chronic Kidney Disease. Indian J Nephrol. doi: 10.25259/IJN_241_2024
Abstract
Background
Sarcopenia, sarcopenic obesity, and protein-energy wasting (PEW) are common in patients with chronic kidney disease (CKD) and are associated with adverse outcomes. This study is aimed at determining their prevalence and predictors.
Materials and Methods
This cross-sectional study included 442 adult CKD patients. Sarcopenia was defined using a modified Asian Working Group for Sarcopenia criteria, sarcopenic obesity as the coexistence of sarcopenia and obesity, and PEW according to the International Society of Renal Nutrition and Metabolism criteria.
Results
Sarcopenia prevalence was 29.9% (132 patients), with 9.5% being severe, 12.7% moderate, and 7.7% mild. Sarcopenic obesity affected 13.3% (59 patients) and PEW was noted in 27.3% (121 patients). Among sarcopenic patients, 59% met PEW criteria. Multivariate analysis identified increasing age, male sex, higher body mass index BMI, lower estimated glomerular filtration rate (eGFR), and cardiovascular disease as independent predictors of sarcopenia. Higher BMI, lower eGFR, and cardiovascular disease predicted sarcopenic obesity. For PEW, significant predictors included age, lower BMI, decreased eGFR, advanced CKD stage, cardiovascular disease, and sarcopenia.
Conclusion
Sarcopenia, sarcopenic obesity, and PEW are highly prevalent in CKD patients, with substantial overlap. Advanced age, lower kidney function, and cardiovascular disease are significant predictors across all three conditions. These findings highlight the need for comprehensive nutritional assessment and targeted interventions in CKD patients.
Keywords
Sarcopenia
Sarcopenic obesity
Protein-energy wasting
Chronic kidney disease
Prevalence
Predictors
Risk factor

Introduction
Chronic kidney disease (CKD) is a global public health concern, with a rising prevalence and significant impact on morbidity and mortality. CKD patients, particularly those undergoing hemodialysis, are at an increased risk of developing various complications, including cardiovascular events and progressive kidney function decline.1 Among these complications, nutritional and metabolic disorders such as sarcopenia, sarcopenic obesity, and protein-energy wasting (PEW) have emerged as critical issues affecting patient outcomes. Sarcopenia, characterized by progressive loss of muscle mass and strength, is a common condition among CKD patients and has been associated with adverse clinical outcomes.2 Concurrently, obesity, coexistenting with sarcopenia, is a growing concern in this population due to its potential negative impact on health outcomes.3
The complex interplay between sarcopenia, obesity, and their associated phenotypes has garnered increasing attention in recent years. Sarcopenic obesity, defined as the coexistence of sarcopenia and obesity, has been linked to an increased risk of adverse health outcomes, including cardiovascular disease, metabolic disorders, and functional impairment.4 The relationship between sarcopenia, obesity phenotypes, and their impact on cardiovascular events and CKD progression in hemodialysis patients remains not completely understood.
In addition to sarcopenia and sarcopenic obesity, PEW has been recognized as a distinct and prevalent condition in CKD patients. PEW is characterized by loss of body protein mass and fuel reserves, and it encompasses malnutrition, inflammation, and muscle wasting.5 The International Society of Renal Nutrition and Metabolism (ISRNM) has proposed diagnostic criteria for PEW, which include biochemical, body mass, muscle mass, and dietary intake parameters.5 PEW has been associated with increased morbidity, mortality, and reduced quality of life (QoL) in CKD patients.6
Several studies have investigated the associations between sarcopenia, obesity, PEW, and adverse outcomes in CKD patients, but the results have been inconsistent.7,8 Some studies have reported a protective effect of higher body mass index (BMI) on mortality, a phenomenon known as the “obesity paradox.”9 In contrast, others have suggested a detrimental impact of sarcopenia and obesity on cardiovascular events and CKD progression.10,11
Given the conflicting evidence and the potential implications for patient care, it is crucial to elucidate the relationships between sarcopenia, sarcopenic obesity, and PEW and their impact on clinical outcomes in CKD patients. Understanding these associations may have important implications for risk stratification, therapeutic interventions, and patient management in this high-risk population.
The primary objectives of this study were to estimate the prevalence of sarcopenia, sarcopenic obesity, and PEW among patients with CKD and to determine the predictors of these conditions. By examining these nutritional and metabolic disorders comprehensively, we aimed to provide valuable insights that can inform clinical practice and guide future research in managing CKD patients.
Materials and Methods
This was a cross-sectional study conducted among adult (≥18 years) CKD patients at a tertiary care center between January 2024 and April 2024. Participants were recruited using consecutive sampling, enrolling all eligible patients who presented to the center during the study period. Inclusion criteria encompassed all stable adult CKD patients aged 18 years or older, regardless of their treatment or dialysis status, who could provide written informed consent. Patients with active malignancy, acute illness, or severe cognitive impairment were excluded from the study.
The institutional review board approved the study protocol, and all participants provided written informed consent.
To assess sarcopenia, we employed the modified Asian Working Group for Sarcopenia criteria. This comprehensive approach evaluated muscle strength, muscle mass, and physical performance. Muscle strength was measured using handgrip strength, with cutoff values of <28 kg for men and <18 kg for women, indicating low strength. Physical performance was assessed using gait speed, with a cutoff of <1.0 m/s signifying low performance. We utilized bioelectrical impedance analysis (BIA) for muscle mass evaluation, with cutoff values of <7.0 kg/m2 for men and <5.7 kg/m2 for women indicating low muscle mass.11
Sarcopenia severity was categorized into three levels: mild (low muscle mass alone), moderate (low muscle strength and low muscle mass), and severe (low muscle strength, low muscle mass, and low physical performance).
Obesity was assessed using both BMI and body composition analysis. BMI categories were defined as underweight (<18.5 kg/m2), normal (18.5–24.9 kg/m2), overweight (25–29.9 kg/m2), and obese (≥30 kg/m2). Additionally, we used BIA to determine fat mass percentage, with obesity defined as >25% for men and >35% for women. Sarcopenic obesity was identified as the coexistence of sarcopenia and obesity based on fat mass percentage.12,13
PEW was diagnosed using the ISRNM criteria, encompassing biochemical, body mass, muscle mass, and dietary intake parameters. At least three out of four categories, with at least one criterion in each selected category, were required for a PEW diagnosis.5
Data collection involved a combination of questionnaires, anthropometric measurements, and clinical assessments. Demographic information, medical history, and comorbidities were gathered through standardized questionnaires. Height and weight measurements were used to calculate BMI. Muscle strength was evaluated using a Baseline® dynamometer, while gait speed was assessed over a 6 m distance, excluding acceleration and deceleration zones.
Kidney function was assessed using an estimated glomerular filtration rate (eGFR), calculated using the CKD-EPI Chronic Kidney Disease Epidemiology Collaboration (CKD-EPI) equation.14 CKD stages were defined according to the Kidney Disease: Improving Global Outcomes criteria. Cardiovascular disease presence was determined through a combination of medical record review, questionnaire-based assessment, electrocardiogram for all participants, and 2D (two-dimensional) echocardiography for those with suspected cardiovascular disease.
Sample size
The sample size was calculated using the following formula: n = (Zα/2)2 × p(1-p)/d2, where n is the required sample size, Zα/2 is the standard normal variate (1.96 at 5% type 1 error), p is the expected proportion of sarcopenia among CKD patients (assumed to be 0.21 based on previous studies), and d is the absolute precision or allowable error (0.05). The calculated sample size was 323, and after accounting for a 20% potential nonresponsive rate, the final sample size was set at 440 participants.15
Statistical analysis
Statistical analysis was performed using SPSS version 23. Descriptive statistics were used to summarize baseline characteristics, with continuous variables expressed as mean ± standard deviation and categorical variables as frequencies and percentages. Between-group differences were assessed using independent t-tests for continuous variables and chi-square tests for categorical variables. Logistic regression analyses were conducted to identify predictors of sarcopenia, sarcopenic obesity, and PEW, with multivariate models constructed to adjust for potential confounders. A p-value <0.05 was considered statistically significant for all analyses.
Results
The study population comprised 442 individuals with CKD, with a mean age of 67.8 years and a slight predominance of male participants [Table 1]. Sarcopenia was identified in a substantial proportion of the study population with varying degrees of severity [Table 2]. There was considerable overlap between sarcopenia and PEW, with more than half of sarcopenic patients also meeting the criteria for PEW.
| Characteristic | Total (N = 442) | Sarcopenic obesity (n = 132) | Non-sarcopenic obesity (n = 310) | p-value |
|---|---|---|---|---|
| Age (years), mean ± SD | 67.8 ± 11.5 | 74.2 ± 9.8 | 65.1 ± 11.2 | <0.001 |
| Sex, n (%) | 0.012 | |||
| Male | 248 (56.1%) | 86 (65.2%) | 162 (52.3%) | |
| Female | 194 (43.9%) | 46 (34.8%) | 148 (47.7%) | |
| BMI (kg/m2), mean ± SD | 26.7 ± 5.1 | 28.0 ± 4.9 | 23.5 ± 3.8 | <0.001 |
| eGFR (mL/min/1.73m2), mean ± SD | 26.2 ± 11.4 | 20.5 ± 9.2 | 28.6 ± 11.3 | <0.001 |
| CKD Stage, n (%) | <0.001 | |||
| Stage 3a | 106 (24.0%) | 18 (13.6%) | 88 (28.4%) | |
| Stage 3b | 124 (28.1%) | 30 (22.7%) | 94 (30.3%) | |
| Stage 4 | 142 (32.1%) | 52 (39.4%) | 90 (29.0%) | |
| Stage 5 | 70 (15.8%) | 32 (24.2%) | 38 (12.3%) | |
| Comorbidities, n (%) | ||||
| Diabetes | 212 (48.0%) | 75 (56.8%) | 137 (44.2%) | 0.015 |
| Hypertension | 336 (76.0%) | 111 (84.1%) | 225 (72.6%) | 0.008 |
| Cardiovascular disease | 142 (32.1%) | 58 (43.9%) | 84 (27.1%) | <0.001 |
P<0.05: significant, <0.001: highly significant, BMI: Body Mass Index, eGFR: Estimated Glomerular Filtration Rate, CKD: Chronic Kidney Disease
| Condition | Prevalence, n (%) |
|---|---|
| Sarcopenia | 132 (29.9%) |
| Severe | 42 (9.5%) |
| Moderate | 56 (12.7%) |
| Mild | 34 (7.7%) |
| Sarcopenia with protein-energy wasting (PEW) | 78 (59%) |
| Sarcopenic obesity | 59 (13.3%) |
| PEW | 121 (27.3%) |
Analysis of predictors for sarcopenia revealed several significant factors [Table 3]. After adjusting for potential confounders, advancing age, male sex, higher BMI, lower eGFR, and the presence of cardiovascular disease emerged as independent predictors of sarcopenia. While CKD stage, diabetes, and hypertension showed associations in the univariate analysis, they did not retain statistical significance in the multivariate model.
| Variable | Crude Odds Ratio (95% CI) | p-value | Adjusted Odds Ratio (95% CI) | p-value |
|---|---|---|---|---|
| Age (per year increase) | 1.06 (1.04–1.08) | <0.001 | 1.04 (1.02–1.06) | <0.001 |
| Sex (male versus female) | 1.74 (1.18–2.57) | 0.005 | 1.62 (1.05–2.51) | 0.030 |
| BMI (per unit increase) | 1.84 (1.40–3.88) | <0.001 | 1.80 (1.04–2.93) | <0.001 |
| eGFR (per mL/min/1.73m2 decrease) | 0.96 (0.95–0.98) | <0.001 | 0.98 (0.96–0.99) | 0.002 |
| CKD Stage (reference: Stage 3a) | ||||
| Stage 3b | 1.25 (0.71–2.19) | 0.442 | 1.12 (0.62–2.03) | 0.702 |
| Stage 4 | 1.76 (1.03–3.00) | 0.039 | 1.48 (0.84–2.61) | 0.176 |
| Stage 5 | 2.24 (1.22–4.11) | 0.009 | 1.82 (0.95–3.48) | 0.071 |
| Diabetes (yes versus no) | 1.64 (1.12–2.40) | 0.011 | 1.35 (0.89–2.05) | 0.158 |
| Hypertension (yes versus no) | 1.84 (1.15–2.94) | 0.010 | 1.52 (0.92–2.51) | 0.102 |
| Cardiovascular disease (yes versus no) | 2.06 (1.38–3.07) | <0.001 | 1.72 (1.12–2.64) | 0.013 |
P<0.05: significant, <0.001: highly significant, BMI: Body Mass Index, eGFR: Estimated Glomerular Filtration Rate, CKD: Chronic Kidney Disease, CI: Confidence Interval
For sarcopenic obesity, the multivariate analysis identified a distinct set of predictors [Table 4]. Higher BMI showed the strongest association, followed by the presence of cardiovascular disease and decreased eGFR. Interestingly, age and sex were not significant independent predictors of sarcopenic obesity in the adjusted model.
| Variable | Crude Odds Ratio (95% CI) | p-value | Adjusted Odds Ratio (95% CI) | p-value |
|---|---|---|---|---|
| Age (per year increase) | 1.03 (1.01–1.05) | 0.012 | 1.02 (1.00–1.04) | 0.056 |
| Sex (male versus female) | 1.35 (0.84–2.17) | 0.215 | 1.28 (0.77–2.13) | 0.340 |
| eGFR (per mL/min/1.73m2 decrease) | 0.97 (0.95–0.99) | 0.003 | 0.98 (0.96–1.00) | 0.042 |
| BMI (per unit increase) | 1.14 (1.10–3.58) | <0.001 | 1.16 (1.11–1.21) | <0.001 |
| CKD Stage (reference: Stage 3a) | ||||
| Stage 3b | 1.22 (0.61–2.44) | 0.578 | 1.10 (0.53–2.28) | 0.799 |
| Stage 4 | 1.89 (0.98–3.64) | 0.058 | 1.56 (0.78–3.12) | 0.210 |
| Stage 5 | 2.67 (1.28–5.57) | 0.009 | 2.14 (0.98–4.67) | 0.056 |
| Diabetes (yes versus no) | 1.76 (1.09–2.84) | 0.021 | 1.62 (0.97–2.71) | 0.064 |
| Hypertension (yes versus no) | 1.45 (0.82–2.56) | 0.202 | 1.33 (0.73–2.42) | 0.350 |
| Cardiovascular disease (yes versus no) | 2.18 (1.34–3.55) | 0.002 | 1.86 (1.11–3.12) | 0.018 |
P<0.05: significant, <0.001: highly significant, BMI: Body Mass Index, eGFR: Estimated Glomerular Filtration Rate, CKD: Chronic Kidney Disease, CI: Confidence Interval
Regarding PEW, the multivariate analysis revealed both similarities and differences in predictors compared to sarcopenia and sarcopenic obesity [Table 5]. Advanced age, lower BMI, decreased eGFR, and the presence of cardiovascular disease were significant predictors. Notably, CKD stage 5 and the presence of sarcopenia itself were strongly associated with PEW.
| Variable | Crude Odds Ratio (95% CI) | p-value | Adjusted Odds Ratio (95% CI) | p-value |
|---|---|---|---|---|
| Age (per year increase) | 1.04 (1.02–1.06) | 0.001 | 1.03 (1.01–1.05) | 0.012 |
| Sex (male versus female) | 1.45 (0.92–2.28) | 0.108 | 1.38 (0.85–2.24) | 0.192 |
| BMI (per unit decrease) | 1.12 (1.06–1.18) | <0.001 | 1.10 (1.04–1.16) | 0.001 |
| eGFR (per mL/min/1.73m2 decrease) | 0.95 (0.93–0.97) | <0.001 | 0.96 (0.94–0.98) | 0.001 |
| CKD Stage (reference: Stage 3a) | ||||
| Stage 3b | 1.68 (0.72–3.92) | 0.232 | 1.42 (0.58–3.46) | 0.440 |
| Stage 4 | 2.45 (1.10–5.46) | 0.028 | 1.98 (0.84–4.66) | 0.118 |
| Stage 5 | 3.86 (1.68–8.88) | 0.001 | 2.76 (1.12–6.80) | 0.027 |
| Diabetes (yes versus no) | 1.72 (1.08–2.74) | 0.023 | 1.56 (0.95–2.56) | 0.078 |
| Cardiovascular disease (yes versus no) | 1.95 (1.22–3.12) | 0.005 | 1.68 (1.02–2.76) | <0.001 |
| Sarcopenia (yes versus no) | 3.45 (2.18–5.46) | <0.001 | 2.87 (1.76–4.68) | <0.001 |
P<0.05: significant, <0.001: highly significant, BMI: Body Mass Index, eGFR: Estimated Glomerular Filtration Rate, CKD: Chronic Kidney Disease, CI: Confidence Interval
Figure 1 illustrates the prevalence of sarcopenia across different CKD stages, demonstrating a trend of increasing prevalence with more advanced stages of kidney disease.
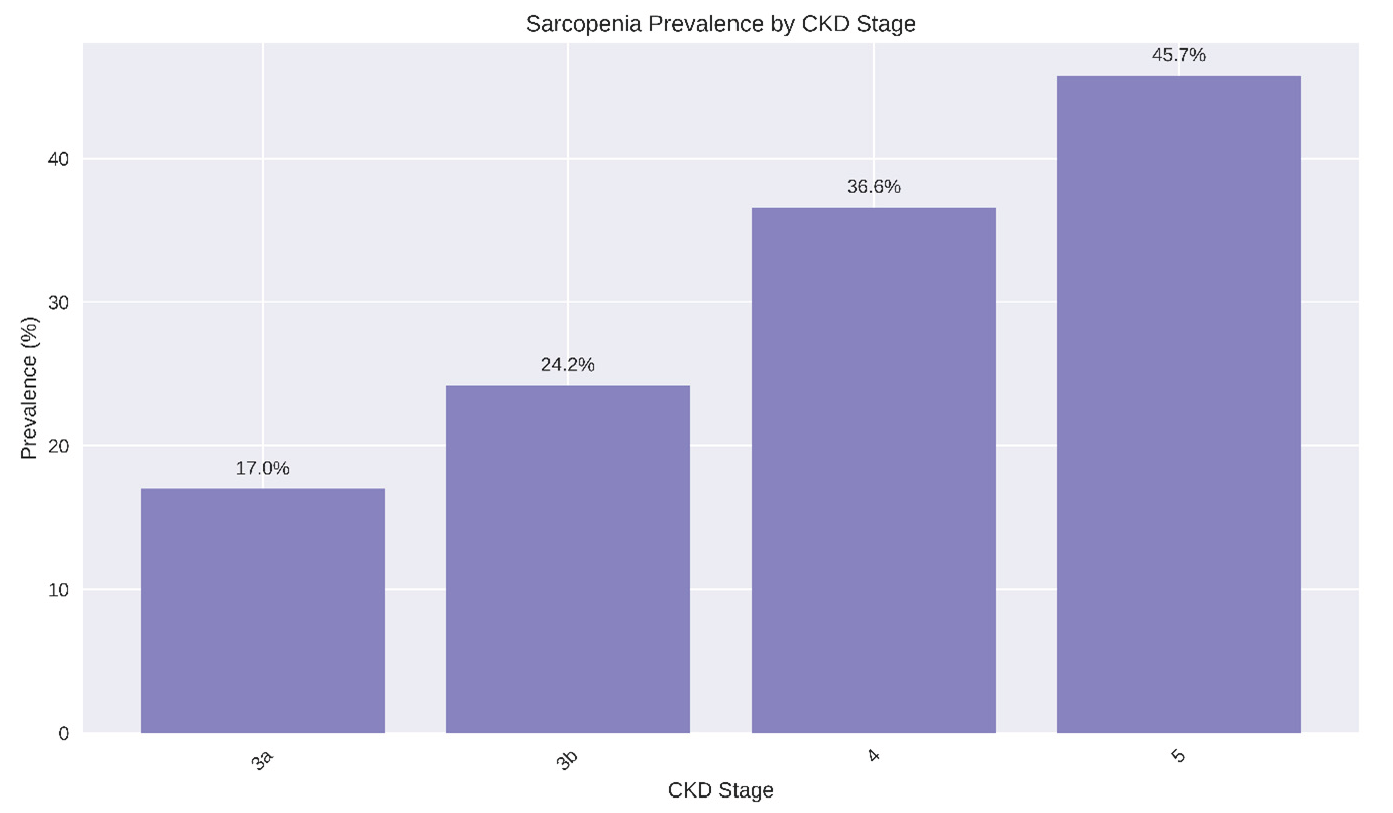
- Bar chart depicting the prevalence of sarcopenia across different CKD stages. CKD: chronic kidney disease.
Discussion
This study provides valuable insights into the prevalence and predictors of sarcopenia, sarcopenic obesity, and PEW in CKD patients. Our findings highlight the significant burden of these conditions and their complex interrelationships in the CKD population.
The prevalence of sarcopenia in our study (29.9%) aligns with previous research, which has reported rates ranging from 4% to 63% depending on CKD stage, age, and assessment methods.15–19 Our findings reinforce the high burden of sarcopenia in CKD patients and underscore the importance of routine screening. Sarcopenic obesity, present in 13.3% of our cohort, falls within the reported range of 2–23% in CKD patients.20,21 This wide variability in prevalence across studies highlights the need for standardized diagnostic criteria for sarcopenic obesity in CKD populations. The prevalence of PEW (27.3%) in our study is consistent with previous reports ranging from 11% to 54%.6 We found substantial overlap between sarcopenia and PEW, with 59% of sarcopenic patients also meeting PEW criteria. This overlap emphasizes the interconnected nature of muscle wasting and nutritional deficits in CKD patients.22,23
Our multivariate analyses revealed both shared and distinct predictors for sarcopenia, sarcopenic obesity, and PEW, providing insights into their underlying mechanisms and potential intervention strategies. Advanced age emerged as a significant predictor of sarcopenia and PEW, consistent with the well-established, age-related decline in muscle mass and function.24 Male sex was associated with increased odds of sarcopenia, aligning with known gender differences in muscle composition and metabolism.25 However, sex was not a significant predictor of sarcopenic obesity or PEW, suggesting that other factors may play more dominant roles in these conditions.
Higher BMI was associated with increased odds of both sarcopenia and sarcopenic obesity. This paradoxical relationship highlights the complex interplay between adiposity and muscle health in CKD patients.26,27 Conversely, lower BMI was a predictor of PEW, reflecting the role of overall body mass in nutritional status.5 Decreased eGFR was a consistent predictor across all three conditions, underscoring the impact of declining kidney function on muscle and nutritional health. This association likely reflects the accumulation of uremic toxins and metabolic derangements accompanying CKD progression.27
Cardiovascular disease emerged as a significant predictor for all three conditions. This finding aligns with previous studies linking cardiovascular comorbidities to adverse nutritional and functional outcomes in CKD patients.28,29 Chronic inflammation, oxidative stress, and insulin resistance associated with cardiovascular disease may contribute to muscle wasting and nutritional deficits.30,31
Our study reveals a strong association between sarcopenia and PEW in CKD patients. Previous studies support this interrelationship. Isoyama et al. found that sarcopenia was associated with increased mortality in dialysis patients, and this association was even stronger in patients with concurrent PEW.22 Sarcopenia and PEW often coexist in CKD patients and they are associated with worse clinical outcomes, including worsening QoL and higher hospitalization and mortality rates.23
The substantial overlap between sarcopenia and PEW suggests that interventions targeting one condition may have beneficial effects on the other. Potential strategies supported by current evidence include structured exercise programs, particularly resistance training, to improve muscle mass and strength;32 nutritional support, including adequate protein and caloric intake, and targeted supplementation (e.g., vitamin D, omega-3 fatty acids);33,34 and aggressive management of comorbidities, especially cardiovascular disease, to mitigate their impact on nutritional and functional status.
This study has several limitations. The cross-sectional design precludes causal inferences. Longitudinal studies are needed to establish the temporal sequence of events and to determine whether the identified risk factors are causally related to the development of sarcopenia, sarcopenic obesity, and PEW in CKD patients. Additionally, we did not assess potential confounders such as physical activity levels, dietary patterns, and inflammatory markers, which may influence the development of these conditions. The use of BIA for body composition assessment, while practical for clinical settings, may have limitations in accuracy compared to gold standard methods such as dual-energy X-ray absorptiometry (DXA).14 Furthermore, this study was conducted at a single center, which may limit the generalizability of the findings to other populations or healthcare settings.
Future research directions should address these limitations and build upon our findings. Longitudinal studies are needed to elucidate the temporal relationships between predictors and outcomes and to assess the long-term impact of sarcopenia, sarcopenic obesity, and PEW on CKD progression, cardiovascular events, and mortality. Such studies should incorporate more comprehensive assessments of potential confounding factors, including detailed measures of physical activity, dietary intake, and inflammatory biomarkers. Intervention studies are crucial to evaluate the efficacy of various strategies in preventing or reversing these conditions in CKD patients. These may include randomized controlled trials of exercise programs, nutritional interventions, and targeted therapies aimed at preserving muscle mass and improving nutritional status.32–34 Future research should also explore the use of more advanced imaging techniques, such as DXA or computed tomography, to assess body composition with greater precision. Investigation of CKD-specific factors, such as uremic toxins and oxidative stress, may provide deeper insights into the pathophysiology of sarcopenia, sarcopenic obesity, and PEW in the context of kidney disease.27,30,31 Studies examining the economic impact of these conditions and the cost-effectiveness of various screening and intervention strategies would be valuable in informing healthcare policy and resource allocation.
Conclusion
Sarcopenia, sarcopenic obesity, and PEW are highly prevalent and interconnected conditions in CKD patients. Advanced age, impaired kidney function, and cardiovascular disease emerge as shared risk factors, highlighting the complex interplay between these conditions and CKD progression. Comprehensive assessment of nutritional status, body composition, and physical function should be integrated into routine care for CKD patients. Future research focusing on targeted interventions and longitudinal outcomes will be crucial in improving the management of these conditions and ultimately the overall health of CKD patients.
Conflicts of interest
There are no conflicts of interest.
References
- Association between sarcopenia and clinical outcomes in chronic kidney disease patients: A systematic review and meta-analysis. Clin Nutr. 2022;41:1131-40.
- [CrossRef] [PubMed] [Google Scholar]
- Survival advantages of obesity in dialysis patients. Am J Clin Nutr. 2005;81:543-54.
- [CrossRef] [PubMed] [Google Scholar]
- Sarcopenic obesity: Definition, cause and consequences. Curr Opin Clin Nutr Metab Care. 2008;11:693-700.
- [CrossRef] [PubMed] [PubMed Central] [Google Scholar]
- Latest consensus and update on protein-energy wasting in chronic kidney disease. Curr Opin Clin Nutr Metab Care. 2015;18:254-62.
- [CrossRef] [PubMed] [PubMed Central] [Google Scholar]
- The global prevalence of protein-energy wasting in kidney disease: a meta-analysis of contemporary observational studies from the international society of renal nutrition and metabolism. J Ren Nutr. 2018;28:380-92.
- [CrossRef] [PubMed] [Google Scholar]
- Sarcopenia and cardiovascular diseases: A systematic review and meta-analysis. J Cachexia Sarcopenia Muscle. 2023;14:1183-98.
- [CrossRef] [PubMed] [PubMed Central] [Google Scholar]
- Estimated glomerular filtration rate and albuminuria for prediction of cardiovascular outcomes: A collaborative meta-analysis of individual participant data. Lancet Diabetes Endocrinol. 2015;3:514-525.
- [CrossRef] [PubMed] [PubMed Central] [Google Scholar]
- The ‘obesity paradox’ may not be a paradox at all. Int J Obes. 2017;41:1162-3. https://doi.org/10.1038/ijo.2017.99
- [Google Scholar]
- Relationship between sarcopenia and cardiovascular diseases in the elderly: an overview. Front Cardiovasc Med. 2021;8 https://doi.org/10.3389/fcvm.2021.743710
- [CrossRef] [Google Scholar]
- Asian working group for sarcopenia: 2019 consensus update on sarcopenia diagnosis and treatment. J Am Med Dir Assoc. 2020;21:300-07.e2.
- [CrossRef] [PubMed] [Google Scholar]
- Obesity: Preventing and managing the global epidemic. Report of a WHO Consultation. World Health Organ Tech Rep Ser. 2000;894:i-xii,1–253.
- [PubMed] [Google Scholar]
- Measuring adiposity in patients: The utility of body mass index (BMI), percent body fat, and leptin. PLoS One. 2012;7:e33308.
- [CrossRef] [PubMed] [PubMed Central] [Google Scholar]
- A new equation to estimate glomerular filtration rate. Ann Intern Med. 2009;150:604.
- [CrossRef] [PubMed] [PubMed Central] [Google Scholar]
- Sarcopenia in non-dialysis chronic kidney disease patients: Prevalence and associated factors. Front Med. 2022;9 https://doi.org/10.3389/fmed.2022.854410
- [CrossRef] [Google Scholar]
- Relationship between chronic kidney disease and sarcopenia. Sci Rep. 2021;11 https://doi.org/10.1038/s41598-021-99592-3
- [CrossRef] [PubMed] [PubMed Central] [Google Scholar]
- Sarcopenia in chronic kidney disease: What have we learned so far? J Nephrol. 2020;34:1347-72.
- [CrossRef] [PubMed] [PubMed Central] [Google Scholar]
- Sarcopenia in chronic kidney disease: A scoping review of prevalence, risk factors, association with outcomes, and treatment. Calcif Tissue Int. 2021;110:1-31.
- [CrossRef] [PubMed] [PubMed Central] [Google Scholar]
- Prevalence of sarcopenia in patients with chronic kidney disease: A global systematic review and meta-analysis. J Cachexia Sarcopenia Muscle. 2024;15:501-12.
- [CrossRef] [PubMed] [PubMed Central] [Google Scholar]
- Sarcopenia and sarcopenic obesity in chronic kidney disease: Update on prevalence, outcomes, risk factors, and nutrition treatment. Curr Opin Clin Nutr Metab Care. 2022;25:371-7.
- [CrossRef] [PubMed] [Google Scholar]
- Sarcopenic obesity in chronic kidney disease: Challenges in diagnosis using different diagnostic criteria. Med Princ Pract. 2021;30:477-86.
- [CrossRef] [PubMed] [PubMed Central] [Google Scholar]
- Comparative associations of muscle mass and muscle strength with mortality in dialysis patients. Clin J Am Soc Nephrol. 2014;9:1720-8.
- [CrossRef] [PubMed] [PubMed Central] [Google Scholar]
- Sarcopenia in chronic kidney disease: What have we learned so far? J Nephrol. 2021;34:1347-72.
- [CrossRef] [PubMed] [PubMed Central] [Google Scholar]
- Invited review: Aging and sarcopenia. J Appl Physiol. 2003;95:1717-27.
- [CrossRef] [PubMed] [Google Scholar]
- Greater adipose tissue infiltration in skeletal muscle among older men of African ancestry. J Clin Endocrinol Metab. 2009;94:2735-42.
- [CrossRef] [PubMed] [PubMed Central] [Google Scholar]
- Neutrophil-to-lymphocyte ratio is associated with sarcopenia risk in overweight maintenance hemodialysis patients. Sci Rep. 2024;14 https://doi.org/10.1038/s41598-024-54056-2
- [CrossRef] [Google Scholar]
- Sarcopenic obesity and its relation with muscle quality and mortality in patients on chronic hemodialysis. Clin Nutr. 2023;42:1359-68.
- [CrossRef] [PubMed] [Google Scholar]
- Sarcopenia in patients with chronic kidney disease not yet on dialysis: Analysis of the prevalence and associated factors. Plos One. 2017;12:e0176230.
- [CrossRef] [PubMed] [PubMed Central] [Google Scholar]
- Sarcopenia and type 2 diabetes mellitus: A bidirectional relationship. Diabetes, Metabolic Syndrome and Obesity: Targets and Therapy. 2019;12:1057-72.
- [CrossRef] [PubMed] [PubMed Central] [Google Scholar]
- Sarcopenia and cachexia: the adaptations of negative regulators of skeletal muscle mass. J Cachexia Sarcopenia Muscle. 2012;3:77-94.
- [CrossRef] [PubMed] [PubMed Central] [Google Scholar]
- Obesity in CKD—what should nephrologists know? J Am Soc Nephrol. 2013;24:1727-36.
- [CrossRef] [PubMed] [PubMed Central] [Google Scholar]
- Resistance exercise interventions for sarcopenia and nutritional status of maintenance hemodialysis patients: A meta-analysis. Peer J. 2024;12:e16909.
- [CrossRef] [PubMed] [PubMed Central] [Google Scholar]
- Nutritional strategies to prevent muscle loss and sarcopenia in chronic kidney disease: What do we currently know? Nutrients. 2023;15:3107.
- [CrossRef] [PubMed] [PubMed Central] [Google Scholar]
- The role of omega-3 in the prevention and treatment of sarcopenia. Aging Clin Exp Res. 2019;31:825-836.
- [CrossRef] [PubMed] [PubMed Central] [Google Scholar]


