

Translate this page into:
Serum Vitamin D and Osteocalcin for Assessment of Bone Mineral Metabolism: A Comparison of Children with Steroid-Sensitive and Resistant Nephrotic Syndrome

Corresponding author: Mukta Mantan, Department of Pediatrics, Maulana Azad Medical College and associated Lok Nayak Hospital, New Delhi, India. E-mail: muktamantan@hotmail.com
-
Received: ,
Accepted: ,
How to cite this article: Anirudh AT, Arya Y, Mantan M, Dabas A, Mahajan B. Serum Vitamin D and Osteocalcin for Assessment of Bone Mineral Metabolism: A Comparison of Children with Steroid-Sensitive and Resistant Nephrotic Syndrome. Indian J Nephrol. doi: 10.25259/IJN_113_2024
Abstract
Background
Long-term corticosteroid use decreases osteoblastic activity and bone matrix formation. Osteocalcin (OC), a marker of bone turnover, is more sensitive than alkaline phosphatase in indicating bone matrix synthesis.
Materials and Methods
The cross-sectional study was done from January to September 2021; a total of 62 (40 males, 22 females) children (2–18 years) with nephrotic syndrome in disease remission were enrolled. Thirty-two had steroid-sensitive nephrotic syndrome (SSNS), and 30 had steroid-resistant nephrotic syndrome (SRNS). Children who had received daily steroids or high doses of vitamin D within the previous three months were excluded. The primary objective of this study was to assess bone mineral metabolism by measuring vitamin D, parathyroid hormone (PTH), and osteocalcin levels.
Results
In children with SSNS, 46.8% had vitamin D insufficiency, 21.9% vitamin D deficiency, and median vitamin D levels were 28.4 ng/mL; in the SRNS group, 40% had insufficiency, 33.4% deficiency, and vitamin D levels were 26.6 ng/mL. The median steroid dose used in the previous 6 months was significantly higher in the SRNS patients, 0.63 (0.35, 0.77) mg/kg on alternate days compared to SSNS, 0.50 (0.32, 0.60) mg/kg (p = 0.02). Median serum OC levels were lower in SRNS 20.4 (10.8, 33.5) ng/mL compared to SSNS, 35.6 (22.5, 42.7) ng/mL (p = 0.004).
Conclusion
Bone metabolism is negatively affected in children with nephrotic syndrome, especially in those with SRNS and must continue to be vitamin D insufficient despite routine supplementation; serum OC appears to be a promising marker for this evaluation.
Keywords
Osteocalcin
Bone mineral metabolism
Steroid-sensitive nephrotic syndrome
Steroid-resistant nephrotic syndrome
Vitamin D deficiency

Introduction
Corticosteroids are the backbone of therapy for childhood nephrotic syndrome; however, their long-term use leads to complications like reduced bone formation through the decrease in osteoblast proliferation and decreased synthesis of bone matrix along with reduced 25(OH) D levels due to urinary loss of vitamin D-binding protein.1-3 Monitoring of bone metabolism using biochemical parameters chiefly depends upon the measurement of enzymes and proteins released during bone formation and degradation products produced during bone resorption like C and N terminal telopeptides of type 1 collagen, alkaline phosphatase, osteocalcin (OC), N and C terminal propeptides of type 1 collagen and pyridinoline and deoxy-pyridinoline.4
Osteocalcin (OC) expressed by the osteoblasts has emerged as a molecule of interest in basic and translational skeletal biology and seems to play an important role in bone endocrinology.5 It is a non-collagenous matrix protein with a 49 amino acid glutamate-rich structure and a molecular weight of about 5800 kDa. After protein synthesis, the mature osteocalcin peptide is spliced and γ-carboxylated, increasing its affinity towards bone and the extracellular matrix; however, in the osteoclast compartment, it gets decarboxylated due to low pH, which in turn reduces its affinity and leads to release into the blood.5 Due to this OC is widely accepted as a marker of bone formation and OC concentrations seem to correlate well with direct measurements of bone formation by histomorphometry.6,7
While there are many studies suggesting that vitamin D deficiency is common in children with nephrotic syndrome and steroids do affect the bone mineral status, there is a lack of literature regarding the impact of steroids on bone mineral turnover in such children.3 Also, most studies have included patients in disease relapse which could have increased the numbers with vitamin D deficiency due to urinary losses of vitamin D binding protein.8 This study was planned to identify any abnormality of bone metabolism in children with nephrotic syndrome during disease remission by using parameters like serum vitamin D, parathyroid hormone (PTH), and OC levels.
Materials and Methods
This cross-sectional study was done in the Department of Pediatrics of a tertiary care teaching institution from January to September 2021. Ethical approval was obtained from the institution’s ethics committee, and written informed consent or assent was taken from all caregivers or patients. The study enrolled children and adolescents aged 2–18 years who were in disease remission [both steroid-sensitive nephrotic syndrome (SSNS) and steroid-resistant nephrotic syndrome (SRNS)], with a minimum disease duration of 6 months. Exclusion criteria included children with a documented history of receiving vitamin D doses of 60,000 IU or more in the past three months, congenital nephrotic syndrome, or chronic kidney disease.
A detailed history included timing of onset, duration, type of nephrotic syndrome, treatment given, and biopsy findings; a history of the presence of myalgias, bone pains, and fractures was elicited. A complete physical examination (general and systemic), and anthropometry (weight, height, weight for height, and body mass index) were done for all patients and quantification of proteinuria was done by dipstick. Cumulative prednisolone doses used in the last 6 months were recorded and calculated according to the body weight.
Standard definitions were applied to classify the course of nephrotic syndrome. Children who experienced two or more relapses within the first six months of onset or three or more relapses within any 12-month period were categorized as having frequently relapsing nephrotic syndrome (FRNS). Steroid dependence nephrotic syndrome (SDNS) was defined as the occurrence of two consecutive relapses during alternate-day steroid therapy or within 2 weeks of its cessation in the absence of infections. Infrequently relapsing nephrotic syndrome (IFRNS) was diagnosed in children with fewer than two relapses within the first 6 months of onset or fewer than three relapses within any 12 months period. Steroid resistance (SRNS) was defined as failure to achieve remission after 4 weeks of daily steroid therapy (2 mg/kg/day or 60 mg/m2/day of prednisolone).
For biochemical investigations, two blood samples of 4 mL each was drawn after aseptic precautions; the first sample was processed for kidney function tests, serum calcium, phosphate, alkaline phosphatase, serum albumin, and cholesterol on the same day by a fully automated clinical chemistry analyzer. The second sample was centrifuged and stored at -20°C for estimation of 25-hydroxyvitamin D, PTH, and serum OC levels. Vitamin D and PTH levels were estimated by immunoassay method using Vitros 5600 analyzer and serum OC levels by electrochemiluminescence method by the Roche Diagnostic Cobas e411 Immunoassay System. Proteinuria was estimated using a urine dipstick and compared with serum albumin for patients to confirm remission. Complete remission was defined as urine albumin nil or trace in three consecutive morning samples. Partial remission was defined as persistent urinary dipstick protein between +1 and +2 and serum albumin levels above 2.5 gm/dL and absence of edema.
The reference ranges of vitamin D were as per recommendations by the Endocrine Society.9 A value of 25 (OH)D < 20 ng/mL was considered deficient, 20 to <30 ng/mL insufficient, and values ≥30 ng/mL sufficient. Plasma PTH was estimated along with vitamin D and considered normal if within 10–65 pg/mL. For the normative values of OC, Mayo Clinic laboratories’ age-related references were used. As these values are age-dependent, the objective was primarily to compare values between SSNS and SRNS groups instead of looking at individual values. The primary assumption was that these levels would be normal in SSNS patients and more likely to be altered in SRNS who receive corticosteroids for longer disease duration.
Sample size
Based on the results of a previous study,6 we took an expected prevalence of 62.5% for vitamin D deficiency among children with nephrotic syndrome and with 10% precision and 95% confidence level, the sample size calculated was 90. Due to the COVID pandemic during the study period, we could enroll 62 patients (32 SSNS and 30 SRNS); with this sample size, we achieved a precision of 12% with a 95% confidence level.
Statistical analysis
Data entry was done using a Microsoft Excel spreadsheet and analyzed using descriptive statistics and SPSS version 25. Mean and standard deviation (SD) or median and interquartile range were calculated for continuous variables and the Student t-test or Mann-Whitney U test was applied for comparisons between mean and median, respectively. Categorical data were expressed as frequency and percentages and statistical differences between the proportions were tested by the chi-square test or Fisher’s exact test. For all comparisons, a 5% probability (p less than 0.05) was considered significant. A multivariate regression was performed to study the variables that affected serum OC levels in subjects without vitamin D deficiency and sufficiency. A linear regression analysis was further performed to analyze the independent factors that predicted serum OC levels using the forward method.
Results
Of the 62 (64.5% males) children enrolled, 30 had SRNS and 32 SSNS disease courses. The median (IQR) age of enrollment was 9 (6, 12) years; 7.5 (5.3, 11) years for SSNS and 10 (7, 12) years for SRNS. Amongst SSNS, 13 (20.9%) children had FRNS and 10 (16.1%) had IFRNS, while 9 (14.5%) had SDNS course. The renal biopsies of SRNS (n=30) patients showed minimal change in disease in 60%, FSGS in 30%, C3GN in 6.3%, and MesPGN in 3.3%. The median duration of onset of nephrotic syndrome for all patients was 4 (2, 7.5) years. The study population’s median weight, height, and BMI SDS were -0.53, -1.05, and -0.075, respectively.
Among the 30 SRNS patients who were enrolled, 19 (63.3%) received cyclosporine and 11 (36.7%) received tacrolimus; about 63.6% of the patients had received cyclosporine and tacrolimus for more than 2 years at the time of evaluation. All patients with SRNS were receiving low-dose prednisolone at enrollment. A comparison of baseline clinical and biochemical parameters between SSNS and SRNS patients is provided in Table 1. The median steroid doses received in the last 6 months were higher in SRNS compared to SSNS (0.63 vs. 0.5 mg/kg on alternate days; p = 0.02).
| Parameter |
SSNS (n = 32) Median (IQR) |
SRNS (n = 30) Median (IQR) |
p value |
|---|---|---|---|
| Age at enrollment (years) | 7.5 (5.2, 11) | 10 (7, 12) | <0.006 |
| Age of disease onset (years) | 3.0 (2, 6.75) | 3.0 (2, 4) | 0.73 |
| Disease duration (years) | 3 (2, 5) | 6 (2.5, 9.0) | 0.167 |
| Type of disease N (%) | SDNS 9 (28.1%), FRNS 13 (40.6%), IFRNS 10 (31.3%) | 30 (100%), Initial resistance, 10 (33.3%) late resistance, 20 (66.7%) | |
| Steroid dose in last 6 months (mg/kg/day) | 0.50 (0.32, 0.60) | 0.63 (0.35, 0.77) | 0.02* |
| Serum creatinine (mg/dL) | 0.3 (0.2, 0.3) | 0.3 (0.2, 0.4) | 0.25 |
| Total protein (g/dL) | 5.35 (4.6, 6.5) | 5.15 (4.47, 5.8) | 0.121 |
| Serum albumin (g/dL) | 3.15 (2.8, 4.0) | 3.1 (2.8, 3.5) | 0.054 |
| Serum cholesterol (mg/dL) | 144 (124, 176) | 194 (147.2, 301.5) | 0.026* |
| Serum calcium (mg/dL) | 9.2 (8.8, 9.6) | 9.1 (8.6, 9.3) | 0.69 |
| Serum phosphate (mg/dL) | 4.6 (4.1, 5.4) | 4.7 (3.9, 5) | 0.173 |
| Serum ALP (mg/dL) | 156.5 (115.2, 190.5) | 139 (111.7, 186.5) | 0.004* |
| Serum osteocalcin (ng/dL) | 35.6 (22.5, 42.7) | 20.4 (10.8, 33.5) | 0.004* |
| PTH levels (pg/mL) | 38.4 (27.5, 58.4) | 56.1 (45.6, 83.7) | 0.009* |
| 25(OH)D levels (ng/mL) | 18.04 (13.8, 27.5) | 18.65 (15.05, 29.7) | 0.011* |
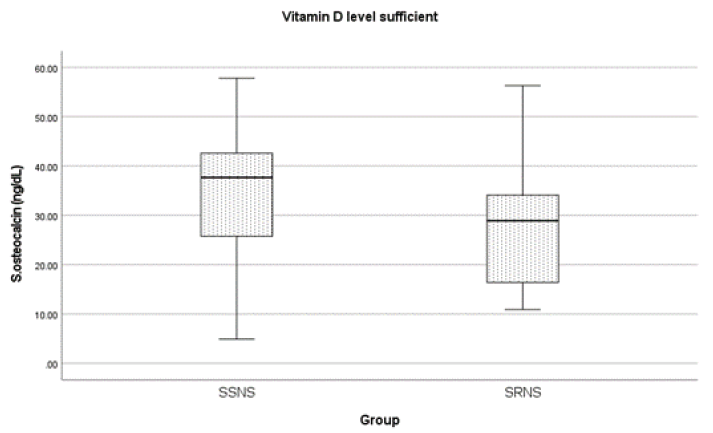
Among all children included in this study, 42 (67.7%) had vitamin D deficiency and 14 (22.5%) had insufficiency. Amongst SSNS, 8 (25%) patients had insufficiency of vitamin D, 22 (68.8%) patients had a deficiency, and the median (IQR) vitamin D levels were 18.04 (13.8, 27.5) ng/mL. Among children with SRNS, 12 (40%) patients had insufficiency, 10 (33.4%) had a deficiency of vitamin D levels, and median vitamin D levels were 18.65 (15.05, 29.7) ng/mL. The median serum OC levels were higher for SSNS than SRNS (35.6 vs. 20.4 ng/mL) and the difference was statistically significant (p < 0.004). Further 6 (18.8%) children in SSNS and 9 (30%) amongst SRNS had OC levels below the lower limit of normal for that age and gender and all values were below 15 ng/mL. Also, the median PTH values were higher in SRNS compared to SSNS (56.1 vs. 38.4) pg/mL (p = 0.009). Further, a comparison of serum OC levels amongst vitamin D sufficient and deficient patients showed that serum OC levels were higher among vitamin D sufficient patients and this was statistically significant (p < 0.002) [Table 2]. While 11 (17.7%) patients had hypocalcemia; among children with SSNS 5 (15.6%) had hypocalcemia, whereas 6 (20%) children with SRNS had hypocalcemia. Because of the observation regarding significant vitamin D deficiency in this cohort, we analyzed the OC levels in SSNS and SRNS in those with 25-OHD levels of 20 ng/mL or more and the levels were higher in those with SSNS [Figure 1].
| Osteocalcin levels | Vit D Deficiency (ng/dL) | Vit D sufficiency (ng/dL) | p value |
|---|---|---|---|
| Among all patients | 28.6 (12.2, 37.2) | 36.3 (24.3, 44.8) | 0.002 |
| SSNS | 29.7 (16.2, 39.3) | 41.8 (29.4, 54.5) | 0.018 |
| SRNS | 22.2 (11.2, 33.5) | 27.4 (15.2, 37.1) | 0.013 |
- Comparison of osteocalcin levels in vitamin D sufficient patients, SSNS: steroid sensitive nephrotic syndrome, SRNS: steroid resistant nephrotic syndrome
A correlation of various biochemical parameters was done with serum OC levels of patients with SSNS and SRNS. Only serum calcium (r = 0.494; p = 0.005) and 25-hydroxy vitamin D3 (r = 0.447; p = 0.002) levels showed a significant positive correlation in SSNS patients [Table 3] with only a moderate correlation in SRNS.
| Parameters | Pearson correlation coefficient (r) | |||
|---|---|---|---|---|
| SSNS | p value | SRNS | p value | |
| Age | -0.205 | 0.260 | 0.036 | 0.84 |
| Duration of the disease | 0.170 | 0.352 | 0.124 | 0.521 |
| Age of onset | 0.196 | 0.282 | -0.026 | 0.894 |
| Height (cm) | -0.246 | 0.176 | 0.035 | 0.856 |
| Weight (kg) | -0.314 | 0.080 | -0.076 | 0.690 |
| BMI | -0.301 | 0.095 | -0.205 | 0.277 |
| eGFR | 0.085 | 0.643 | 0.241 | 0.227 |
| Urea | -0.166 | 0.381 | -0.137 | 0.470 |
| Creatinine | 0.059 | 0.749 | 0.032 | 0.412 |
| Total protein | 0.398 | 0.024* | -0.244 | 0.194 |
| Serum albumin | 0.416 | 0.018* | 0.070 | 0.715 |
| Alkaline phosphatase | 0.114 | 0.536 | 0.145 | 0.446 |
| Calcium | 0.494 | 0.004* | -0.047 | 0.806 |
| Phosphate | 0.015 | 0.936 | 0.180 | 0.342 |
| 25-Hydroxy Vitamin D3 | 0.447 | 0.002* | 0.128 | 0.534 |
| PTH | 0.229 | 0.207 | -0.139 | 0.471 |
| Dose of prednisolone | -0.075 | 0.684 | -0.049 | 0.431 |
A multivariate regression was performed to study the variables that affected serum OC levels in subjects without vitamin D deficiency (≥12 ng/mL). The model included age, steroid dose (mg/kg/day), serum calcium, phosphorus, and vitamin D levels. The model predicted a 40% variation in osteocalcin levels (R2 = 0.4; p = 0.043). The unstandardized coefficients (95% CI) are shown in Table 4. A linear regression analysis was further performed to analyze the independent factors that predicted serum OC levels using the forward method (R2 = 0.216, p = 0.014) that showed only serum calcium as the significant predictor of serum OC levels (B coefficient, 95% CI as 3.83, 2.18–17.96; p = 0.014).
| Parameters | B (95% CI) | p value |
|---|---|---|
| Age | −0.021 (−1.62, 1.57) | 0.979 |
| Serum calcium | 5.71 (−3.104, 14.53) | 0.192 |
| Serum phosphorus | 3.72 (−0.67, 14.80) | 0.071 |
| Serum 25-OHD | 0.617 (−0.285, 2.28) | 0.121 |
| Steroid dose | 9.32 (−7.51, 31.24) | 0.217 |
B: regression coefficient, CI: confidence interval, 25-OHD: 25 hydroxy vitamin D
Discussion
We assessed the bone mineral status of children with SSNS and SRNS during disease remission. We evaluated various baseline characteristics and routine biochemical investigations along with serum OC, vitamin D, and PTH levels. The sex ratio in our study was similar to what was observed in previous studies10 as was the early/late resistance pattern.11 This could be due to our inclusion criteria of complete remission at enrollment and the response to therapy being better in late resistance.
Long-term use of steroids in children with nephrotic syndrome may affect bone turnover and mineralization both due to steroid therapy and biochemical changes consequent to proteinuria. Children with SRNS have a protracted clinical course and may have long-standing proteinuria; suboptimal 25(OH) D concentrations due to urinary loss of vitamin D-binding protein may lead to secondary hyperparathyroidism, and metabolic bone disease notably rickets and osteomalacia.5 In this study, we specifically enrolled children in disease remission so that the effect of proteinuria would not be a factor for vitamin D deficiency and primarily the effects of steroids could be studied.
As a policy, all patients on steroid therapy in our unit are administered maintenance doses of calcium and vitamin D during treatment and are supplemented with vitamin D doses of 60,000 IU once every 6 months. In the present study, 90.3% of all children had either vitamin D deficiency or insufficiency (93.8% in SSNS and 86.7% in SRNS) with 67.7% having deficiency despite being in disease remission and receiving supplemental doses of vitamin D, which reiterates the suppressant role of steroids in vitamin D and bone mineral metabolism. Our findings are similar to another study where they measured levels of 25 OH vitamin D in children with nephrotic syndrome in disease remission and showed that 68% of children had vitamin D deficiency.12 Also, a multicenter longitudinal study by the Midwest Paediatric Nephrology Consortium in children with idiopathic NS assessed 25(OH)D levels at diagnosis and after 12 weeks of steroid therapy. All of the enrolled children had 25(OH)D <20 ng/mL at diagnosis and 53% of the children had vitamin D deficiency at follow-up, indicating that urinary losses of vitamin D to contribute significantly to the deficiency.3 This urinary loss was non-contributory in our study as all children were in disease remission.
A retrospective study of 48 children with Duchenne muscle dystrophy revealed a high risk of fractures and 69% were on chronic steroid therapy. Despite vitamin D supplementation, 38% remained deficient.13 A murine study model has shown that corticosteroids alter intestinal calcium transport by stimulating further metabolism of 1,25-dihydroxyvitamin D(3) to a more polar, biologically inactive metabolite that is unable to absorb calcium from the gut.14 However, as the study was done during the COVID pandemic there is a possibility of reduced exposure to sunlight as most children with nephrotic syndrome were following the shielding guidelines recommended by their treating pediatricians and pediatric nephrologists. This could have additionally contributed to the higher proportion of vitamin D deficiency and insufficiency seen in this study.
Osteocalcin is the most abundant non-collagenous protein of bone matrix which is specifically produced by osteoblasts and appears to regulate bone mineralization. It is a good marker of bone formation and hence can be used as a sensitive indicator of the inhibitory effects of corticosteroids. Some animal studies have suggested the role of OC in supporting bone strength by improving bone quality through the laying of biological apatite parallel to the collagen fibrils.15 In the present study, we compared the median serum OC levels between SSNS and SRNS patients and they were 35.6 ng/dL in SSNS and 20.4 ng/dL in SRNS patients (p < 0.004) indicating that serum OC levels were more suppressed in children with SRNS disease. The median OC levels were then compared between vitamin D deficient and vitamin D sufficient patients and it was seen that levels were higher among vitamin D sufficient patients (36.3 ng/dL) than vitamin D insufficient patients (28.6 ng/dL), and was statistically significant (p < 0.002). This comparison was also done separately in SSNS and SRNS groups and the OC levels were markedly suppressed in vitamin D-sufficient SRNS patients (27.4 ng/dL) compared to vitamin D-sufficient SSNS patients (41.8 ng/dL). This is surprising as OC levels are seen to rise in children with rickets and vitamin D deficiency is a trigger for increased serum OC levels. This possibly points towards the role of corticosteroids in suppressing the bone laydown activity in these patients. In a similar study on children with nephrotic syndrome enrolled before and after treatment with corticosteroids, the baseline OC levels were within the normal range and decreased significantly after 12 weeks of treatment with corticosteroids when compared with pre-treatment levels and those in healthy children.16
Glucocorticoid therapy has detrimental effects on bone health and concurrent vitamin D deficiency worsens the condition in children with nephrotic syndrome. Steroid therapy also suppresses the response to decreased vitamin D levels that is expected to be mounted by increased bone turnover as shown by low serum OC levels in the present study which were lower in both vitamin D sufficient and insufficient patients than the normal population of similar age. Maintaining bone health is of utmost importance in children of growing age to achieve the desired height and strength. While there are studies on vitamin D deficiency during periods of relapses of nephrotic syndrome, data during disease remission and while on prolonged periods of steroid therapy especially in steroid-resistant disease is lacking.
The strength of the present study is that it is the first study on bone biomarkers using OC in children with nephrotic syndrome in disease remission when acute biochemical changes would not be confounding. However, a limitation is a smaller number of enrolled patients than the calculated sample size due to the ongoing COVID pandemic during the study period. We suggest similar studies in the future with the possible use of more bone biomarkers in a larger sample of children with nephrotic syndrome for generalization of the results.
Conclusion
Bone metabolism is adversely affected in children with nephrotic syndrome especially in those with SRNS disease when compared to SSNS and a majority of the children continue to be vitamin D insufficient despite routine supplementation. Also serum OC, a marker of bone osteoblastic activity was suppressed in patients, especially those with SRNS disease, and appears to be a promising marker for the evaluation of bone health in them. More studies in a larger number of patients, along with healthy controls, are recommended to confirm these findings.
Conflicts of interest
There are no conflicts of interest.
References
- Steroid sensitive nephrotic syndrome: Revised guidelines. Indian Pediatr. 2021;58:461-81.
- [CrossRef] [PubMed] [PubMed Central] [Google Scholar]
- Vitamin D in incident nephrotic syndrome: A midwest pediatric nephrology consortium study. Pediatr Nephrol J. 2016;31:465-72.
- [CrossRef] [Google Scholar]
- IPNA clinical practice recommendations for the diagnosis and management of children with steroid-resistant nephrotic syndrome. Pediatr Nephrol. 2020;35:1529-61.
- [CrossRef] [PubMed] [PubMed Central] [Google Scholar]
- Osteocalcin – A versatile bone-derived hormone. Front Endocrinol (Lausanne). 2019;9:794.
- [CrossRef] [PubMed] [PubMed Central] [Google Scholar]
- The effect of vitamin D and calcium supplementation in pediatric steroid sensitive nephrotic syndrome. Pediatr Nephrol. 2017;32:2063-70.
- [CrossRef] [PubMed] [Google Scholar]
- Time trends and ethnic patterns of childhood nephrotic syndrome in Yorkshire, UK. Pediatr Nephrol. 2001;16:1040-4.
- [CrossRef] [PubMed] [Google Scholar]
- Severity of vitamin D deficiency in children with nephrotic syndrome: a study from tertiary care center in northern India. Saudi J Kidney Dis Transpl.. 2022;33:608-16.
- [CrossRef] [PubMed] [Google Scholar]
- Evaluation, treatment, and prevention of vitamin D deficiency: An Endocrine Society clinical practice guideline. J Clin Endocrinol Metab. 2011;96:1911-30.
- [CrossRef] [PubMed] [Google Scholar]
- Osteocalcin level in children with steroid-dependent/frequently relapsing and steroid resistant nephrotic syndrome. Iran J Pediatr. 2017;27:e14229.
- [Google Scholar]
- Treatment with tacrolimus and prednisolone is preferable to intravenous cyclophosphamide as the initial therapy for children with steroid-resistant nephrotic syndrome. Kidney Int. 2012;82:1130-5.
- [CrossRef] [PubMed] [Google Scholar]
- Vitamin D insufficiency in steroid-sensitive nephrotic syndrome in remission. Pediatr Nephrol. 2005;20:56-63.
- [CrossRef] [PubMed] [Google Scholar]
- Fracture IN Duchenne muscular dystrophy: Natural history and vitamin D deficiency. J Child Neurol. 2016;3:1181-7.
- [Google Scholar]
- The effect of prednisolone upon the metabolism and action of 25-hydroxy-and 1,25-dihydroxyvitamin D3. Proc Natl Acad Sci USA. 1974;71:2996-3000.
- [CrossRef] [PubMed] [Google Scholar]
- Functions of osteocalcin in bone, pancreas, testis, and muscle. Int J Mol Sci. 2020;21:7513.
- [CrossRef] [PubMed] [PubMed Central] [Google Scholar]
- Biochemical bone markers in nephrotic children. Pediatr Nephro.. 2004;19:869-73.
- [CrossRef] [Google Scholar]


