

Translate this page into:
A Simplified Risk Score to Estimate the Risk of Contrast-Induced Nephropathy after Contrast Exposure
Address for correspondence: Dr. Chaitanya S. Kulkarni, Assistant Professor, Department of Nephrology, Gandhi Medical College and HH, Bhopal, Madhya Pradesh – 462 001, India. E-mail: chaitanya02102@gmail.com
-
Received: ,
Accepted: ,
This article was originally published by Wolters Kluwer - Medknow and was migrated to Scientific Scholar after the change of Publisher.
Abstract
Introduction:
Scores are available to predict the probability of contrast-induced nephropathy (CIN) after cardiac interventions, but not many scores are available for non-cardiac interventions and there are none for intravenous exposure to contrast. We designed this study to develop a simplified score to determine the probability of developing CIN in patients exposed to the parenteral contrast medium.
Methods:
This was a prospective study of patients who received parenteral contrast. Of 1300 patients, the first 1000 comprised the derivation cohort and the next 300 comprised the validation cohort. The patient variables in the development cohort were studied using univariate analysis. Statistically significant individual variables were used as independent variables, and CIN was used as the dependent variable in the final multivariate logistic regression model. Then, the risk score was obtained and validated.
Results:
The incidence of CIN was 3.8%. The risk factors, namely the presence of diabetes mellitus, e-GFR, and route and volume of contrast material were significantly associated with the risk of CIN (P < 0.05). The developed risk score had a sensitivity of 90.4% and specificity of 98.78%. The overall accuracy was 97.8%. The values of AUC of ROC in the development and validation datasets were high. This indicated that the predicted CIN risk score correlated well with the calibration and discriminative characteristics.
Conclusions:
The route and volume of contrast administered, low e-GFR, and diabetes mellitus were the significant risk factors. The developed risk score exhibited very good sensitivity and specificity and excellent accuracy in predicting the probability of CIN.
Keywords
Contrast
diabetes mellitus
nephropathy
risk score

Introduction
Contrast-induced nephropathy (CIN) is commonly defined as a ≥25% increase in serum creatinine from the baseline value or an absolute increase of at least 0.5 mg/dL 48–72 h after the administration of radiographic contrast media (CM) and is not attributable to other causes.[12] CIN, a known cause of hospital-acquired acute kidney injury (AKI),[3] is seen in <1% of patients with normal renal function and in up to 50% in high-risk patients.[4]
Multiple risk factors for CIN have been identified in previous studies. Diabetes mellitus (DM) and deranged renal function are the most important risk factors.[567] Various risk scoring systems have been developed for identifying patients at risk of CIN in whom periprocedural nephroprotective measures may be used to prevent CIN such as Bartholomew,[8] Mehran,[6] and Gurm[9] scores. There is only one Indian study that focused on the risk score in CIN.[10] Previous studies and scores have been developed in patients who had intra-arterial contrast exposure for cardiac procedures. It appears that CIN has been overestimated in past studies.[11] With all these uncertainties in the recent literature, we designed this prospective study to determine the incidence and risk factors for CIN by including patients who received intra-arterial/intravenous contrast and developed a simplified risk score to predict risk of CIN in patients exposed to parenteral CM.
Materials and Methods
This study is an observational, prospective cohort study. It was conducted at a tertiary care hospital and included consecutive patients undergoing in-center investigations and procedures requiring intravascular CM administration. This study was reviewed and approved by the institutional review board and the ethics committee of the hospital.
We included adults undergoing procedure or investigation requiring parenteral CM and willing to participate in the study and who gave written consent for the same
Patient on dialysis, kidney transplant recipients, those who had received contrast medium (CM) in the previous 2 weeks, had hypotension in the peri-procedural period, requiring IABP or other risk factors that could give rise to an increase in serum creatinine (e.g. obstructive uropathy and nephrotoxic drugs) were excluded
The primary outcome was an increase in serum creatinine by ≥25% or ≥0.5 mg/dL from pre-procedure serum creatinine after 48–72 h of parenteral CM administration. Secondary outcomes included requirement for dialysis and death.
Sample size calculation
This study was designed to develop a simplified risk score to predict the risk of CIN.
The sample size required for the development of a risk score depends on the variables to be considered. As a rule of thumb, events per variable (EPV) are used for the development of a risk score.
EPV = Number of events (i.e. CIN) ÷ Variables to be used to develop a score
Considering 4 variables we will require approximately 40 patients who may develop CIN.
In a previous study,[10] approximately 90 events (i.e. CIN) occurred in out of 1200 patients. Thus, for 40 events to occur, approximately 500 patients were required. This means that a minimum sample size of 500 patients with contrast exposure should be included in the study. Because number of patients exist in sufficient numbers, it was planned to include consecutive patients in this study.
Of the total 1300 patients available for analysis, the first 1000 patients were included in the derivation cohort, and the next 300 patients were included in the validation cohort.
Data collection
Patients were enrolled in the study after fulfilling the inclusion and exclusion criteria. Written informed consent was obtained from all patents. Baseline physical and laboratory parameters, including serum creatinine, details of procedure/investigations (including the type of exposure and volume and type of contrast) and fluids received were noted. Patients who received IV fluids were given IV fluid 2 h prior to the investigation/intervention, continued during the procedure, and 6 h after that. The volume given was guided by ECHO findings in patients in whom it was available and as per clinical findings and the volume status of the patient. Patients received IV fluids at the rate of 1–2 ml/kg/h according to the abovementioned factors. Serum creatinine was measured 48–72 h post CM exposure.
Statistical analysis
Data were entered into EXCEL worksheets. Quantitative variables were expressed as mean and standard deviation. Qualitative variables were expressed as percentages and frequencies. Unpaired student’s t test was used to compare the mean of continuous variables. Chi-square test, unpaired t test, or Fisher’s exact test was used to determine the correlation (P value) as per the variable. Out of 1300 patients, the initial 1000 patients were included in the derivation cohort and the next 300 patients were included in the validation cohort. Univariate and multivariate logistic regression was performed on derivation cohort to identify the risk factors for CIN. P < 0.05 was considered statistically significant. Risk factors with the strongest prediction of CIN were used to construct the model. This model was validated on the validation cohort. The area under curve (AUC) of receiver operating characteristic (ROC) was used to evaluate the model discrimination between patients with and without CIN. ‘R’ Statistical software (version: R 3.4.3) was used for all statistical analyses.
Results
The baseline characteristics of the patients in the derivation cohort and validation cohort are shown in Table 1.
| Derivation cohort (n=1000) | Validation cohort (n=300) | |
|---|---|---|
| Age (years) | Mean=58.0 SD=14.4 | Mean=56.9 SD=15.13 |
| Males | 67.6% | 59.7% |
| Females | 32.4% | 40.3% |
| Diabetes Mellitus | 39.1% | 37.3% |
| Hypertension | 54.8% | 42.6% |
| Pre-procedure S. creatinine (mg/dL) Mean (SD) | 1.07 (0.53) | 1.09 (0.47) |
| Haemoglobin (g/dL) Mean (SD) | 11.8 (2.1) | 11.04 (2.09) |
| Haematocrit (%) Mean (SD) | 35.5 (6.6) | 34.87 (6.6) |
| e-GFR (mL/min/1.73 m2)* Mean (SD) | 79.8 (27.9) | 76.04 (25.45) |
SD=Standard Deviation. *e-GFR calculated by CKD EPI equation
The procedures with intra-arterial contrast exposure in study patients included: coronary angiography, coronary angioplasty, spinal angiogram, renal angiography, cerebral angiography, peripheral angiography, chemoembolization in patients with malignancy. Whereas, investigations with intravenous exposure included computed tomography (CT) brain, neck, thorax, abdomen, pelvis, kidney urinary bladder, CT abdominal angiography, CT orbit, CT pulmonary angiography, CT paranasal sinuses, CT renal angiography.
The mean volume of contrast administered was 81.7 mL (SD: ±35.4 mL). Furthermore, 60.6% patients received <100 mL of CM, and 39.4% patients received >100 mL of CM. Iohexol was used in 50% of the patients, 36.3% of patients received iodixanol, and 13.7% received iopromide as the CM. Furthermore, 51.3% of patients did not receive intravenous hydration at the time of intervention/investigation, whereas 48.7% of patients received intravenous hydration. Of these, 14.7% of patients received hydration with isotonic sodium bicarbonate (8.4%), and 34% received 0.9% normal saline. Moreover, 40% of the patients had an e-GFR of >90 mL/min/1.73 m2, 34.7% had e-GFR in the range of >60 to 90 mL/min/1.73 m2, 18.4% had an e-GFR of 30–60 mL/min/1.73 m2, and 6.9% patients had an e-GFR of <30 mL/min/1.73 m2.
The incidence of CIN in our study was 3.8%. It was higher among the patients who received intra-arterial CM (6.0%) than in patients who received intravenous CM (1.6%). Occurrence of CIN was not different in patients irrespective of N-Acetylcysteine use (11.1% vs 10.9%). No patient required dialysis, and there was no immediate mortality in the study population during the patient follow-up period. Univariate analysis was performed using 11 variables (age, gender, route of administration, diabetes mellitus, hypertension, e-GFR, volume of CM, N-acetyl cysteine, intravenous hydration received during the peri-procedural period, hemoglobin, and hematocrit). Table 2 shows the distribution and correlation of risk factors between patients that developed CIN compared to those who did not.
| Risk factor | CIN (n=38) | No CIN (n=962) | P |
|---|---|---|---|
| Age, mean (SD) | 65.29 (9.62) | 57.71 (14.51) | 0.0015* |
| Gender, n (%) | |||
| Males | 27 (71.05) | 648 (67.36) | 0.6336^ |
| Females | 11 (28.95) | 314 (32.64) | |
| DM, n (%) | 28 (73.68) | 364 (37.84) | <0.0001# |
| HTN, n (%) | 18 (47.37) | 432 (44.91) | 0.8683# |
| GFR, n (%) | |||
| <30 | 7 (18.42) | 62 (6.44) | <0.0001^ |
| 30-60 | 15 (39.47) | 169 (17.57) | |
| >60-90 | 14 (36.84) | 333 (34.62) | |
| >90 | 2 (5.26) | 398 (41.37) | |
| Route of administration, n (%) | 0.0003# | ||
| Arterial | 30 (78.95) | 470 (48.86) | |
| Venous | 8 (21.05) | 492 (51.15) | |
| Volume of contrast, n (%) | <0.0001^ | ||
| <100 mL | 9 (23.68) | 597 (62.06) | |
| ≥100 mL | 29 (76.32) | 365 (37.94) | |
| Hemoglobin, mean (SD) | 12.28 (2.22) | 11.73 (2.13) | 0.1194* |
| Hematocrit, mean (SD) | 37.15 (6.52) | 35.42 (6.58) | 0.1121* |
| IV HYDRATION | |||
| Yes | 26 (68.42) | 634 (65.90) | 0.7480^ |
| No | 12 (31.58) | 328 (34.10) |
*Unpaired t-test: P<0.05 is significant. #Fisher’s test: P<0.05 is significant. ^Chi-square test: P<0.05 is significant
Development of a simplified risk score
The equation was developed stepwise as follows:
-
1)
The patient variables in the development cohort were studied using univariate analysis. Significant individual variables (P < 0.05) were included for further statistical purposes.
-
2)
Forward stepwise logistic regression analysis was used to clarify the final risk factors with the strongest prediction of CIN by using the analysis of deviance. Table 3 shows the coefficients for a multiple logistic regression model.
-
3)
The logistic regression equation was obtained using four variables, namely the route of contrast administration, volume of CM, e-GFR, and DM (present or absent). The obtained logistic regression equation can be expressed as g (x) = β0+βiXi+----+βṕXṕp, where g is the dependent variable, p is the number of independent variables, and x is a vector determined from independent variables.
-
4)
Conditional probability of occurrence of the dependent variable, that is, the occurrence of CIN in our study is given by the formula p(x) = exp g (x)/1 + expg(-x).
-
5)
Based on the patients’ data, the following equation was modeled for estimating the probability of occurrence of CIN: Exp [y] = exp (A)/1 + exp (-A), where A = -3.676501 -0.48362* (ROUTE) +0.03326* (VOLUME) +0.51667* (DM) - 0.04840* (GFR). After substituting the information, this equation yields the calculated risk as shown in Figure 1.
-
6)
The AUC of the ROC was used to evaluate the model’s ability to differentiate between patients with and without CIN.
| Variable | Coefficient | Standard error | Z | Pr (>IzI) |
|---|---|---|---|---|
| Route of contrast medium | 0.483620 | 0.522801 | 0.925 | 0.03549 |
| Volume of contrast medium | 0.033268 | 0.006774 | 4.911 | <0.0001 |
| Diabetes Mellitus | 0.516673 | 0.437960 | 1.180 | 0.02381 |
| e-GFR | -0.048400 | 0.008243 | -5.872 | <0.0001 |
Akaike Information Criterion (AIC) value with the abovementioned variables=227.11. Null deviance=322.92 on 997 degrees of freedom. Residual deviance=217.11 on 993 degrees of freedom. Number of Fisher’s scoring interactions=8. Thus, the risk score was developed using four variables
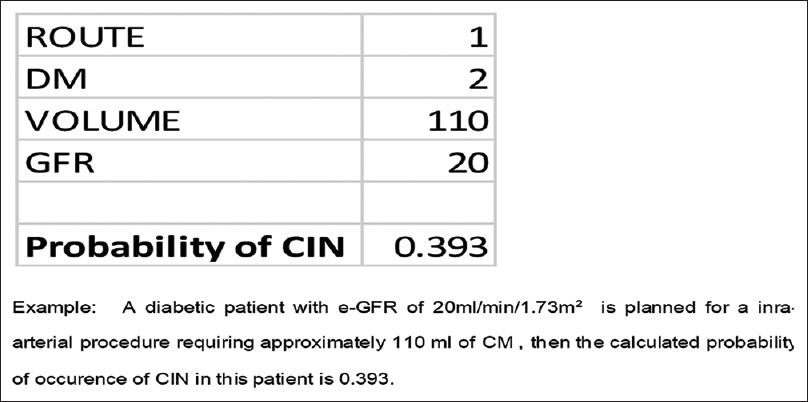
- Example showing calculation of risk of CIN
Validation of risk scoring system
As described above, the scoring system was derived from the derivation cohort of 1000 patients. Then, the scoring system was applied to these 1000 patients. The AUC of ROC when applied to this cohort is shown in Figure 2, indicating that the model performed very well on this dataset. Then, after confirmation, the data of 300 patients from the validation cohort was introduced. The AUC of the ROC for the validation cohort is shown in Figure 3. The risk score system exhibited a sensitivity of 90.4% and a specificity of 98.78%. The risk score overall accuracy was 97.8%. The observed high values of ROC in the development and validation datasets as shown in the above graphs indicate that the predicted CIN risk score correlated well with the calibration and discriminative characteristics. The AUC was 0.9467 for the developmental dataset and 0.9878 for the validation dataset.
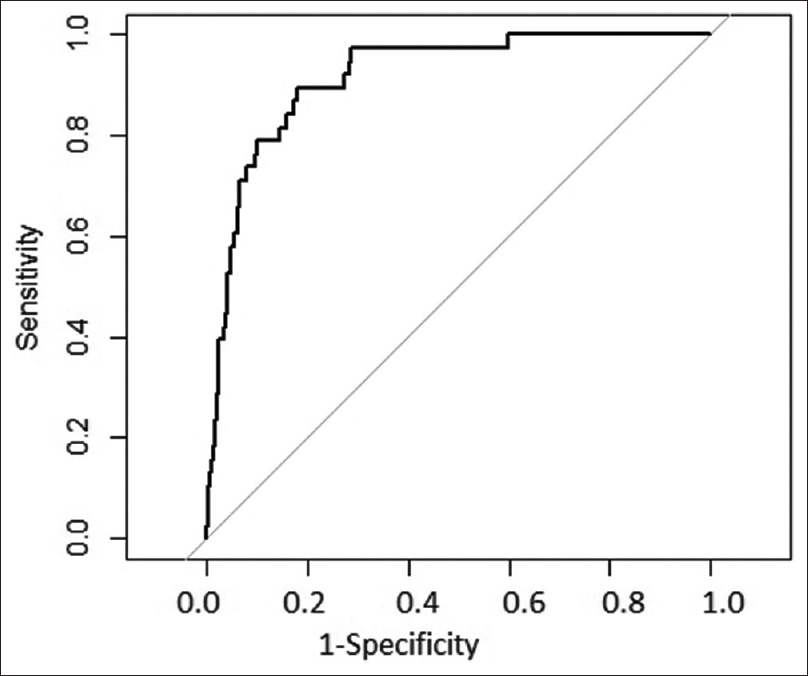
- ROC in derivation dataset
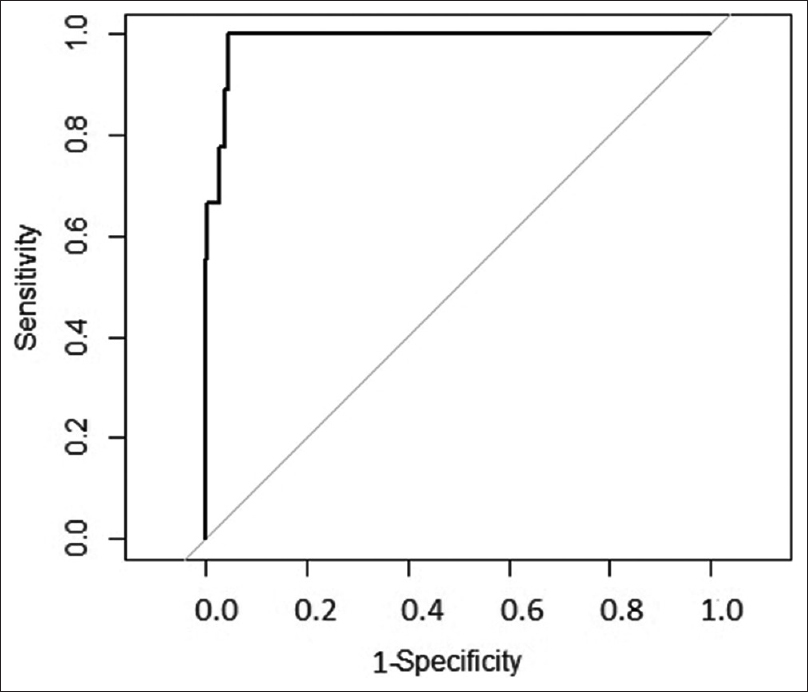
- ROC in validation dataset
Discussion
The present study included 1300 patients who were administered intravascular CM. The incidence and risk factors responsible for the development of CIN were studied to develop a simplified risk-scoring system that can predict the risk of CIN in patients. There were variations in the age group and male-to-female ratio in various studies. Suma Victor et al.[10] and another study[12] had a similar study population. Patients in studies done by Poletti et al.[13] and Weisbord et al.[14] were older as compared to our study. A previous study[6] reported a higher incidence of CIN compared to our study, while others[815] had an incidence of CIN that matched the present study. Incidence was more in patients who received intra-arterial CM compared to patients receiving intravenous CM.
Previous studies on CIN[616] found DM as a significant risk factor for the development of CIN. The present study too supports this finding. We found that baseline e-GFR was a significant variable after applying both univariate and multivariate analysis. Bartholomew et al.[8] Mehran et al.,[6] and Suma Victor et al.[10] observed results consistent with our study. Amal Abdel Ghani et al.[15] observed that the risk of development of CIN is higher when serum creatinine is >1.3 mg/dL (P < 0.0001). In the present study, the incidence of CIN was higher in patients who received intra-arterial CM as compared to patients receiving intravenous CM. The possible causes include but are not limited to 1) microemboli dislodgement, more so in patients with atherosclerosis; 2) time taken by contrast to reach the kidneys; and 3) peak concentration in renal vessels. Most of the previous studies suggested similar outcomes.[10121718] Previous studies[1016] found that the volume of CM was a significant risk factor for the development of CIN. Similar findings were noted in the present study. The risk was higher when >100 mL of CM was used in the intervention/investigation. There was no difference between CIN incidence in patients receiving low osmolar CM (LOCM) and iso-osmolar CM (IOCM). Similar and contrary results were observed in previous studies.[1920] A recent study by Hiremath et al.[21] proposed that IOCM is slightly better and more cost-effective than LOCM. NAC has been used as a preventive agent in patients with increased risk of CIN. We found no protective effect with NAC. Similar result was reported by Poletti et al.[13] and the ACT study.[22] We observed that age was a significant risk factor for the development of CIN. In contrast to our study, Suma Victor et al.[10] observed that age is not a significant risk factor for development of CIN. Some studies found that the female gender was a risk factor for development of CIN. The present study had findings contradictory to the above mentioned studies but similar to Suma Victor et al.[10]
A previous study[23] concluded that an outpatient regimen (oral fluid) is as effective as an inpatient course of intravenous fluid. More recently, Dussol et al.[24] conducted a multi-arm trial to compare the rate of CIN in patients with stage 3 or 4 CKD after receiving one of four preventive regimes. The difference in CIN between the oral NaCl and intravenous NaCl groups was not found to be statistically significant. The present study found no protective effect of intravenous fluid. This may be because the study population was relatively healthy. The mean e-GFR was 79.8 mL/min/1.73 m2 with an SD of 27.9. There are various studies having results contrary to what we found.[2526]
Mehran et al.[6] included patients undergoing coronary intervention in their study. Univariate analysis showed 16 variables associated with the development of CIN. Multivariate analysis was performed. The model was constructed using eight variables. The model demonstrated good discriminative power in the validation population. Suma Victor et al.[13] included consecutive 1200 patients undergoing PCI, divided them in the ratio of 3:1 for the developmental and validation cohorts, respectively. Univariate followed by multivariate logistic regression was used to elucidate the final risk score. Seven variables were used to establish the model. The AUC of the ROC was used to evaluate model discrimination between patients with and without CIN. Bartholomew et al.[8] derived important risk factors from more than 50 demographic, clinical, and procedural characteristics in the derivation cohort. Multivariate regression analysis was performed until variables with P < 0.001 remained. The final model was tested on the validation cohort. Chen et al.[27] randomized patients in the 3:2 ratio for the derivation and validation cohorts. Periprocedural variables showing independent correlation to CIN were used to derive a score. Odds ratio from multivariate and logistic regression were used to assign weightage to nine variables. Gurm et al.[9] used a random forest regression model including 46 variables; the incidence was 2.59% and 2.45% in the derivation and validation cohorts, respectively.
All the above-mentioned studies were conducted on patients receiving intra-arterial CM. To our knowledge, the present study is the only study that included patients exposed to both intra-arterial and intravenous CM. Table 4 shows a comparison of our score with the available scores. We applied univariate analysis on 11 variables. Multivariate logistic regression was applied on the statistically significant variables. We developed a simplified risk-scoring system by using only four variables: e-GFR, volume of contrast, route of contrast, and DM. The equation was validated in our study.
| Score | Population from whom the score was derived | Score applicable to | No. of variables required to calculate the risk | Validation |
|---|---|---|---|---|
| Mehran[6] | Patients undergoing cardiac interventions | Patients undergoing cardiac interventions | 8 | Yes |
| Bartholomew et al.[8] | Patients undergoing cardiac interventions | Patients undergoing cardiac interventions | 9 | Yes |
| Ghani et al.[15] | Patients undergoing cardiac interventions | Patients undergoing cardiac interventions | 5 | Yes |
| Gurm et al.[9] | Patients undergoing cardiac interventions | Patients undergoing cardiac interventions | 15 | Yes |
| Suma Victor et al.[10] | Patients undergoing cardiac interventions | Patients undergoing cardiac interventions | 7 | Yes |
| Our Score | Patients undergoing | Patients undergoing | 4 | Yes |
| 1. Cardiac interventions | 1. Cardiac interventions | |||
| 2. Non-cardiac arterial interventions | 2. Non-cardiac arterial interventions | |||
| 3. Investigations/ Interventions with intravenous contrast use. | 3. Investigations/ Interventions with intravenous contrast use. |
Financial support and sponsorship
Nil.
Conflicts of interest
There are no conflicts of interest.
Acknowledgements
We are thankful to Dr. Prasad Modak for his expertise and assistance in statistical work. In addition, we would like to extend our thanks to Dr. Swapnil Hiremath and Dr. Chirag Parikh for their suggestions. We acknowledge the efforts of Mr. Jatin Desai in preparing the google app based on our study.
References
- Guidelines for contrast media from the European Society of Urogenital Radiology. Am J Roentgenol. 2003;181:1463-71.
- [Google Scholar]
- Contrast-media-induced nephrotoxicity: A consensus report. Eur Radiol. 1999;9:1602-13.
- [Google Scholar]
- The prognostic implications of further renal function deterioration within 48 h of interventional coronary procedures in patients with pre-existent chronic renal insufficiency. J Am Coll Cardiol. 2000;36:1542-8.
- [Google Scholar]
- Adverse effects of contrast media: Incidence, prevention and management. Drug Saf. 1998;19:313-24.
- [Google Scholar]
- Contrast induced nephropathy: Updated ESUR Contrast Media Safety Committee guidelines. Eur Radiol. 2011;21:2527-41.
- [Google Scholar]
- A simple risk score for prediction of contrast-induced nephropathy after percutaneous coronary intervention: Development and initial validation. J Am Coll Cardiol. 2004;44:1393-9.
- [Google Scholar]
- Contrast material-induced renal failure in patients with diabetes mellitus, renal insufficiency, or both. N Engl J Med. 1989;320:143-9.
- [Google Scholar]
- Impact of nephropathy after percutaneous coronary intervention and a method for risk stratification. Am J Cardiol. 2004;93:1515-9.
- [Google Scholar]
- A novel tool for reliable and accurate prediction of renal complications in patients undergoing percutaneous coronary intervention. J Am Coll Cardiol. 2013;61:2242-8.
- [Google Scholar]
- Risk scoring system to predict contrast induced nephropathy following percutaneous coronary intervention. Indian Heart J. 2014;66:517-24.
- [Google Scholar]
- Intravenous contrast material–induced nephropathy: Causal or coincident phenomenon? Radiology. 2013;267:106-18.
- [Google Scholar]
- Risk of acute kidney injury after intravenous contrast media administration. Ann Emerg Med. 2017;69:577-86.e4.
- [Google Scholar]
- N-acetylcysteine does not prevent contrast nephropathy in patients with renal impairment undergoing emergency CT: A randomized study. BMC Nephrol. 2013;14:119.
- [Google Scholar]
- Associations of increases in serum creatinine with mortality and length of hospital stay after coronary angiography. J Am Soc Nephrol. 2006;17:2871-7.
- [Google Scholar]
- Risk score for contrast induced nephropathy following percutaneous coronary intervention. Saudi J Kidney Dis Transpl. 2009;20:240-5.
- [Google Scholar]
- Low hematocrit predicts contrast-induced nephropathy after percutaneous coronary interventions. Kidney Int. 2005;67:706-13.
- [Google Scholar]
- Incidence of contrast-induced nephropathy after contrast-enhanced computed tomography in the outpatient setting. Clin J Am Soc Nephrol. 2010;5:4-9.
- [Google Scholar]
- Contrast-induced nephropathy in urological imaging: A comparison with cardiology interventions. Indian J Urol. 2017;33:241-5.
- [Google Scholar]
- Contrast-induced nephropathy and long-term adverse events:cause and effect? Clin J Am Soc Nephrol. 2009;4:1162-9.
- [Google Scholar]
- Nephrotoxicity of iso-osmolar iodixanol compared with nonionic low-osmolar contrast media: Meta-analysis of randomized controlled trials. Radiology. 2009;250:68-86.
- [Google Scholar]
- Are iso-osmolar, as compared to low-osmolar, contrast media cost-effective in patients undergoing cardiac catheterization?An economic analysis. Int Urol Nephrol. 2018;50:1477-82.
- [Google Scholar]
- Acetylcysteine for prevention of renal outcomes in patients undergoing coronary and peripheral vascular angiography: Main results from the randomized acetylcysteine for contrast-induced nephropathy trial (ACT) Circulation. 2011;124:1250-9.
- [Google Scholar]
- PREPARED: Preparation for angiography in renal dysfunction: A randomized trial of inpatient vs outpatient hydration protocols for cardiac catheterization in mild-to-moderate renal dysfunction. Chest. 1998;114:1570-4.
- [Google Scholar]
- A randomized trial of saline hydration to prevent contrast nephropathy in chronic renal failure patients. Nephrol Dial Transplant. 2006;21:2120-6.
- [Google Scholar]
- Optimal timing of hydration to erase contrast-associated nephropathy: The OTHER CAN study. J Invasive Cardiol. 2003;15:699-702.
- [Google Scholar]
- What is the best hydration regimen to prevent contrast media-induced nephrotoxicity? Clin Nephrol. 2004;62:1-7.
- [Google Scholar]
- A simple preprocedural score for risk of contrast-induced acute kidney injury after percutaneous coronary intervention. Catheter Cardiovasc Interv. 2014;8:E8-16.
- [Google Scholar]
Appendix
Click on the following link. After putting details of the patient, the probability of the development of CIN in that patient will appear.
Alternatively, the Google PlayStore app can be downloaded from the following link and the risk can be calculated:
https://play.google.com/store/apps/details?id=com.hhdon.kidneytools


