

Translate this page into:
Assessment of Dietary Acid Load in Children with Chronic Kidney Disease: An Observational Study
Corresponding Author: Dr. Arpana Iyengar, Department of Pediatric Nephrology, St John’s Medical College Hospital, Bengaluru - 560 034, Karnataka, India. E-mail: arpanaiyengar@gmail.com
-
Received: ,
Accepted: ,
How to cite this article: Sravani M, Collins S, Iyengar A. Assessment of Dietary Acid Load in Children with Chronic Kidney Disease: An Observational Study. Indian J Nephrol 2024;34:50-5. doi: 10.4103/ijn.ijn_29_23
Abstract
Introduction:
Dietary acid load (DAL), which reflects the balance between acid- and alkaline-forming foods, is a modifiable risk factor for metabolic acidosis in CKD. Owing to the paucity of data in the Indian context, we undertook this cross-sectional study to estimate DAL and assess acid and alkaline food consumption in children with CKD2-5D (Chronic kidney disease stage 2 to 5 and 5D-those on hemodialysis).
Methods:
Clinical profile, dietary assessment of energy, protein intake/deficits, and macronutrients were noted and computed using software created by the division of nutrition, St John’s research institute based on Kidney Disease Outcomes Quality Initiative (KDOQI) guidelines in clinically stable children with CKD2-5D. DAL was estimated using potential renal acid load (PRAL in mEq/day) = (0.49 × protein intake in g/day) + (0.037 × phosphorus-intake in mg/day) − (0.02 × potassium intake in mg/day) − (0.013 × calcium intake in mg/day) − (0.027 × magnesium intake in mg/day). A positive dietary PRAL (>0) favors acidic content and negative (<0) favors alkaline content. PRAL was stratified into quartiles for analysis. The association of various clinical and dietary parameters were analysed across these quartiles.
Results:
Eighty-one children [of mean age 122 ± 47 months; 56 (69%) boys, 29 (36%) on dialysis, 62 (77%) non-vegetarians] were studied. Twenty-eight (34%) were on bicarbonate supplements. A positive PRAL (9.97 ± 7.7 mEq/day) was observed in 74/81 (91%) children with comparable proportions in those with CKD2-5 and 5D [47/52 (90%) vs. 27/29 (93%) respectively, P > 0.05]. Protein intake was significantly higher in the highest quartile compared to the lowest quartile of PRAL in CKD2-5 (55 ± 16 g/day vs. 40 ± 14 g/day, P < 0.001) and 5D groups (47 ± 15 g/day vs. 25 ± 11 g/day, P = 0.002). A majority of the participants 60/81 (74%) consumed highly acidic and minimal alkali foods.
Conclusion:
In children with CKD2-5D, PRAL estimation revealed high DAL in the majority with a high consumption of acidic foods. These findings provide implications for appropriate dietary counseling in children with CKD.
Keywords
Chronic kidney disease
dietary acid load (DAL)
nutrition
potential renal acid load (PRAL)
PRAL food pyramid

Introduction
In chronic kidney disease (CKD), a diet rich in acid-forming foods can produce acid stress (AS). Metabolic acidosis is the severe manifestation of AS and is a known modifiable risk factor for CKD progression.1 Dietary patterns are one of the major modifiable risk factors that influence CKD and its progression.2,3 Consumption of dietary acids from inorganic anions, such as phosphate, chlorine, and sulphate, and from organic acids, such as oxalic acid or uric acid, as well as production of endogenous acid from metabolism contributes to metabolic acidosis in CKD.4 Moreover, insufficient proximal tubular excretion and insufficient absorption and regeneration of bicarbonate lead to metabolic acidosis.5 Through metabolism, foods rich in phosphate and proteins (sulfur amino acids such as cysteine, methionine, and taurine and cationic amino acids such as lysine and arginine) release acid precursors. Similarly, alkaline precursors are released by metabolism of potassium-, magnesium-, and calcium-containing foods.6
Acidic foods can damage the renal tubules by elevated ammoniagenesis in the nephrons.7 Therefore, specific dietary modifications intended to balance daily acid production with alkaline foods may be beneficial for children with CKD.8 Thus, diet composition (providing acid/base precursors), which is known to influence acid base status, can be estimated using dietary acid load (DAL). To measure the DAL, different approaches exist, such as measuring net endogenous acid production (NEAP), net acid excretion (NAE), and potential renal acid load (PRAL).6 PRAL is a simple DAL assessment tool that measures the capacity of any food to produce acid or alkali.9
In a recent meta-analysis of 14 clinical trials in adults CKD3–5, the authors demonstrated that treatment with bicarbonate supplements (eight studies) or dietary control of acid load (six studies) showed reduced risk of end-stage kidney disease.10 Studies on adults with CKD have demonstrated that high acid diets have been associated with a higher incidence of hypertension, insulin resistance, type 2 diabetes mellitus, and cardiovascular disease.11-13 Most studies on DAL and its association with CKD progression have been published in adults.4,5,8 Only one study in Venezuelan children with CKD demonstrated specific dietary patterns to be associated with high potential renal acid load (PRAL), promoting metabolic acidosis and CKD progression.13 There is paucity of data in Indian children with chronic kidney disease. Therefore we undertook this study with the objectives to estimate dietary acid load (DAL) using PRAL in children with CKD stage 2-5D and to determine the association of PRAL with dietary factors and metabolic acidosis.
Materials and Methods
This cross-sectional observational study was conducted at St John’s Medical College hospital, Bengaluru; in the department of Pediatric Nephrology from January 2017 to December 2021 after obtaining approval from the institutional ethics committee. The study cohort was a part of a main study on protein energy wasting (PEW) in children with CKD. Ours was a subgroup analysis of the primary study on PEW in children that included children aged 4–18 years and who were diagnosed with CKD2-5D from 2017 till 2022. Sick children, those admitted within a month of screening, and those not available for follow-up were excluded. Food composition details of these children were captured on a software created by the Division of Nutrition, St John’s research Institute. Those who had data available for measurement of DAL were included in this study [Figure 1].
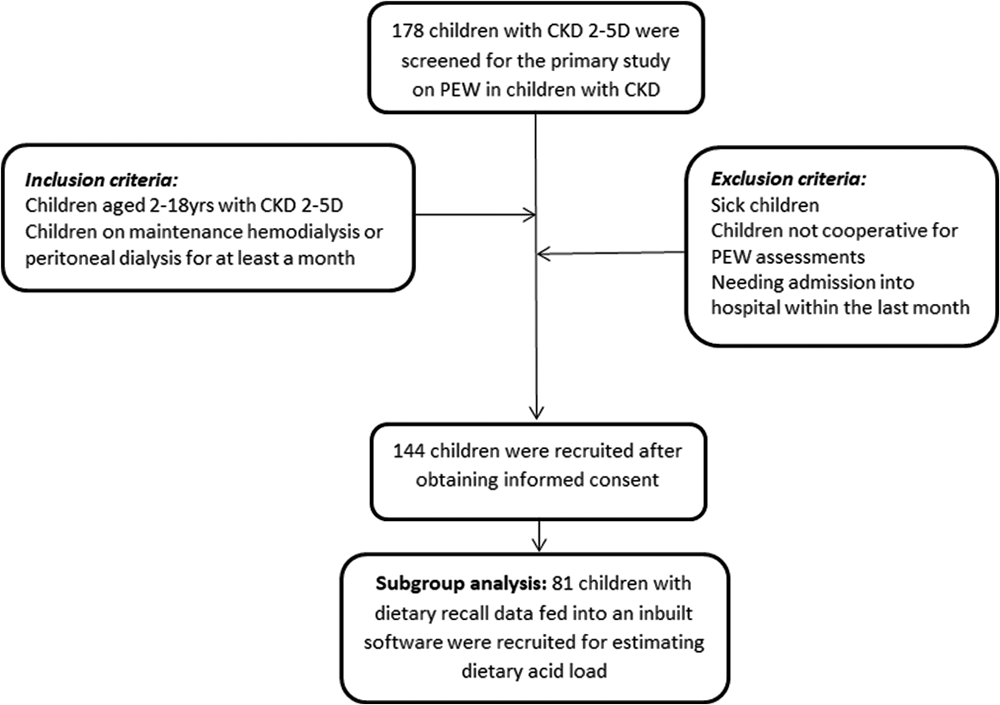
- Depicts the enrolment of patients and study flow of the research conducted.
As this subgroup analysis stemmed from the primary study, sample size was calculated based on the objective of this sub-study. The sample size was calculated using the study on Venezuelan children with CKD as reference, with likely mean PRAL of 16 ± 10.27 mEq/day, confidence level of 95%, absolute precision of ±5%, and attrition of 20%. The sample size calculated was 74.
The clinical profile and sociodemographic factors of the participants, such as age, sex, anthropometric measurements like height, weight, and body mass index (BMI), and socio-economic status (SES) according to the modified Kuppuswamy classification,14 were noted. According to the KDIGO (Kidney Disease: Improving Global Outcome) guidelines, children were classified with CKD stages 1–5 for diagnostic evaluation and management of CKD.
Dietary assessment
Diet intake of all the recruited children was assessed by a 24-h recall method on an average of 3 days in a week including weekends. Quantity of the food and beverages consumed and portions of each food were obtained in detail, as mentioned by the parents, using a preformed questionnaire by the nutritionist. Dietary intake of energy, protein, and macronutrients were noted and computed using food frequency table, built-in software provided by the division of nutrition. Calorie, protein intake, and their differences from reference values were calculated using Kidney Disease Outcome Quality Initiative (KDOQI) guidelines.15 Additionally, the proportion of children on bicarbonate, calcium, phosphorous, potassium, and magnesium supplements were noted.
Assessment of dietary acid load using potential renal acid load
The DAL was estimated using PRAL, which determines the net endogenous acid production in excess of the level of alkali produced based on 100 g of food consumed. According to the formula developed by Manz and Remer,9 DAL was calculated using the following formula: PRAL mEq/day = (0.49 × protein intake in g/day) + (0.037 × phosphorus intake in mg/day) − (0.02 × potassium intake in mg/day) − (0.013 × calcium intake in mg/day) − (0.027 × magnesium intake in mg/day). Negative values of PRAL (<0) indicated alkaline content and positive (>0) indicated acid content. The concept of PRAL calculation has a physiological basis and accounts for intestinal absorption rates of individual minerals and of sulfate produced from metabolized proteins. This method of calculation was experimentally validated in healthy adults, showing that under controlled conditions, acid loads and renal net acid excretion could be reliably estimated from diet composition.16
Food pyramids
PRAL values for various Indian foods were noted using the United States Department of Agriculture’s (USDA) food composition databases as reference.1,6 Using obtained PRAL values, we created an Indian food pyramid for diet evaluation [Figure 2a]. Using the food pyramid, diet was assessed for alkaline- and acid-based foods, and the food proportions contributing to PRAL were noted. Acid foods (PRAL: 0 to +15 mEq/day) are depicted on the right half of the food pyramid whereas alkaline foods (PRAL: 0 to −10 mEq/day) on the left half of the food pyramid [Figure 2a].
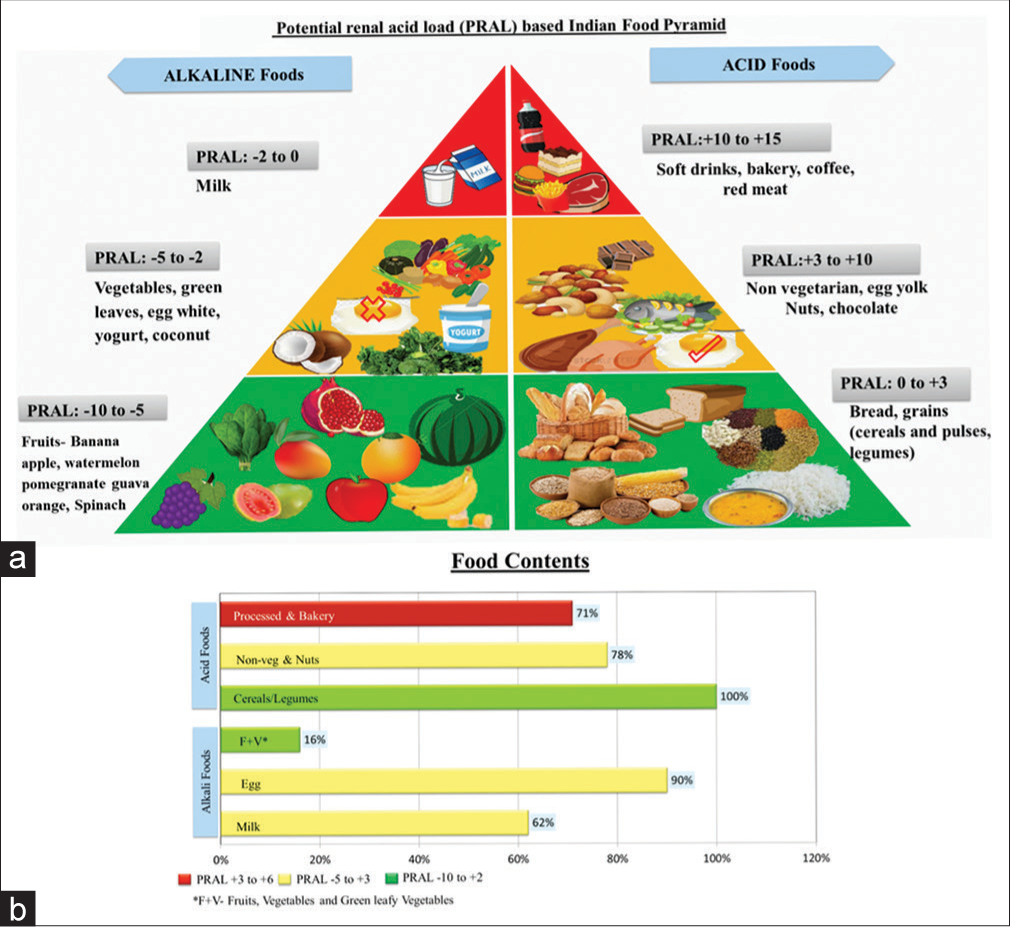
- (a) Indian food pyramid was created to represent PRAL values for various Indian diet, with right half depicting alkaline food (PRAL value </= 0 and left half of the pyramid depicting acidic foods with PRAL values >0. (b) Depicts the food components of all the children with CKD with majority of them consuming acidic foods and very few children consuming highly alkali foods like fruits and vegetables.
Laboratory evaluation
Serum creatinine, venous blood gas, and serum bicarbonate were measured. Two to three milliliter of venous blood was obtained as part of a diagnostic evaluation during regular follow-up. Serum creatinine was estimated using picrate enzymatic method and was equated to the Isotope dilution mass spectrometry (IDMS) method. The estimated glomerular filtration rate (eGFR) was calculated using modified Schwartz formula. Metabolic acidosis was defined as serum bicarbonate <22 mEq/L.
Statistical analysis
We analyzed data by using Kolmogorov–Smirnov test of normality to see whether they followed normal distribution. Basic descriptive data were represented as mean (standard deviation), median (interquartile ranges), frequencies, and percentages. The association between PRAL and dietary factors was analyzed using the Wilcoxon rank-sum (Mann– Whitney) test. Proportions of food patterns were compared with PRAL using the Pearson Chi-squared test. PRAL was stratified into quartiles (Q1 to Q4) for data analysis. Significant level was considered to be a P-value less than 0.05. Analysis was performed using Stata 2.0.
Results
In this cross-sectional study, a total of 178 children with CKD were screened. A total of 144 children were recruited as a part of main study, out of which 81 were included as a subset of main study [Figure 1] who had their dietary recall data fed into an inbuilt software to obtain food composition details. Hence, a total of 81 children with CKD2-5D with complete data on dietary composition were studied. Their mean age was 122 ± 47 months, 56 (69%) were boys, 57 (70%) belonged to low socioeconomic status, and 19 (23%) were vegetarians. Twenty-nine (36%) of children were on dialysis (17% on hemodialysis and 19% on peritoneal dialysis) and 28/81 (34%) received bicarbonate supplements with mean serum bicarbonate value of 22 ± 3.3 mEq/L. Forty-eight percent (39/81) of the children recruited were underweight for their age and 24/81 (30%) had short stature. The most prevalent kidney disease included non-glomerular causes 70 (86%) as compared to glomerular 11 (14%) [Supplementary Table-S1]. Supplementary Table-S1 provides the baseline characteristics of the recruited children with CKD2-5D.
Dietary intake
Eighty percent (65/81) of children with CKD had their appetite intact, among whom 62 (77%) were non-vegetarians [40/62 (64%) consumed meat only during the weekend, 15/62 (24%) at least twice weekly, and 7/62 (12%) of them consumed meat more than twice in a week]. The mean caloric and protein intake was 1191 ± 436 kcal/day and 38 ± 14 g/day, respectively [Table 1]. The median (IQR) of energy and protein difference among these children was −258 (−531, −14) kcal/day and 9.6 (1.6, 21) g/day] respectively. The median (IQR) of dietary potassium, calcium, and magnesium intake per day are depicted in Table 1. Table 1 depicts the dietary characteristics of the study participants.
| Characteristics | Values (n=81) |
|---|---|
| Appetite$ | 65 (80) |
| Type of Food$ | |
| Vegetarian | 19 (23) |
| Non-vegetarian | 62 (77) |
| Calories (kcal/day)* | 1191±436 |
| Protein (g/day)* | 38±14 |
| Energy difference (kcal/day)# | −258 (−531, −14) |
| Protein difference (g/day)# | 9.6 (1.6, 21) |
| Phosphate (mg/day)* | 819±284 |
| Potassium (mg/day)# | 1157 (910, 1497) |
| Calcium (mg/day)# | 407 (282, 581) |
| Magnesium (mg/day)# | 249 (198, 322) |
| PRAL (mEq/day)* | |
| Overall cohort | 9.9±7.7 |
| CKD2–5 | 9.7±7.6 |
| Hemodialysis | 10.3±6.4 |
| Peritoneal dialysis | 10.3±8.9 |
| PRAL$ | |
| Positive | 74 (91) |
| Negative | 7 (9) |
| PRAL in the groups$ | |
| Dialysis: Positive | 27 (93) |
| Negative | 2 (7) |
| CKD2–5: Positive | 47 (90) |
| Negative | 5 (10) |
| Food contents | |
| Acid foods$ | |
| Cereals and legumes | 81 (100) |
| Non-vegetarian and nuts | 63 (78) |
| Processed and bakery foods | 58 (71) |
| Alkaline Foods$ | |
| Milk | 50 (62) |
| Egg | 73 (90) |
| Fruits and vegetables | 13 (16) |
Dietary acid load
PRAL quartiles (Q1 [−7 to +4)] Q2 [+4.5 to +9], Q3 [+9.5 to +14, Q4 [+15 to +30] mEq/day) did not show an association with sociodemographic and clinical characteristics in both the groups. Positive PRAL (9.9 ± 7.7 mEq/day) was observed in 74 (91%) of children, with comparable proportions in those with CKD2–5 and 5D [47/52 (90%) vs. 27/29 (93%) respectively, P > 0.05]. The mean PRAL among CKD2–5 and 5D (9.7 ± 7.7 vs. 10.3 ± 7.7 mEq/day, P = 0.4) showed no significant association [Table 1]. On univariate analysis after adjusting PRAL values to age, sex, SES, type of diet, appetite, bicarbonate and other supplements, protein intake, and protein difference were observed to be significantly higher in the highest quartile compared to the lowest quartile of PRAL in CKD2–5 (55 ± 16 g/day vs. 40 ± 14 g/day, P < 0.001) and 5D (47 ± 15 g/day vs 25 ± 11 g/day, P = 0.002) [Table 2]. Higher caloric intake in the highest compared to the lowest quartile of PRAL was observed in those with 5D (1281 ± 366 kcal/day vs. 875 ± 320 kcal/day, P = 0.03), but not in those with CKD2–5 (1472 ± 438 kcal/day vs. 1471 ± 672 kcal/day, P = 0.06). However, on comparing the highest quartile to the lowest quartile, PRAL did not establish significant association with serum bicarbonate in both the CKD2–5 (21 ± 2.9 mEq/L vs 21 ± 3.6 mEq/L, P = 0.99) and 5D (24 ± 4 mEq/L vs 22 ± 3 mEq/L, P = 0.82) groups. Table 2 demonstrates the comparison of clinical parameters and PRAL quartiles (Q1–4) in children with CKD stage 2-5D.
| Parameters | PRAL Quartiles (mEq/day) | P | |||
|---|---|---|---|---|---|
| −7 to +4 (Q1) | +4.5 to +9 (Q2) +9.5 to +14 (Q3) | +15 to +30 (Q4) | |||
| CKD stage 2–5 (n=52) | 12 | 14 | 14 | 12 | |
| Age (months)* | 108±43 | 121±48 | 125±45 | 126±48 | 0.75 |
| Serum bicarbonate (mEq/L)* | 21±3.6 | 21±3.6 | 21±3.2 | 21±2.9 | 0.99 |
| Calorie (kcal/day)* | 1471±672 | 1204±269 | 1087±222 | 1472±438 | 0.055 |
| Protein (g/day)* | 40±14 | 36±9.1 | 35±6.7 | 55±16 | <0.001 |
| Calorie difference (kcal/day)# | −65 (−570, 679) | −325 (−460,−189) | −279 (−821,−127) | −81 (−422, 277) | 0.28 |
| Protein difference (g/day)# | 16 (0.69, 28) | 8.3 (1, 15) | 8.3 (1.4, 17) | 24 (12, 35) | 0.031 |
| CKD stage 5D (n=29) | 9 | 6 | 6 | 8 | |
| Age (months)* | 127±43 | 137±50 | 109±43 | 132±69 | 0.80 |
| Serum bicarbonate (mEq/L)* | 22±3 | 23±2.5 | 23±3.3 | 24±4 | 0.82 |
| Calorie (kcal/day)* | 875±320 | 801±294 | 1032±251 | 1281±366 | 0.034 |
| Protein (g/day)* | 25±11 | 25±8 | 34±9 | 47±15 | 0.002 |
| Calorie difference (kcal/day)# | −472 (−579,−222) | −521 (−595, −165) | −254 (−381, 130) | −158 (−564, −40) | 0.62 |
| Protein difference (g/day)# | 3 (−2, 6.9) | 2.6 (−0.5, 9) | 8.5 (7.1, 16) | 17 (7.3, 26) | 0.041 |
This significance is seen even after adjusting PRAL for age, sex, socio-economic-status diet type, appetite, serum bicarbonate and other supplements. *Mean±standard deviation, #Median (interquartile range). PRAL: Potential renal acid load, CKD: Chronic kidney disease
Food contents
Indian food pyramid [Figure 2a] created based on PRAL values for various Indian acid and alkaline-based foods revealed that 58 (71%) of children consumed acidic foods (predominantly soft drinks, beverages, bakery snacks, coffee, tea, chocolates, and meat) with milk consumption in a very small quantity in the form of coffee or tea or diluted milk. Cereals were one of the most consumed foods, including rice and dhal (PRAL: 0 to + 3 mEq/day). Preferred animal-derived protein were eggs 73 (90%) followed by chicken (78%). Red meat and fish were less frequent choices. Children had an intake of alkaline foods in the form of egg, yogurt, and milk (62%). Fruits and vegetables with highest alkaline content were consumed by only 16% of children on a daily basis [Figure 2b]. On looking into the association of PRAL with food contents, we found that positive PRAL was associated with intake of processed and bakery foods (P < 0.001) and negative PRAL was associated with fruit and vegetable consumption (P = 0.01).
Discussion
This observational study in children with CKD2-5D showed that the values of PRAL estimated were positive in majority 74 (91%) indicating high DAL. Dietary assessment in these children showed that protein intake was in excess of the KDOQI recommendations and that a majority of the children consumed higher acidic foods with minimal alkaline foods.
This cross-sectional study showed positive PRAL in a majority of the children with CKD2-5D, whereas only 9% had negative PRAL. These findings are in accordance with the study on Venezuelan children (1–6 years) with CKD (n = 27, PRAL mean ± SD: 16 ± 10.7 mEq/day), however none of these children had negative PRAL.13 The Venezuelan children had a higher PRAL value than their healthy counterparts (n = 52, PRAL mean ± SD: 14.29 ± 12.34 mEq/day), similar to the healthy German DONALD (Dortmund Nutritional and Anthropometric Longitudinally Designed) study (n = 220, PRAL mean ± SD: 13.3 ± 12.4 mEq/day).17,18 Interestingly, the mean (SD) dietary PRAL in this study was lower compared to the Venezuelan children with CKD and their healthy cohort [Figure 3]; however similar data on healthy Indian children is lacking for comparison.

- Compares the mean PRAL values evaluated in various studies with present study with all the populations having positive PRAL
In all the 81 children with CKD2-5D, protein intake was higher when compared with protein requirements recommended for their age. The average protein intake was 1.5 g/kg/day, which was higher than the recommendation by KDOQI guidelines. Similar findings have been reported earlier in healthy and children with CKD from Venezuela.15,17 The excessive protein intake by children with CKD probably follows a paradigm of modern society that encourages protein consumption above other nutrients as growth determinants.
Metabolic acidosis is known to be influenced by diet composition, which provides acid and base precursors.6 Angeloco et al.,8 in their study that included adult CKD3–5 patients, reported a strong negative association between DAL and serum bicarbonate, confirming that DAL may be a modifiable risk factor for metabolic acidosis. However, there was no such association established between DAL and serum bicarbonate in this study. The lack of association between PRAL and metabolic acidosis could probably be explained because very few were noted to have metabolic acidosis (28%), with the majority (34%) being on bicarbonate supplements [Supplementary Table-S1].
Similar to the recent western contemporary diet patterns in Venezuelan children with CKD and in adolescents of German DONALD study, a majority of the children in our study also demonstrated higher acidic food consumption. In children with CKD2-5D, PRAL estimation revealed high DAL in the majority of participants, with a higher consumption of acid-forming foods such as cereals, legumes, grains, meat, and processed and bakery foods and a limited intake of alkaline foods such as fruits and vegetables being noted [Figure 2a]. As reported by Nolan et al.,19 more than 50% of children (even in low-income populations) were noted to consume high protein diets contributing to acidic foods, accompanied by lower fruit and vegetable intake. similar findings were prevalent in our children with CKD whom consumed alkalinizing foods well below the KDOQI recommendations.15
Positive PRAL was associated with intake of processed and bakery foods, and negative PRAL was associated with fruit and vegetable consumption as observed in previous studies.13,17,18 All of these findings implicate that not only dietary restriction of acidic foods in patients with CKD but also a balance between consumption of acidic and alkaline foods must be carefully considered during dietary recommendations in CKD children with metabolic acidosis. Thus, the DAL would be highly significant in the nutritional therapy of children with CKD and aid in raising the serum bicarbonate levels.8
An important strength of the current study is the profile of PRAL in children on dialysis, which, to our knowledge, has not been published thus far. Food pyramid based on PRAL values for Indian foods was created for interpretation and dietary counselling in children with CKD using known reference values. The study also focused on an important issue of dietary assessment that has not been studied well in Indian children with CKD. The study also has a few limitations: since only 7/81 children had negative PRAL, further association with CKD stages could not be done. The data of PRAL on healthy children is lacking for better comparison. This sub-study was limited by the fact that only data of those children who had their food composition details available on the software were analyzed and interpreted.
A burden od high acid load in the diet causes unfavorable metabolic responses including growth disorders, loss of bone and muscle mass, hypercalciuria, hyperuricosuria and urolithiasis in childhood.17 Hence, with subtle manipulations in the diet like exchange of only a few protein-rich or alkaline-poor food contents for foods with high-alkaline content, as depicted in Indian food pyramid [Figure 2a] could markedly reduce the DAL, which is known to influence metabolic acidosis.
Conclusion
The study concludes that in children with CKD2-5D, PRAL estimation revealed high DAL in the majority of participants, with higher consumption of acidic foods and limited intake of alkali foods being noted. Protein excess leads to higher PRAL value, which has clinical implications for a balanced diet with respect to acid and alkali contents in the diet to achieve negative PRAL. PRAL estimation can be a valuable tool for DAL assessment in children with CKD.
Conflicts of interest
There are no conflicts of interest.
Financial support and sponsorship
There was no financial support undertaken for the study.
References
- Dietary contributions to metabolic acidosis. Adv Chronic Kidney Dis. 2022;29:373-80.
- [CrossRef] [PubMed] [Google Scholar]
- Diet and kidney function: A literature review. Curr Hypertens Rep. 2020;22:14.
- [CrossRef] [PubMed] [Google Scholar]
- Energy expenditure improved risk factors associated with renal function loss in NAFLD and MetS patients. Nutrients. 2021;13:629. doi: 10.3390/nu13020629
- [CrossRef] [PubMed] [Google Scholar]
- Dietary acid load: A novel nutritional target in chronic kidney disease? Adv Chronic Kidney Dis. 2013;20:141-9.
- [CrossRef] [PubMed] [Google Scholar]
- Longitudinal association of dietary acid load with kidney function decline in an older adult population with metabolic syndrome. Front Nutr. 2022;9:986190. doi: 10.3389/fnut.2022.986190
- [CrossRef] [PubMed] [Google Scholar]
- Dietary acid load: Mechanisms and evidence of its health repercussions. Nefrologia (Engl Ed). 2019;39:343-54.
- [CrossRef] [PubMed] [Google Scholar]
- High dietary acid load predicts ESRD among adults with CKD. J Am Soc Nephrol. 2015;26:1693-700.
- [CrossRef] [PubMed] [Google Scholar]
- Association of dietary acid load with serum bicarbonate in chronic kidney disease (CKD) patients. Eur J Clin Nutr. 2020;74:69-75.
- [CrossRef] [PubMed] [Google Scholar]
- Dietary potential renal acid load and renal net acid excretion in healthy, free-living children and adolescents. Am J Clin Nutr. 2003;77:1255-60.
- [CrossRef] [PubMed] [Google Scholar]
- Effects of treatment of metabolic acidosis in CKD: A systematic review and meta-analysis. Clin J Am Soc Nephrol. 2019;14:1011-20.
- [CrossRef] [PubMed] [Google Scholar]
- Dietary acid load and potassium intake associate with blood pressure and hypertension prevalence in a representative sample of the German adult population. Nutrients. 2018;10:103. doi: 10.3390/nu10010103
- [CrossRef] [PubMed] [Google Scholar]
- Dietary potential renal acid load and risk of albuminuria and reduced kidney function in the Jackson heart study. J Ren Nutr. 2018;28:251-8.
- [CrossRef] [PubMed] [Google Scholar]
- Dietary acid load in children with chronic kidney disease. Eur J Clin Nutr. 2020;74:57-62.
- [CrossRef] [PubMed] [Google Scholar]
- Modified Kuppuswamy socioeconomic scale: 2022 update of India. Int J Community Med Public Health. 2022;9:3841-4.
- [CrossRef] [Google Scholar]
- KDOQI clinical practice guideline for nutrition in CKD: 2020 Update. Am J Kidney Dis. 2020;76:S1-107.
- [CrossRef] [Google Scholar]
- Influence of renal function and diet on acid-base status in chronic kidney disease patients. J Ren Nutr. 2009;19:178-82.
- [CrossRef] [PubMed] [Google Scholar]
- Dietary potential renal Acid load in Venezuelan children. Nutr Hosp. 2015;31:2054-61.
- [Google Scholar]
- Potential renal acid load in the diet of children and adolescents: Impact of food groups, age and time trends. Public Health Nutr. 2008;11:300-6.
- [CrossRef] [PubMed] [Google Scholar]
- Longitudinal study of energy and nutrient intakes for infants from low-income, urban families. Public Health Nutr. 2002;5:405-12.
- [CrossRef] [PubMed] [Google Scholar]


