

Translate this page into:
Assessment of Dietary Phosphorus Intake and Implementation of Parental Phosphate Education in Pediatric Chronic Kidney Disease
-
Received: ,
Accepted: ,
This article was originally published by Wolters Kluwer - Medknow and was migrated to Scientific Scholar after the change of Publisher.
Abstract

Introduction:
Management of dietary phosphorus intake is a challenge in children with chronic kidney disease and is governed by regional food sources and culinary practices. The aim of this study was to evaluate dietary intake of phosphorus in these children and assess the utility of parental phosphate education for control of hyperphosphatemia.
Methods:
This prospective study included children aged 2–18 years with CKD stages 2–5D. Phosphorus intake was assessed by 24-hour dietary recall, analyzed using food processor software, and interpreted based on dietary reference intake (DRI) and suggested dietary intake (SDI). Parents of those with hyperphosphatemia were subjected to a structured phosphate education, and serum phosphate was monitored every 2 months for 6 months.
Results:
Seventy children were recruited (mean age 9.4 ± 3.4 years, CKD5/5D: 51% (n = 36)) with median duration of CKD being 3.8 (IQR2,6) years. In the overall cohort, 50% (35/70) had phosphorus intake exceeding DRI with no significant difference between groups [CKD 5/5D,52.7% (n = 19) vs CKD2–4 47% (n = 16), P = 0.63]. Mean daily phosphorus intake was comparable between children with and without hyperphosphatemia [908 ± 279 mg vs 814 ± 302 mg, P = 0.1]. Based on DRI, 44% of children with normal serum phosphate and 58% with hyperphosphatemia had increased dietary intake of phosphorus (P = 0.15). Based on SDI, 26% with normal serum phosphate and 94% with hyperphosphatemia had increased dietary phosphorus intake (P < 0.001). Hyperphosphatemia was observed in 51% (CKD 2–4); 33% CKD5-5D 66%, P = 0.6). Among 29 children completing 6 months of follow up, there was a significant reduction in mean serum phosphate levels (P = 0.001) which was independent of age, stage of CKD or intake of phosphate binders. At end of the study, hyperphosphatemia persisted in 34%.
Conclusion:
Compared to DRI, dietary assessment of phosphorus intake based on SDI was significantly associated with hyperphosphatemia in children with CKD 2-5D. In the majority, repeated parental structured phosphate education over 6 months was useful in managing hyperphosphatemia.
Keywords
Children
chronic kidney disease
dietary education
hyperphosphatemia
phosphorus education

Introduction
Hyperphosphatemia is an important comorbidity observed in children with chronic kidney disease (CKD) that relates to vascular calcification, cardiovascular morbidity, and bone mineral disease.[1] While two-thirds of Indian adults manifest with hyperphosphatemia in CKD stages 4-5D, one third of Indian children with CKD stages 2–4 were noted to have hyperphosphatemia.[2,3] Management of hyperphosphatemia is challenging especially in children. Dietary restriction of phosphorus forms the main stay of therapy though medical management and dialysis become critical with progression of CKD. The terms “phosphorus” relates to mineral content in dietary sources and “phosphate” is used to describe the active content in tissues.[4] Milk, milk products, meat, and grains form main sources of phosphorus that contribute to 23%–35% of total intake.[5,6]
Indian diet predominantly consists of rice, wheat, pulses, and milk products. Sources of phosphorus can vary based on socioeconomic and cultural backgrounds. Phosphorus-rich sources like processed foods, bakery products and those with high content of food additives may not be easily accessible to non-urban families. A study from South India revealed dietary phosphorus intake to be significantly lesser in healthy rural adults and children compared to their urban counterparts.[7] In contrast, a study undertaken in the United States revealed low socioeconomic status to be an independent risk factor for hyperphosphatemia.[8] As our institution majorly caters to families from the lower economic strata of society, we felt the need to estimate dietary phosphorus in children with CKD.
Recently, the Pediatric Renal Nutrition Task Force (PRNT) proposed a novel term, “suggested dietary intake (SDI)” that encompasses international recommendations as a reference measure for phosphorus intake while the KDOQI in 2008 recommended assessments based on the dietary reference intake (DRI).[9,10] Phosphorus content of food groups based on a western diet for children are available as part of guidelines.[9] Various efforts to impart knowledge to patients and caregivers regarding the importance, methods and techniques of dietary phosphorus restriction have been undertaken for effective management of hyperphosphatemia, but not studied in Indian children based on the Indian diet.[11-13] The primary objective of this study was to evaluate dietary intake of phosphorus based on Indian dietary sources by measures of DRI and SDI among children with CKD 2-5D and the secondary objective was to observe the utility of parental phosphate education in the control of hyperphosphatemia.
Methods
This is a prospective cohort study carried out in the CKD clinic of the department of pediatric nephrology of a tertiary care center between March 2018 and September 2019. Following informed consent, children with CKD 2-5D, aged 2–18 years were included for dietary assessment of phosphorus intake. Children who were on dialysis for less than a month, or those who were admitted and critically sick were excluded from the study. The institutional ethical committee approval was obtained (Ref No-152/2018). Based on a study by Hui WF et al.,[14] considering the median phosphorus consumption of 1206 mg/day (IQR 894,1612) in a cohort of children aged 1–16 years, a standard deviation of 700 mg was derived, and the sample size was estimated to be 58 with a 15% precision for this study.
Study method
All children meeting the inclusion criteria were evaluated for dietary phosphorus intake and serum phosphate. Only those with hyperphosphatemia were subjected to a structured parental phosphate education prospectively every 2 months for 6 months (3 follow up visits) by a qualified nutritionist and a clinician. For those with hyperphosphatemia at recruitment, serum phosphate estimation and reinforcement of the structured phosphate education were undertaken at each 2 monthly follow up visit. The decision to modify the dose of phosphate binders or dialysis prescription targeted to reduce phosphorus was left to the treating team. When such modifications in the dose of binders or dialysis prescription were indicated, the child was to be excluded from the study analysis.
Dietary phosphate intake assessment
A 24-hour dietary recall was undertaken by a qualified nutritionist using both weekday and weekend dietary history. The mean daily intake of calories and proteins was estimated and interpreted based on age groups proposed by the KDOQI guidelines.[10] The mean daily intake of phosphorus was documented using the Food Processor Nutrition Analysis Software (version 7.4,1999, ESHA, Portland, OR, USA) by estimating the nutrients in commonly consumed Indian foods formulated by the department of nutrition of our institute. As per guidelines, dietary phosphate intake was restricted to 80% of the DRI.[10] The interpretation of phosphorus intake was done using two different reference standard measures: 1) DRI for age recommended by the KDOQI that is based on the serum phosphorus and PTH levels; 2) SDI expressed as a range of values based on the age by the PRNT recommendation.[9,10] Serum phosphate was estimated by modified phosphomolybdate technique preferably with a morning post prandial sample, and hyperphosphatemia was diagnosed based on recommended reference values.[10,15]
Structured phosphate education
An information pamphlet was designed in three regional languages to address the importance of phosphate control, phosphorus content of Indian food groups and cooking methods for phosphorus restriction. A visual phosphorus pyramid based on the Italian phosphorus pyramid was designed to incorporate Indian food groups and their level of phosphorus content based on the Indian food composition tables of the National Institute of Nutrition.[16,17] Pamphlets contained information on the role of phosphate in CKD, phosphorus content of food sources, plant or animal based sources, use of food additives, the phosphorus pyramid, foods based on phosphate units, and specific cooking techniques to control hyperphosphatemia.
The education session encouraged interaction between parents, the nutritionist, and the clinician. This “structured education” was undertaken at recruitment and at every 2 months of follow up for 6 months. Phosphorus units were derived and labelled as “0 to 6” counts based on a previous study[12] that defined 1 phosphorus unit to contain100 mg of phosphorus per serving. A more extensive list was prepared under each count in sync with the pyramid’s module of traffic light colour scheme [Figure 1]. Parents were advised 1) to include phosphorus unit under 0–1 counts liberally (green-coloured blocks); 2) to be mindful about consumption of foods under 2–3 counts in moderation or once a week (yellow/cream blocks); and 3) to restrict use of food with under 5–6 counts to a minimum/once in a fortnight or once a month (rose/red colour blocks).
- The phosphorus pyramid based on Indian dietary sources. Copyright: Department of Pediatric Nephrology, SJMCH.
Statistical analysis: All categorical data were expressed as frequencies and percentages and continuous measurements summarized using mean (SD) or median (IQR) based on their distribution. Chi-squared test and independent t test were used to compare proportions and means. The change in serum phosphate on follow-up was analyzed using repeated measures of ANOVA. Mixed ANOVA test was carried out to assess the difference in serum phosphate among subgroups (CKD5 vs CKD2-4, high intake vs within reference range at recruitment, different age groups and those with and without phosphate binders). The data was analyzed using SPSS version 24 software (IBM, Chicago, Illinois).
Results
Seventy out of the 75 children screened were recruited (66% boys, mean age 9.46 ± 3.4 years). Median duration of CKD was 3.8 years (IQR2,6). Proportion of children belonging to CKD stages 2–4 and 5D were 49% (n = 34) and 51% (n = 36), respectively. A profile of the overall cohort is depicted in Table 1. Majority (66%) had congenital anomalies of the kidney and urinary tract as the etiology of CKD. Among those in CKD5, 5 were not on dialysis, 4 were on hemodialysis, and the rest 27 on chronic peritoneal dialysis. One child was excluded on follow-up as he underwent a renal transplant.
| Parameters | n/(%) |
|---|---|
| Age categories in years | |
| 2-4 | 2 (3) |
| 5-9 | 27 (38.5) |
| 10-18 | 41 (58.5) |
| BMI for height age <5th centile | 30 (43) |
| CKD stage | |
| 2 | 7 (10) |
| 3 | 14 (20) |
| 4 | 13 (18.6) |
| 5 | 5 (7.1) |
| 5D | 31 (44.3) [ 27 on PD; 4 on HD] |
| Cohort with hyperphosphatemia (who received diet education) | 36 |
| CKD 2—4 | 12 (33.3%) |
| CKD5/5D | 24 (66.6%) |
| Use of phosphate binders | 17 (24.2) |
| Calcium-based binders | 10 (58.8) |
| Non-calcium based binders | 4 (23.6) |
| Combined calcium and non-calcium based binders | 3 (17.6) |
Dietary intake: The mean phosphorus intake in the cohort was 890 ± 375 mg per day while protein intake was 40.05 ± 13.5 mg/day. In the three age groups proposed by KDOQI guidelines as 2–4 years, 5–10 years and 10–18 years, the mean daily calorie was 770 ± 14.14 kcal, 1142 ± 368 kcal and 1320 ± 360 kcal with protein intake of 25.9 ± 6.51gm, 30.69 ± 15.38 gm and 34.16 ± 13.75 gm, respectively. While 33/70 (47%) in the cohort had energy intake below the expected energy requirements, only 7/70 (10%) had protein consumption below the recommended intake. At baseline, based on KDOQI proposed age categories of 2–4 years, 5–10 years and 10–18 years, the mean daily consumption of phosphorus was 464.5 ± 21 mg, 772.5 ± 54 mg and 941.1 ± 23 mg of upper limits for age respectively.
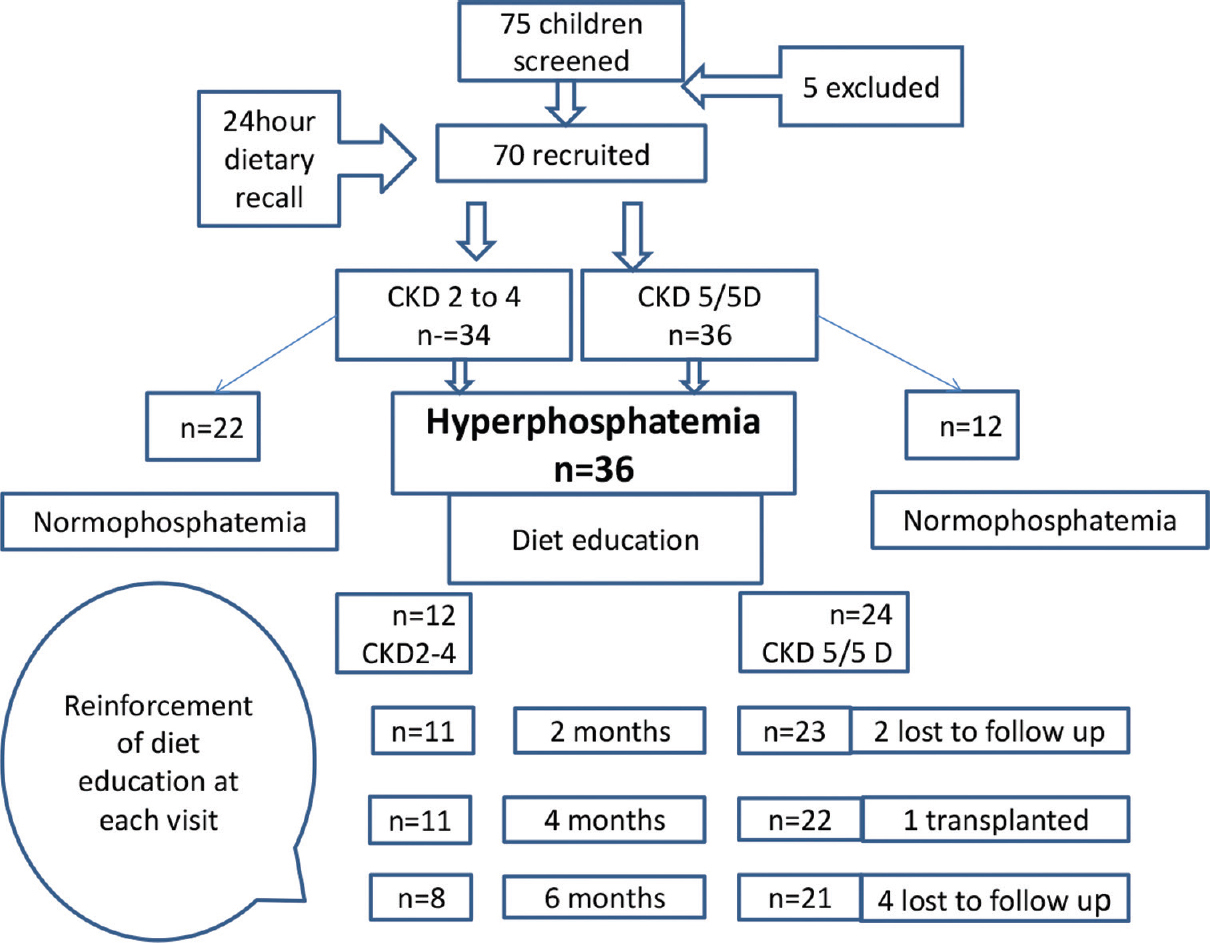
The mean daily phosphorus intake of children in CKD 5/5D was comparable to that of children in CKD 2–4 (835.9 ± 257.2 vs 901 ± 325.4 mg, P = 0.19). Amongst those with CKD 5 and 5D, 52.7% (n = 19) had phosphorus intake exceeding DRI compared to 47% (n = 16) in those with CKD 2–4, and this difference was not significant (P = 0.63). In the overall cohort, the mean protein intake above DRI was observed in 87% (n = 61) while mean phosphorus intake above the DRI was seen in 50% of children. Comparing associations between dietary phosphorus intake with serum phosphate, based on the DRI, 44% of children with normal serum phosphate and 58% with hyperphosphatemia had increased dietary intake of phosphorus (P = 0.15). On the contrary, based on SDI, 26% of children with normal serum phosphate and 94% with hyperphosphatemia had increased dietary phosphorus intake (P < 0.001). Figure 2 depicts a flow chart of the study protocol including recruitment and follow-up.

- Study flow diagram
Dietary sources of phosphate: The most routinely consumed phosphorus-rich foods were dairy products (milk and curd). About 80% of the cohort took dairy products on daily basis. Among non-vegetarian foods, egg was the commonly consumed phosphate source followed by chicken. Daily consumption of bakery products was observed in 50% children and 25% consumed store-bought snacks. Consumption of aerated beverages on a regular basis was not common.
Serum phosphate at recruitment and follow up
Among children with hyperphosphatemia, 51% (n = 36), CKD 2–4 (n = 12), CKD 5 (n = 24) had a mean serum phosphate of 6.34 ± 0.88 mg/dl. Amongst these children, 47% (n = 17) were on phosphate binders. 47%(16/34),44%(14/32) and 34%(10/29) at 2, 4 and 6 months follow up respectively. At recruitment, mean serum phosphate among those with CKD5/5D was higher (6.49 ± 1.7) than those with CKD2–4 (6.49 ± 1.7 vs 5.39 ± 0.88 mg/dl, P = 0.017). The mean serum phosphate at recruitment in those on binders were comparable to those not on binders (6.15 ± 0.83 and 6.10 ± 1.7 mg/dl, P = 0.9). There was a significant reduction in the mean serum phosphate in 29 children from baseline through follow-up at 2 months, 4 months, and 6 months, and between baseline and 6 months (P = 0.001) as depicted in Table 2. The mean change in serum phosphate from baseline to the end of 6 months follow-up was 1.29 mg/dl (95% CI 0.4–2.19; P = 0.002.). Comparing those with CKD5/5D and CKD2–4, the change in the mean serum phosphate from baseline through follow-up at 2 months, 4 months and 6 months was comparable (P = 0.7). At the end of 6 months, there was no difference in the mean serum phosphate level in those on and not on phosphate binders (P = 0.12). No changes to the doses or addition of phosphate binders were made during the study.
| Time | Mean serum phosphate (mg/dl) | P¥ | Change in mean serum phosphate | P§ | ||
|---|---|---|---|---|---|---|
| Mean (n=24) | SD | Mean | 95% confidence interval | |||
| Baseline | 6.3486 | 0.88105 | 0.001 | - | -- | - |
| 2months | 6.1697 | 1.81269 | 0.18 | (−0.64,1.00) | 0.999 | |
| 4 months | 5.6376 | 1.66333 | 0.71 | (−0.15,1.58) | 0.162 | |
| 6 months | 5.0552 | 1.51264 | 1.29* | (0.40,2.19) | 0.002 | |
¥RMANOVA; §Post hoc analysis after RMANOVA, P values adjusted using Bonferroni correction
Discussion: This prospective study in children with CKD including dialysis, reflects comparable mean dietary phosphorus intake between those with CKD stages 2–4 and 5D. Dietary phosphorus intake based on SDI is significantly associated with serum phosphate levels compared to DRI measures. In the majority, structured phosphate education, using the phosphorus pyramid and phosphorus unit count methods re-enforced over 6 months was found to be a useful tool in the dietary counselling for control of hyperphosphatemia.
The chronic kidney disease in children (CKiD) study, the largest pediatric CKD cohort of children in CKD 2–4 from the US[14] reported a higher median phosphorus intake [1,206 mg (IQR 894,1612)] compared to our cohort of children in CKD 2–4 (901 ± 325.4 mg). Probable reasons for this could be that besides addressing phosphorus content in food sources relevant to the region, it becomes imperative to measure hidden sources of phosphorus that are used as food additives. Moreover, it is challenging to precisely estimate intake when phosphorus content of commercial foods lack appropriate labelling of contents. This becomes an issue especially among non-urban residents of our society. Aside from phosphorus content of foods, bioavailability is an important component for consideration as it varies with plant-based and animal-based diet, and processed foods.[18] The CKiD study used a food frequency questionnaire method to assess phosphorus intake. This method is ideal and provides an elaborate and systematic approach to dietary assessment of nutrients that include several food items to which parents indicate the frequency of consuming a serving of the food item in the past 28 days.[14] We used a simpler and practical method of multiple pass 24-hour dietary recall for assessment of phosphorus intake, as suggested by the clinical practice recommendations of the PRNT.[9] Similarly, a cross sectional observational study from India used a 24-hour dietary recall to assess phosphorus intake in children with CKD 2–4 and those with kidney failure. The study concluded that phosphorus intake was higher than that recommended in early stages of CKD and lesser than the recommended intake in later stages of CKD. However, the reference values for phosphorus intake were not based on KDOQI or the PRNT.[19]
We observed a distinct difference in the dietary sources of phosphorus consumed by our patients compared to the CKiD study. While the most common phosphorus-rich foods in our cohort consisted of milk, curd, egg, and chicken, the CKiD study reported milk, cheese, fast foods, and poultry products.[14] Canned foods and aerated beverages were less consumed by children in our cohort.
Maintaining protein–phosphorus balance forms an important aspect of dietary management and this becomes even more critical in growing children.[20] Restricting phosphorus in diet should ensure adequate intake of protein in growing children. However, we observed that the mean protein intake exceeded the DRI in the majority. Similar observations of adequate or excess protein intake compared to the recommended daily allowance was noted in other studies among children with CKD2–4.[19,21] Eighty five percent of our cohort consumed eggs, white of egg being an affordable and simple source for control of hyperphosphatemia. There is evidence to suggest that egg white is effective in phosphate control in adult hemodialysis patients.[13,22]
Awareness regarding the presence of inorganic phosphate, preference to low phosphorus-to-protein ratios, and adequate protein content in foods is critical.[23] An appreciable number of studies have explored various tools to impart awareness of phosphate control in CKD. From knowledge questionnaires to smart phone applications, dietary education has evolved over time. In a cohort of children on peritoneal dialysis, dietary education did not have an impact on the phosphorus knowledge test scores.[24] The educational session in that study included importance of serum phosphorus control, phosphorus-rich foods, medications prescribed for hyperphosphatemia and serum phosphate, and barriers to compliance. However, dietary intake of phosphorus was not undertaken. In another study, an innovative approach to control hyperphosphatemia included the concept of adjusting phosphate binders based on dietary intake of phosphorus units without altering dietary phosphorus intake.[12] This method had a positive impact on phosphate control over 6 months in children with CKD. Using the same principle of phosphorus units, in our study we labelled food groups as counts 0–6 based on phosphorus units that served as a visual tool for dietary counselling.
In our study, we observed a significant reduction in serum phosphate over 6 months of follow-up that was independent of CKD stage, age, intake of phosphorus at recruitment, or intake of phosphate binders. Though the study design was not geared up to assess the direct effect of phosphate education on the control of hyperphosphatemia, we perceive that imparting knowledge, awareness and regular reinforcement has the potential to strengthen dietary control of hyperphosphatemia.
We felt the need to create a phosphorus pyramid based on food and culinary practices relevant to our community and to adapt the phosphorus units into the counselling strategy. Comparing our pyramid to the commonly referred to Italian pyramid,[16] we brought about changes in the visual images that incorporated Indian food items within the pyramid, based on their phosphorus content. We added a simple and easily understandable list of foods in colored blocks (based on phosphorus units) alongside the pyramid as a ready reckoner to the patient or caregiver. As the use of pressure cooker is very common in Indian cooking, appropriate information on soaking and boiling techniques were included.
Studies in adults with CKD have not revealed a significant correlation between urinary phosphorus excretion, used as a surrogate measure of dietary phosphorus intake, and serum phosphate values.[25,26] However, dairy products and cereals containing inorganic phosphorus additives through a 24-hour dietary recall significantly influenced serum phosphate values.[27] We observed that dietary intake of phosphorus did not influence serum phosphate values, which could be due to underestimation owing to hidden phosphate food sources and probable phosphate content in medications.
Dietary control of phosphorus and burden of hyperphosphatemia in Indian children with CKD not been systematically studied. This study provides an insight into diet-related control for hyperphosphatemia in children with both CKD and those on dialysis, based on DRI and SDI recommendations. The phosphate pyramid created based on Indian foods and cooking techniques is a useful dietary counselling tool for hyperphosphatemia in CKD.
Our study has many limitations. Firstly, those children with normal phosphate values ideally should have also received reinforcement through the structured education program on follow-up. Secondly, while 35% of children were hypertensive and on amlodipine, the phosphorus content in such medications was not considered in the intake. The bioavailability of phosphorus through diet remains a critical factor for interpretation that was not undertaken in this study. A systematic assessment of adherence to dietary advice and compliance should ideally have been undertaken. Finally, assessment for protein energy wasting, dietary recall for phosphorus intake and dietary assessment for calories and proteins on follow-up could have provided comparisons with the baseline dietary intake assessment.
To conclude, in children with CKD, the mean daily phosphorus intake was comparable between those with stages 2–4 and stage 5/5D. Compared to DRI measures, dietary assessment of phosphorus intake based on SDI was significantly associated with hyperphosphatemia in children with CKD 2–5D. The adapted phosphate pyramid and use of phosphorus units based on Indian diet serves as a useful tool to educate caregivers on the dietary control of phosphorus. Further study to explore the impact of phosphorus intake and phosphate education on long-term control of hyperphosphatemia and related clinical outcomes is needed.
Declaration of patient consent
The authors certify that they have obtained all appropriate patient consent forms. In the form the patient(s) has/have given his/her/their consent for his/her/their images and other clinical information to be reported in the journal. The patients understand that their names and initials will not be published and due efforts will be made to conceal their identity, but anonymity cannot be guaranteed.
Financial support and sponsorship
Nil.
Conflicts of interest
There are no conflicts of interest.
References
- The high prevalence of chronic kidney disease-mineral bone disorders: A hospital-based cross-sectional study. Indian J Nephrol. 2012;22:285-91.
- [Google Scholar]
- Chronic Kidney Disease (CKD): An observational study of etiology, severity and burden of comorbidities. Indian J Pediatr. 2017;84:822-5.
- [Google Scholar]
- Management of hyperphosphatemia in end-stage renal disease: A new paradigm. J Ren Nutr. 2021;31:21-34.
- [Google Scholar]
- The Stationary Office, London. Available from: http://doc.ukdataservice.ac.uk/doc/4243/mrdoc/pdf/a4243uab.pdf
- Understanding sources of dietary phosphorus in the treatment of patients with chronic kidney disease. Clin J Am Soc Nephrol. 2010;5:519-30.
- [Google Scholar]
- Vitamin D status in Andhra Pradesh: Apopulation based study. Indian J Med Res. 2008;127:211-8.
- [Google Scholar]
- Low socioeconomic status associates with higher serum phosphate irrespective of race. J Am Soc Nephrol. 2010;21:1953-60.
- [Google Scholar]
- The dietary management of calcium and phosphate in children with CKD stages 2-5 and on dialysis-clinical practice recommendation from the Pediatric Renal Nutrition Taskforce. Pediatr Nephrol. 2020;35:501-18.
- [Google Scholar]
- KDOQI clinical practice guideline for nutrition in children with CKD: 2008 update Executive summary. Am J Kidney Dis. 2009;53(3 Suppl 2):S11-104.
- [Google Scholar]
- Educational strategies to reduce serum phosphorus in hyperphosphatemic patients with chronic kidney disease: Systematic review with meta-analysis. J Ren Nutr. 2011;21:285-94.
- [Google Scholar]
- Self-adjustment of phosphate binder dose to meal phosphorus content improves management of hyperphosphataemia in children with chronic kidney disease. Nephrol Dial Transplant. 2010;25:3241-9.
- [Google Scholar]
- Dietary egg whites for phosphorus control in maintenance haemodialysis patients: A pilot study. J Ren Care. 2011;37:16-24.
- [Google Scholar]
- Assessment of dietary intake of children with chronic kidney disease. Pediatr Nephrol. 2017;32:485-94.
- [Google Scholar]
- Hyperphosphatemia and chronic kidney disease: A major daily concern both in adults and in children. Calcif Tissue Int. 2021;108:116-27.
- [Google Scholar]
- The “phosphorus pyramid“: A visual tool for dietary phosphate management in dialysis and CKD patients. BMC Nephrol. 2015;16:9.
- [Google Scholar]
- Strategies for phosphate control in patients withCKD. Kidney Int Rep. 2019;4:1043-56.
- [Google Scholar]
- Nutritional assessment in children with chronic kidney disease. Saudi J Kidney Dis Transpl. 2016;27:733-9.
- [Google Scholar]
- Dietary sources of energy and nutrient intake among children and adolescents with chronic kidney disease. Pediatr Nephrol. 2017;32:1233-41.
- [Google Scholar]
- Compromised diet quality is associated with decreased renal function in children with chronic kidney disease. Clin Nutr Res. 2014;3:142-9.
- [Google Scholar]
- The impact of a nutritional intervention based on egg white for phosphorus control in hemodialyis patients. NutrMetab Cardiovasc Dis. 2019;29:45-50.
- [Google Scholar]
- Protein intake and phosphate restriction in chronic kidney disease –Can we separate the wheat from chaff? J Renal NutrMetab. 2018;4:95-7.
- [Google Scholar]
- Hyperphosphatemia in children receiving peritoneal dialysis - An educational program. Pediatr Nephrol. 2005;20:967-71.
- [Google Scholar]
- Patient education for phosphorus management in chronic kidney disease. Patient Prefer Adherenc. 2013;7:379-90.
- [Google Scholar]
- Relationship of dietary phosphate intake with risk of end-stage renal disease and mortality in chronic kidney disease stages 3-5: The modification of diet in renal disease study. Kidney Int. 2016;89:176-84.
- [Google Scholar]
- Association of dietary phosphate and serum phosphorus concentration by levels of kidney function. Am J Clin Nutr. 2015;102:444-53.
- [Google Scholar]


