

Translate this page into:
Blood, Gut, and Oral Microbiome in Kidney Transplant Recipients
Address for correspondence: Dr. Ricardo Araujo, i3S - Instituto de Investigação e Inovação em Saúde, INEB – Instituto de Engenharia Biomédica (Nephrology and Infectiology R&D Group), Rua Alfredo Allen, 208, 4200-135 Porto, Portugal. E-mail: ricjparaujo@yahoo.com
-
Received: ,
Accepted: ,
This article was originally published by Wolters Kluwer - Medknow and was migrated to Scientific Scholar after the change of Publisher.
Abstract
Background and Objective:
Recent reports describe the existence of a blood microbiome profile not associated with an infection state. Given the high impact that the dysbiotic human microbiome appears to have in chronic kidney disease and, in particular, in the outcome of kidney transplant recipients (KTRs), we aimed to explore the variations and correlations of the gut, oral, and blood microbiome of recipients, 3 months after kidney transplantation.
Materials and Methods:
We conducted a cross-sectional study where the microbiome of stool, saliva, and blood collected from recipients 3 months after kidney transplantation (N = 6) was analyzed by polymerase chain reaction (PCR) amplification and sequencing of the V3–V4 hypervariable regions of the 16S rRNA gene using MiSeq Illumina® technology.
Results:
Blood of KTRs harbors a distinct low-abundance microbiome dominated by Proteobacteria and Firmicutes. Gut and oral microbiome of KTRs also present distinct profiles. The existence of a proportion of shared operational taxonomic units among the different body sites is reported, mainly classified as Proteobacteria and Firmicutes.
Conclusions:
This study provides evidence of existence a blood microbiome in KTRs, different from the gut and the oral microbiome profiles, with a small number of operational taxonomic units representing a shared microbiome. The clinical relevance of this observation should be further explored in these patients.
Keywords
Bloodstream
human microbiome
kidney transplantation
kidney transplant recipients
mobile bacteria

Introduction
Disturbances of normal gut microbiome (dysbiosis) may be important in the pathogenesis of chronic kidney disease (CKD).[1] Although complications after kidney transplantation, such as infection and rejection episodes, remain major challenges, few studies have evaluated the human gut microbiome in kidney transplant recipients (KTRs). Changes in gut microbiome composition pre- and posttransplant in KTRs were observed, specifically a decrease in diversity associated with an increase in the relative abundance of Proteobacteria, particularly in members of the Enterobacteriaceae family.[23] Besides, it has been demonstrated that the gut microbiota can also influence tacrolimus dosage, and that immunosuppressive therapy may impact on the gut microbiome.[45] Moreover, oral bacteriome were found to be altered in KTRs, with an overgrowth of potentially opportunistic pathogens.[26] Different studies have shown the existence of a blood microbiome in healthy patients and in patients with noninfectious diseases.[7891011] Recently, a study has shown that blood microbiome in CKD patients harbors a lower diversity and different taxonomic profiles in comparison to healthy controls.[10] Even if it could be expected that blood microbiome also exists in KTR patients, no information is currently available on the blood microbiome of KTRs, nor its comparison with gut or oral microbiome.
The presence of dysbiosis in KTR may impact on the type and concentration of uremic toxins, systemic inflammation, and the appearance of infections.[12] In fact, previous studies suggested that a specific microbiota profile could be associated with adverse events after kidney transplantation, specifically rejection events and infectious complications (diarrhea and urinary tract infections).[2313141516]
Given the high impact that dysbiosis may have in KTR outcomes, we evelauated the blood microbiome in KTR and its relationship with the gut and the oral microbiome, 3 months after kidney transplantation.
Materials and Methods
Study design, subjects, and sample collection
This cross-sectional study included adult living donor kidney transplant recipients followed up in the nephrology department of Centro Hospitalar Universitário S. João. Three months after transplantation, the microbiome were evaluated from the stool, saliva, and whole blood samples of six patients. The study protocol was approved by the local ethics committee and is in accordance with the 1964 Helsinki declaration and its later amendments. All recruited patients were asked to give their free written informed consent. The clinical information and infection history were gathered. The blood and saliva samples were collected by trained nurses, and the self-collected stool specimens were brought frozen by the patient within 24 h after collection. All samples were collected in DNA-free sterile containers and were immediately frozen and stored at −80°C.
Specimen processing and microbiome analysis
Genomic DNA was isolated and amplified in a strictly controlled environment at Vaiomer SAS (Labège, France) using a stringent contamination-aware approach.[81718] Polymerase chain reaction (PCR) amplification was performed targeting the V3–V4 hypervariable regions of the bacterial 16S rRNA gene as described previously.[817] The 476-base pair amplicon (base on Escherichia coli reference genome) was sequenced using the 2 × 300 paired-end Illumina MiSeq kit V3 as recommended by the manufacturer (Illumina, San Diego, CA, USA).
16S rRNA gene sequence data analysis and statistics
The targeted microbiome sequences were analyzed using the bioinformatics pipeline established by Vaiomer based on the Find Rapidly OTUs with Galaxy Solution (FROGS) guidelines for obtaining the operational taxonomic unit (OTU) table.[19] The following filters were applied: 1) the last 10 and 80 bases of R1 and R2 reads, respectively, were removed due to lower quality preventing good read pairing; 2) amplicons with a length <350 nt or >490 nt were removed; 3) amplicons without the two PCR primers were removed (10% mismatches authorized); 4) amplicons with at least one ambiguous nucleotide were removed; 5) OTUs identified as chimera (with VSEARCHv1.9.5)[20] in all samples were removed; 6) OTUs with an abundance lower than 0.005% of the whole dataset were removed; and 7) OTUs with a strong similarity (coverage and identity ≥80%) with the phiX (used as a control for Illumina sequencing runs) were removed. The clustering was produced in two passes of the Swarm algorithm v2.1.6 (the first clustering with an aggregation distance equal to 1 and the second clustering with an aggregation distance equal to 3). OTUs were produced via single-linkage clustering, and taxonomic assignment was performed by Blast+v2.2.30+ with the databank Silva 128 Parc database. Import, storage, analysis, and graphical display (including Principal Coordinate Analysis [PCoA]) of microbiome census data were done using PhyloSeqv1.14.0. The total sum-normalized OTU table was used for comparison of sample groups based on Bray–Curtis β-diversity. α-Diversity was calculated as the observed number of OTUs and Shannon index. Categorical variables were described through relative frequencies and analyzed by Chi-square independence test or Fisher’s exact test when more than one cell had <5 expected counts. P < 0.05 was assumed to denote a significant difference. The datasets generated for this study can be found in National Center for Biotechnology Information (NCBI), bioproject PRJNA540316.
Results
CKD etiologies of KTR included autosomal dominant polycystic kidney disease (two patients), IgA nephropathy, obstructive uropathy, focal segmental glomerulosclerosis, and lupus nephritis (one each). Induction therapy included the use of basiliximab in five patients and of antithymocyte globulin in one patient. All patients were under maintenance therapy with prednisone, tacrolimus, and mycophenolate mofetil. Five months after transplant, one patient suffered a cerebrovascular event and mycophenolate was shifted to everolimus. The general clinical characterization of KTR and the infection events are presented in Table 1 and Supplementary Table 1, respectively. All patients presented stable renal function and no rejection episodes up to 2 years after kidney transplantation.
| KTRs | |
|---|---|
| Age, years | 44.5±13.2 |
| Gender, n (%) males | 2 (33%) |
| Dialysis before transplantation, n (%) | 3 (50%) HD; 2 (33%) PD |
| Hypertensive patients, n (%) | 5 (83.3%) |
| Diabetic patients, n (%) | 1 (16.7%) |
| Hypertension | |
| Systolic | 128.2±14.4 |
| Diastolic | 81.5±8.3 |
| Glomerular filtration rate, mL/min/1.73 m2 | 75.3±17.6 |
| Blood markers | |
| Hemoglobin, g/dL | 13.0±1.9 |
| Albumin, g/L | 43.2±1.8 |
| Glucose, mg/dL | 97.2±26.7 |
| Urea, mg/dL | 47.2±13.9 |
| Creatine, mg/dL | 1.0±0.3 |
| Ferritin, ng/mL | 320.3±221.2 |
| C-reactive protein, mg/L | 5.2±6.9 |
KTR=kidney transplant recipient; HD=hemodialysis; PD=peritoneal dialysis
| Patient | Agent | Local | Time from KTR | Treatment |
|---|---|---|---|---|
| Patient1 | Staphyococcus aureus | Peritoneal Catheter exit-site | 1.5 before | Sulfamethoxazole |
| Escherichia coli | Urine | 2 after | Ciprofloxacin | |
| Patient 2 | Herpes simplex vírus 1 | Oral Ulcers | 0 after | Valaciclovir |
| Patient 3 | Herpes simplex vírus 1 | Oesophageal Ulcers | 2.5 after | Valaciclovir |
| Taxonomic level | Alpha diversity | |||
|---|---|---|---|---|
| Observed | Chao | Shannon | Simpson | |
| OTU | P<0.05 | P<0.05 | ns | ns |
| Species | P<0.05 | P<0.05 | ns | ns |
| Genus | P<0.05 | ns | ns | ns |
| Family | P<0.05 | P<0.05 | P<0.05 | ns |
| Class | P<0.05 | ns | P<0.05 | P<0.05 |
| Order | P<0.05 | P<0.05 | P<0.05 | P<0.05 |
| Phylum | P<0.05 | P<0.05 | P<0.05 | P<0.05 |
Gut, oral, and blood microbiome were analyzed in these patients. A total of 409 OTUs were detected among samples; the following details were observed for the samples’ OTUs, which are given as median (range): oral samples with 115 (106–128) OTUs, gut samples with 88 (59–105) OTUs, and blood samples with 50 (42–82) OTUs. The rarefaction curve analysis demonstrated the sufficiency of our read coverage to capture sample diversity [
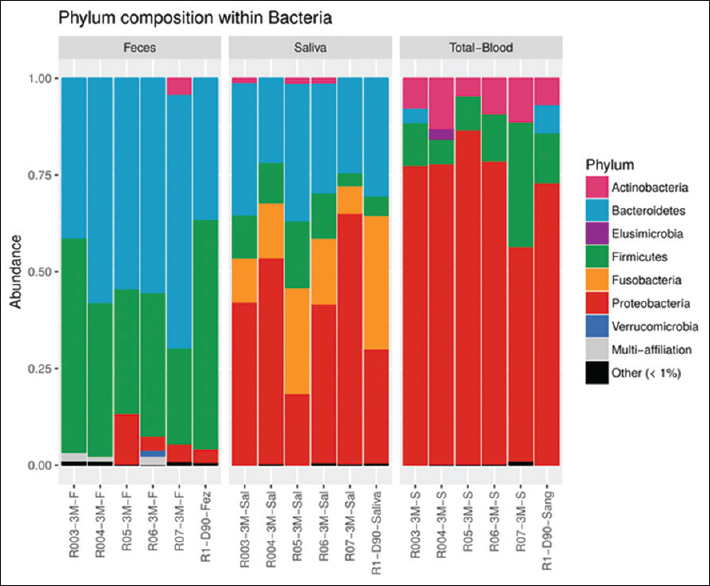
- Relative abundance of bacterial taxa at the phylum level in kidney transplant recipients. Taxa are identified by name in the plot for abundance >1%. Taxa are merged into the “Other” category only if they exist in any sample with abundance greater than 0.01%. Taxa are merged into the “Multi-affiliation” category when they can correspond to two or more different taxa
Moreover, each patient presented between three and seven different OTUs sharing the three monitored sites. It was found that 3.7% (15 OTUs) of the total OTUs were shared among the gut, oral, and blood samples within the same patient in at least one of the patients. These OTUs were classified mainly as Proteobacteria and Firmicutes, but single representative OTUs among Actinobacteria, Bacteroidetes, and Fusobacteria were also reported [Figure 2]. Among the set of 15 shared OTUs, four OTUs (1%) were present in multiple patients, which were the OTUs classified as Streptococcus (two OTUs), Pseudomonas, and multi-affiliated Enterobacteriaceae (possibly Escherichia or Enterobacter). Lactobacillus was also found to be shared among multiple samples within some patients, but the OTU was proven to be different among the tested samples, that is, saliva, blood, and feces.
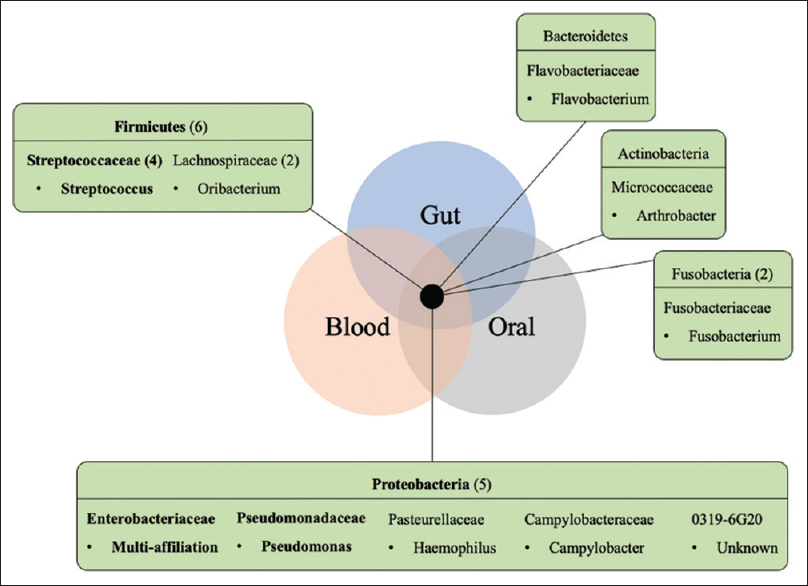
- Shared taxa among the gut, oral, and blood samples in kidney transplant recipients. A set of 15 shared OTUs found in the six kidney transplant recipients studied belong to the following represented phyla, with the respective number of OTUs per phyla or family (when higher than 1) given in parentheses. OTU taxonomy (family and respective genus) found in the three habitats of multiple patients are represented in bold. OTU = operational taxonomic unit
Discussion
We describe the blood microbiome of KTRs and clearly show distinct microbiome profiles among the gut, oral, and blood samples. A small percentage of phylotypes were found to be shared among these different human habitats, unraveling a possible mobile microbiome in stable KTR patients. Interestingly, these phylotypes included possible KTR pathogens such as Pseudomonas, Streptococcus, and classified Enterobacteriaceae. As previously reported, the gut microbiome was dominated by Bacteroidetes and Firmicutes phyla.[1213] Moreover, Fricke et al.[2] showed that the most significant changes in the human microbiome between pre- and posttransplant occurred immediately after transplantation (1 month), justifying the evaluation of KTRs 3 months after kidney transplantation, as conducted in this study. In the oral microbiome, the dominant phyla were Proteobacteria, Bacteroidetes, Fusobacteria, and Firmicutes. This composition disagrees with other studies that evaluated oral swabs in KTRs[2] and dental plaque or saliva in healthy controls,[2122] where Firmicutes, especially Streptococcus, were the most prevalent genus. More similarities were found when we analyzed the most prevalent families in the oral microbiome of the patients: Campylobacteraceae, Fusobacteriaceae, Neisseriaceae, Pasteurellaceae, Porphyromonadaceae, Prevotellaceae, Streptococcaceae. Nonetheless, other studies also reported slightly different microbiome profiles with lower levels of Firmicutes and a higher proportion of Proteobacteria and Bacteroidetes among solid-organ transplant recipients and Barrett’s esophagus patients.[623] Fricke et al.[2] reported the blood samples rarely harbored microbial components in transplant recipients. However, presently, multiple studies describe and acknowledge the presence of a distinct blood microbiome in healthy and disease-affected individuals[7811] and even report the detection of viable bacteria.[9]
Our study revealed Proteobacteria, Firmicutes, and Actinobacteria phyla as the dominant phyla in the blood microbiome profile of the KTRs. This is in line with another study that showed higher abundance of Enterobacteriaceae and Pseudomonadaceae families in the blood microbiome of nondiabetic CKD patients in comparison to healthy controls.[10]
Interestingly, a small group of shared OTUs among different human-associated environments (oral, blood, and gut) was reported in this study. Previously, 219 OTUs shared between the urine and gut samples, 193 OTUs shared between the oral and gut samples, and 16 OTUs shared between the urine and oral samples were reported.[2] The present study reports for the first time a shared, and maybe mobile, microbiome in samples collected from three different body sites (gut, blood, and oral). This finding suggests the presence of a systemic microbiome, comprising particular bacteria or bacterial DNA, which could be found in different body habitats and/or are associated with mobility throughout the human body. The full consequence of this phenomenon is still unknown, but it is possibly associated with systemic infections or colonization, and may have an impact in the microbiome, systemic inflammation, and patient blood management. Also, whatever the nature (living bacteria or bacterial DNA) of the taxa found in these three microbiomes, it may represent an interesting source of inflammation or infection risk biomarkers for KTR.
In conclusion, KTRs present a specific blood microbiome profile, different from the gut and oral habitats, but with a low proportion of phylotypes shared among different habitats that can represent a shared microbiome in KTRs and/or an interesting source of biomarkers. The clinical relevance of this observation should be further explored.
Financial support and sponsorship
Nil.
Conflicts of interest
The authors declare that they have no conflicts of interest.
Supplementary Figure 1
Supplementary Figure 1 The rarefaction curves plotted with all groups cumulatively. The rarefaction analysis curves suggest the sample diversity was captured as expected given the curves reach a plateauSupplementary Figure 2
Supplementary Figure 2 Relative proportion taxa for class Family. Taxa are identified by name in the plot for abundance >1%. Taxa are merged into the “Other” category only if it exists in any sample with abundance greater than 0.01%. Taxa are merged into the “Multi-affiliation” category when they can correspond to two or more different taxaSupplementary Figure 3
Supplementary Figure 3 Beta-diversity of the stool, saliva, and blood community at the OTU level with Bray-Curtis distance derived from 16S rRNA gene-based sequencing dataSupplementary Figure 4
Supplementary Figure 4 Alpha diversity of the stool, saliva, and blood at OTU, Family, Phylum taxonomic levels calculated with Chao1 and Shannon indexesAcknowledgements
This research was funded by Fundo Europeu de Desenvolvimento Regional (FEDER) funds through the COMPETE 2020 – Operational Programme for Competitiveness and Internationalisation (POCI), Portugal 2020, and by Portuguese funds through Fundação para a Ciência e a Tecnologia (FCT/MCTES) in the framework of the project MicroMOB “POCI-01-0145-FEDER-029777/PTDC/MEC-MCI/29777/2017.” RA was supported by Individual Call to Scientific Employment Stimulus – Second Edition (grant number CEECIND/01070/2018).
References
- The Role of the gut microbiome on chronic kidney disease. Adv Appl Microbiol. 2016;96:65-94.
- [Google Scholar]
- Human microbiota characterization in the course of renal transplantation. Am J Transplant. 2014;14:416-27.
- [Google Scholar]
- Gut microbial community structure and complications after kidney transplantation: A pilot study. Transplantation. 2014;98:697-705.
- [Google Scholar]
- Gut microbiota and tacrolimus dosing in kidney transplantation. PLoS ONE. 2015;10:e0122399.
- [Google Scholar]
- Impact of maintenance immunosuppressive therapy on the fecal microbiome of renal transplant recipients: Comparison between an everolimus- and a standard tacrolimus-based regimen. PLoS One. 2017;12:e0178228.
- [Google Scholar]
- Transplantation-associated long-term immunosuppression promotes oral colonization by potentially opportunistic pathogens without impacting other members of the salivary bacteriome. Clin Vaccine Immunol. 2013;20:920-30.
- [Google Scholar]
- Blood microbiota dysbiosis is associated with the onset of cardiovascular events in a large general population: The D. E. S. I. R. study. PLoS One. 2013;8:e54461.
- [Google Scholar]
- Comprehensive description of blood microbiome from healthy donors assessed by 16S targeted metagenomic sequencing. Transfusion. 2016;56:1138-47.
- [Google Scholar]
- Circulating microbiome in blood of different circulatory compartments. Gut. 2019;68:578-80.
- [Google Scholar]
- Blood microbiome profile in CKD: A pilot study. Clin J Am Soc Nephrol. 2019;14:692-701.
- [Google Scholar]
- Multi-method characterization of the human circulating microbiome. Front Microbiol. 2018;9:3266.
- [Google Scholar]
- Transplant associated infections-The role of the gastrointestinal microbiota and potential therapeutic options. Nephrology (Carlton). 2020;25:5-13.
- [Google Scholar]
- Fecal microbiota transplantation in a kidney transplant recipient with recurrent urinary tract infection. Infection. 2018;46:871-4.
- [Google Scholar]
- Gut microbiota dysbiosis and diarrhea in kidney transplant recipients. Am J Transplant. 2019;19:488-500.
- [Google Scholar]
- Urinary cell-free DNA is a versatile analyte for monitoring infections of the urinary tract. Nat Commun. 2018;9:2412.
- [Google Scholar]
- Urinary microbiome associated with chronic allograft dysfunction in kidney transplant recipients. Clin Transplant. 2018;32:e13436.
- [Google Scholar]
- The Characterization of novel tissue microbiota using an optimized 16S metagenomic sequencing pipeline. PLoS One. 2015;10:e0142334.
- [Google Scholar]
- Trust is good, control is better: Technical considerations in blood microbiome analysis. Gut. 2020;69:1362-3.
- [Google Scholar]
- Defining the healthy “core microbiome”of oral microbial communities. BMC Microbiol. 2009;9:259.
- [Google Scholar]
- Diversity of the oral microbiome between dentate and edentulous individuals. Oral Dis. 2019;25:911-8.
- [Google Scholar]
- Barrett's esophagus is associated with a distinct oral microbiome. Clin Transl Gastroenterol. 2018;9:135.
- [Google Scholar]


