

Translate this page into:
Effects of the mTOR Pathway on the Balance of Th2/Treg Cells in Children with Idiopathic Nephrotic Syndrome
-
Received: ,
Accepted: ,
This article was originally published by Wolters Kluwer - Medknow and was migrated to Scientific Scholar after the change of Publisher.
Abstract
Introduction:
Immune dysfunction contributes to the progression of idiopathic nephrotic syndrome (INS), but the details of the pathogenesis of progression remain unknown. This study of children with INS investigated the relationship of activation of the mechanistic target of rapamycin (mTOR) pathway (PI3K/AKT/mTOR/p70S6K) with the levels of T helper 2/regulatory T (Th2/Treg) cells.
Materials and Methods:
Twenty children with active INS (before steroid treatment), 20 children with remitting INS (INS-R, after steroid treatment), and 20 healthy control children (Ctrl) were enrolled. The levels of Th2/Treg cells in their peripheral circulatory systems were measured using flow cytometry, and the concentration of interleukin (IL)-4 was determined using a cytometric bead array (CBA). The levels of PI3K, AKT, mTOR, p70S6K, and transcription factors associated with Th2/Treg cells were measured using real-time polymerase chain reaction.
Results:
The INS group had a greater proportion of circulating Th2 cells; level of IL-4 protein; and levels of GATA, PI3K, AKT, mTOR, and p70S6K mRNAs than the Ctrl group (all P < 0.05), but a lower proportion of circulating Tregs and expression of Foxp3 (both P < 0.05). Patients in the INS-R group had normalization of these markers (all P < 0.05). Patients in the INS group had negative correlation in the percentage of Treg cells with Th2 cells and with IL-4 level and a negative correlation in the levels of GATA3 and Foxp3 mRNAs.
Conclusions:
Patients with active INS had an imbalance of Th2/Treg cells, which might result from the aberrant signaling of the mTOR pathway (PI3K/AKT/mTOR/p70S6K).
Keywords
Idiopathic nephrotic syndrome
mTOR pathway
Th2 cells
Treg cells

Introduction
Idiopathic nephrotic syndrome (INS) is the most common form of nephrotic syndrome (NS) that affects children and is the major underlying disease in childhood chronic renal failure in many populations, including China.[1] These patients experience severe proteinuria due to damage of the podocytes and foot process effacement, damage that disrupts selective glomerular permeability.[1,2] Minimal change disease (MCD) is the most frequent cause of INS, especially in patients younger than 10 years old.[2] Previous studies reported that these patients have obvious immunological disturbances, including humoral immune disorders, abnormal secretion of cytokines, and T-cell subset dysfunction (especially, T-cell imbalance).[3-8] Although immune system changes may trigger and maintain INS, the causes of these immune dysfunctions remain unknown.
Previous studies proposed that T helper type 2 (Th2) cells, which produce multiple cytokines during humoral immune responses (including interleukin [IL]-4 and IL-13), function in the pathogenesis of active INS,[7,8] although the mechanisms responsible for Th2 cell dysfunction remain unknown. Regulatory T cells (Tregs) are a type of T lymphocytes that function in maintaining the balance of immune self-tolerance and homeostasis and modulate the effector functions of T helper cells,[9,10] including Th2 cells. There is evidence that Tregs suppress Th2 cell maturation,[11] possibly due to their inhibition of IL-4 production.[12] Other studies reported that the response of Th2 cells induced apoptosis of Treg cells and inhibited their effects.[13,14] This led us to hypothesize that childhood INS is characterized by an imbalance of Th2/Treg cells, and that this imbalance may contribute to the pathogenesis of this disease.
The mechanistic target of rapamycin (mTOR), a kinase present in the mTOR complex 1 and mTOR complex 2, functions in CD4 + T-cell differentiation.[15,16] Previous studies showed that blockage of mTOR signaling prevented development of CD4 + T cells into effector cells; instead, T-cell receptor (TCR) stimulation in the absence of mTOR signaling led to the development of Treg cells.[15,16] In Th2 cells, IL-4 activates mTOR and facilitates cell cycle progression. Conversely, other studies reported that inhibition of mTOR induced the expression of forkhead box protein 3 (Foxp3) and expansion of preexisting natural Treg cells.[15,16] There is evidence that aberrant activation of the mTOR pathway may function in the pathogenesis of systemic lupus erythematosus (SLE),[17] but the function of the mTOR pathway in the differentiation of Th2/Treg cells during INS is unknown.
We compared the expression of genes in the mTOR pathway (PI3K/AKT/mTOR/p70S6K), the ratios of Th2/Treg cells, and associated factors in patients with active INS, patients with INS who were in remission, and healthy subjects. Our specific purpose was to identify the function of the mTOR pathway in INS and its effect on the differentiation of Th2/Treg cells. Our broader purpose was to identify the immune system alterations that occur during the progression of INS and possible new drug targets for treatment of this disease.
Materials and Methods
Study subjects
This study was conducted at Shenzhen Children’s Hospital (Guangdong, China) from September 2015 to October 2016 [Table 1]. The study subjects were 40 children who had INS (23 males, 17 females; median age: 38 months; age range: 22–92 months) and 20 healthy children (11 males, nine females; median age: 31.3 months; age range: 25–105 months). Patients with INS were further classified as having active INS (INS, before steroid treatment; 11 males, nine females; median age: 35 months; age range: 22–84 months) or remitting INS (INS-R, after steroid treatment; 12 males, eight females; median age: 41 months; age range: 26–92 months). Each patient was diagnosed with INS according to the 2010 guidelines from China.[18] Prednisone (2 mg/kg/day, maximum 60 mg) was used as steroid therapy. All patients were sensitive to steroid treatment, tested negative for urinary protein within 4 weeks of the first dose, and completed the entire course of treatment. The patients received no other immunosuppressants, and none of them had a secondary kidney disease or other systemic visceral syndrome. Blood samples were taken before steroid treatment (INS group) or 4 weeks after ending the steroid treatment (INS-R group). The two groups of patients were independent of each other.
| Group | Ctrl | INS | INS-R |
|---|---|---|---|
| n | 20 | 20 | 20 |
| Male/female, n (%) | 12/08 (60) | 11/09 (55) | 12/08 (60) |
| Age in months, median (range) | 31.3 (25, 105) | 35 (22, 84) | 41 (26, 96) |
| Urinary protein, g/24 h | 0.041±0.01 | 2.27±0.28a b | 0.052±0.01 |
| Serum albumin, g/L | 46.79±1.01 | 17.35±0.67a, b | 43.23±1.23 |
| Total cholesterol, mg/dL | 3.67±0.16 | 9.97±2.14a, b | 3.88±0.22 |
| Triglycerides, mg/dL | 0.78±0.01 | 2.37±0.02a, b | 0.89±0.01 |
| Serum uric acid, µmol/L | 290.2±38.9 | 336±22.5 | 269.5±29.6 |
| Urea nitrogen, mmol/L | 3.92±0.40 | 4.48±0.61 | 4.77±0.52 |
| Serum creatinine, µmol/L | 30.33±4.23 | 33.72±5.12 | 35.43±6.01 |
Ctrl=healthy control, INS=active phase idiopathic nephrotic syndrome, INS-R=remission phase INS, SEM=standard error of the mean. Data are shown as mean±SEM unless otherwise indicated. Normal (reference) values: urinary protein: <0.15 g/24 h, serum albumin: 35-55 g/L, total cholesterol <4.4 mg/dL, triglycerides <1.7 mg/dL, serum uric acid: 90-420 μmmol/L, urea nitrogen: 1.5-7.0 mmol/L, serum creatinine: 21-65 μmmol/L. aP<0.01, compared with the Ctrl group; bP<0.01, compared with the INS-R group
Before study onset, all parents or legal guardians of the study participants provided informed consent for participation of their children. The local medical ethics committee provided approval before study onset.
Blood samples
Samples of venous blood were collected in ethylenediaminetetraacetic acid (EDTA)-coated tubes and peripheral blood mononuclear cells (PBMCs) were isolated using a Ficoll density gradient before flow cytometry. Plasma samples were centrifuged and stored at −80°C before analysis using a cytometric bead array (CBA). The CBA was used to isolate CD4+CD25− T and CD4+CD25− T cells from PMBCs (11363D, Dynal; Invitrogen, San Diego, CA, USA). Flow cytometry was used to assure the cell populations were pure (>97%), and the trypan blue exclusion assay was used to assess the presence of significantly decreased cell activity (uptake by 95% or more of cells).
Extraction of total RNA and synthesis of cDNA
RNA was isolated from CD4+CD25+ T cells and CD4+CD25− T cells using the miRNeasy Mini Kit (Qiagen, Hilden Germany). Each total RNA sample was assessed for purity (OD260 nm/OD280 nm = 1.98). Then, cDNAs were synthesized using oligo-dT primers and RevertAid™ H Minus reverse transcriptase (Fermentas, Vilnius, Lithuania). Negative control (no first-strand synthesis) was constructed by reverse transcription without reverse transcriptase.
LightCycler real-time polymerase chain reaction
The cDNA levels of PI3K, AKT, mTOR, mTORC1, p70S6K, GATA3, and Foxp3 were determined using the Quantitect™ SYBR green PCR Kit (Takara, Kyoto, Japan) and LightCycler® 2.0 (Roche Molecular Biochemicals, Basel, Switzerland) using established primers [Table 2]. The second derivative maximum method was used to quantify cDNA levels (LightCycler version 3.5.30; Roche Molecular Biochemicals). The level of each target gene was expressed after normalization to GAPDH (Relative Quantification Software version 1.0; Roche Molecular Biochemicals).
| Gene | Primer sequence |
|---|---|
| PI3K | Sense: 5′-CAATGATGCTTGGCTCTGGAATGC-3′ |
| Antisense: 5′-TGTTGTCCAGCCACCATGATGTG-3′ | |
| AKT | Sense: 5′-CAGAGACCTGAAGCCGGAGA-3′ |
| Antisense: 5′-CTCCACCAATCCACAGCACG-3′ | |
| mTOR | Sense: 5′-GATTCTCACAACCCAGCGTG-3′ |
| Antisense: 5′-CGTTAAGGATCAACAAGGCT-3′ | |
| mTORC1 | Sense: 5′-CAGAAACCCTAAAGCTGCATTGTAA-3′ |
| Antisense: 5′-GTCTGTTCAGTGACCTACAAACACC-3′ | |
| p70S6K | Sense: 5′-CAGAGACCTGAAGCCGGAGA-3′ |
| Antisense: 3′-CTCCACCAATCCACAGCACG-5′ | |
| GATA3 | Sense: 5′-CAGCACAGAAGGCAGGGAGT-3′ |
| Antisense: 5′-AGGCGTTGGACAGGTAGTGTC-3′ | |
| Foxp3 | Sense: 5′-GGAAAGGAGGATGGACGAAC-3′ |
| Antisense: 5′-GCAGGCAAGACAGTGGAAAC-3′ | |
| GAPDH | Sense: 5′-CAAGAAGGTGGTGAAGCAGG-3′ |
| Antisense: 5′-AGGTGGAGGAGTGGGTGTCG-3′ |
PCR=polymerase chain reaction
Flow cytometry of Th2 and Treg cells
Flow cytometry was used to determine the expression of Th2 cell cytoplasmic markers. First, cells were grown at 37°C/5% CO2 with ionomycin (250 ng/mL; Sigma-Aldrich) and PMA (25 ng/mL; Sigma-Aldrich; MKbio, Shanghai, China). Then monensin (20 ng/mL; eBioscience, San Diego, CA, USA) was added to stimulate the cells. After 24 h, cells were fixed and permeabilized (eBioscience) and were then incubated with a phycoerythrin (PE)-conjugated anti-human IL-4 monoclonal antibody (mAb) (eBioscience, San Diego, CA, USA).
Whole blood samples were first incubated with anti-human CD4-FITC-A and anti-human CD25-APC at 4°C for 30 min for determination of the percentage of Tregs among all lymphocytes. Then cells were fixed, permeabilized, and stained with anti-human Foxp3-PE. Isotype control antibodies were used for normalization and confirmation of antibody specificity. All antibodies were from eBioscience. Stained cells were analyzed using a FACS Canto II flow cytometer (BD Biosciences, Mississauga, ON, Canada). Th2 cells were defined as IL-4+ and Treg cells as CD4+ CD25+ Foxp3+.
CBA determination of plasma IL-4
The level of IL-4 in plasma samples was determined using a CBA kit (eBioscience). Each sample was measured twice.
Statistical analysis
Statistical analysis was performed using Statistical Package for the Social Sciences (SPSS) version 22.0. Data are expressed as mean ± standard deviation. A one-way analysis of variance was used to compare multiple groups, and Student’s t-test was used to compare two groups. Pearson correlation was applied to detect correlations between different study parameters. P values below 0.05 were considered significant.
Results
Circulating Th2 and Treg cells
We used flow cytometry to determine the levels of Th2 and Treg cells in peripheral blood samples collected from the three groups of children [Figure 1]. The results indicated that the INS group had a significantly greater proportion of peripheral Th2 cells (5.04% ± 1.06%) than the Ctrl group (3.29% ± 0.88%, P < 0.01) and the INS-R group (3.46% ± 0.67%, P < 0.01). In contrast, the INS group had a significantly reduced number of Treg cells (2.60% ± 0.93%) relative to the Ctrl group (6.04% ± 1.23%, P < 0.01) and the INS-R group (5.56% ± 1.01%, P < 0.01).

- Proportion of circulating Th2 and CD4+CD25+Foxp3+ Treg cells in the three groups. (a) Flow cytometric analysis of Th2 cells. (b) Flow cytometric analysis of CD4+CD25+Foxp3+ Treg cells. (c and d) Percentages of Th2 cells and CD4+CD25+Foxp3+ Treg cells. Here and below: All data are shown as mean ± SD; *P < 0.05 and **P > 0.05. Ctrl, n = 20, INS, n = 20, and INS-R, n = 20. Ctrl = healthy control, INS = active phase idiopathic nephrotic syndrome, INS-R = remission phase INS, SD = standard deviation, Th2 = T helper type 2, Treg cells = regulatory T cells
Expression of Th2/Treg master transcription factors
GATA3 is a Th2-related master transcription factor that induces the production IL-4 in Th2 cells, and Foxp3 is a transcription factor expressed in Tregs. We performed real-time polymerase chain reaction (PCR) to measure the level of GATA3 expression in CD4+CD25− T cells and of Foxp3 in CD4+CD25+ T cells, and used enzyme-linked immunosorbent assay (ELISA) to determine the concentrations of IL-4 in plasma [Figure 2]. The results indicated that the INS group had significantly greater levels of GATA3 mRNA (9.62 ± 2.40 × 10⁻³) and plasma IL-4 (46.04 ± 21.02) than the Ctrl group (GATA3: 3.36 ± 0.97 × 10⁻³, P < 0.01; IL-4: 23.98 ± 8.16, P < 0.01) and the INS-R group (GATA3: 3.67 ± 0.10 × 10⁻³, P < 0.01; IL-4: 27.38 ± 12.53, P < 0.01). In contrast, the INS group had a significantly lower level of Foxp3 mRNA (1.0 ± 0.26 × 10⁻¹) than the Ctrl group (3.24 ± 0.87 × 10⁻¹, P < 0.01) and the INS-R group (3.04 ± 1.00 × 10 − 1, P < 0.01).
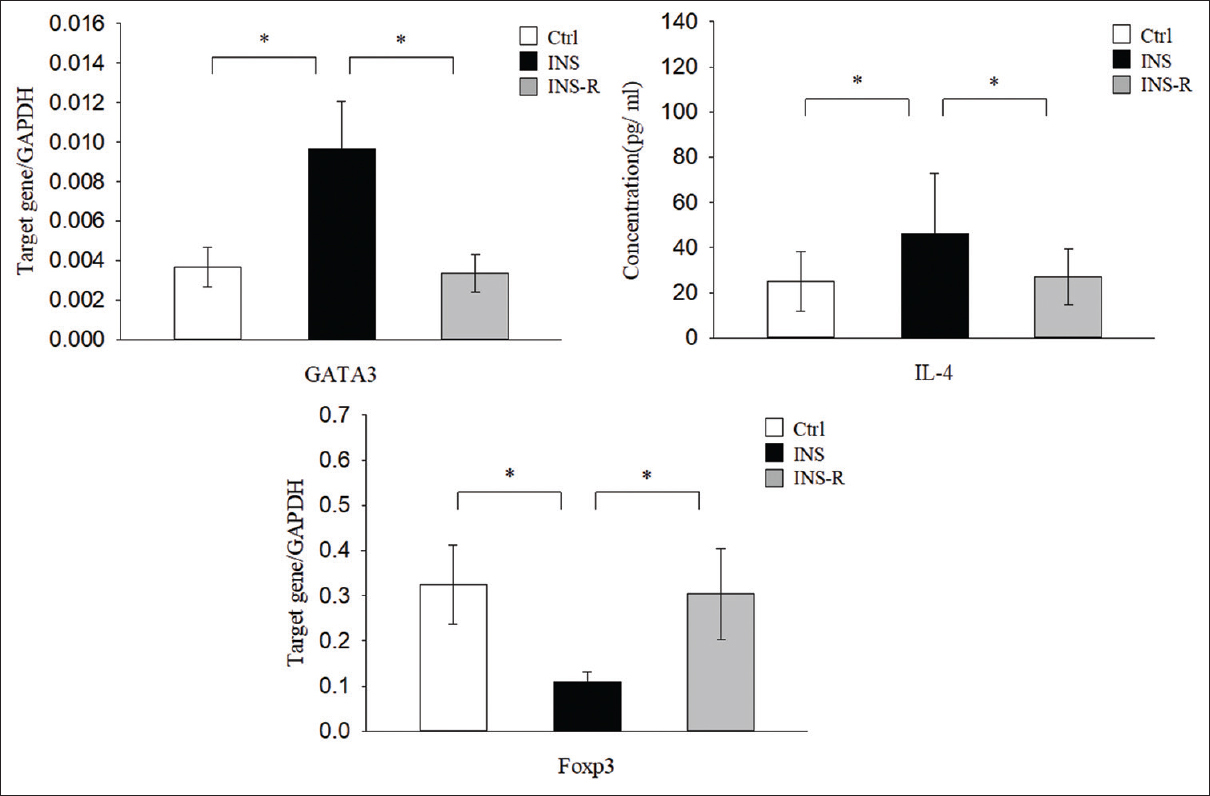
- Expression of Th2-associated factors and Treg transcription factors in the three groups. GATA3 and Treg-related factor Foxp3 were determined by real-time PCR using GAPDH as an endogenous reference. IL-4 concentration was measured using a CBA assay. CBS = cytometric bead array, IL-4 = interleukin-4, PCR = polymerase chain reaction, Th2 = T helper type 2, Treg cells = regulatory T cells
Correlation of Th2/Treg cells and associated factors in active INS
Regression analysis indicated that the percentage of peripheral blood Treg cells in the INS group was negatively correlated with the percentage of Th2 cells (r = −0.622, P < 0.01) [Figure 3a] and IL-4 level (r = −0.679, P < 0.01) [Figure 3b], and that the level of GATA3 mRNA was negatively correlated with the level of Foxp3 mRNA (r = −0.704, P < 0.01) [Figure 3c].
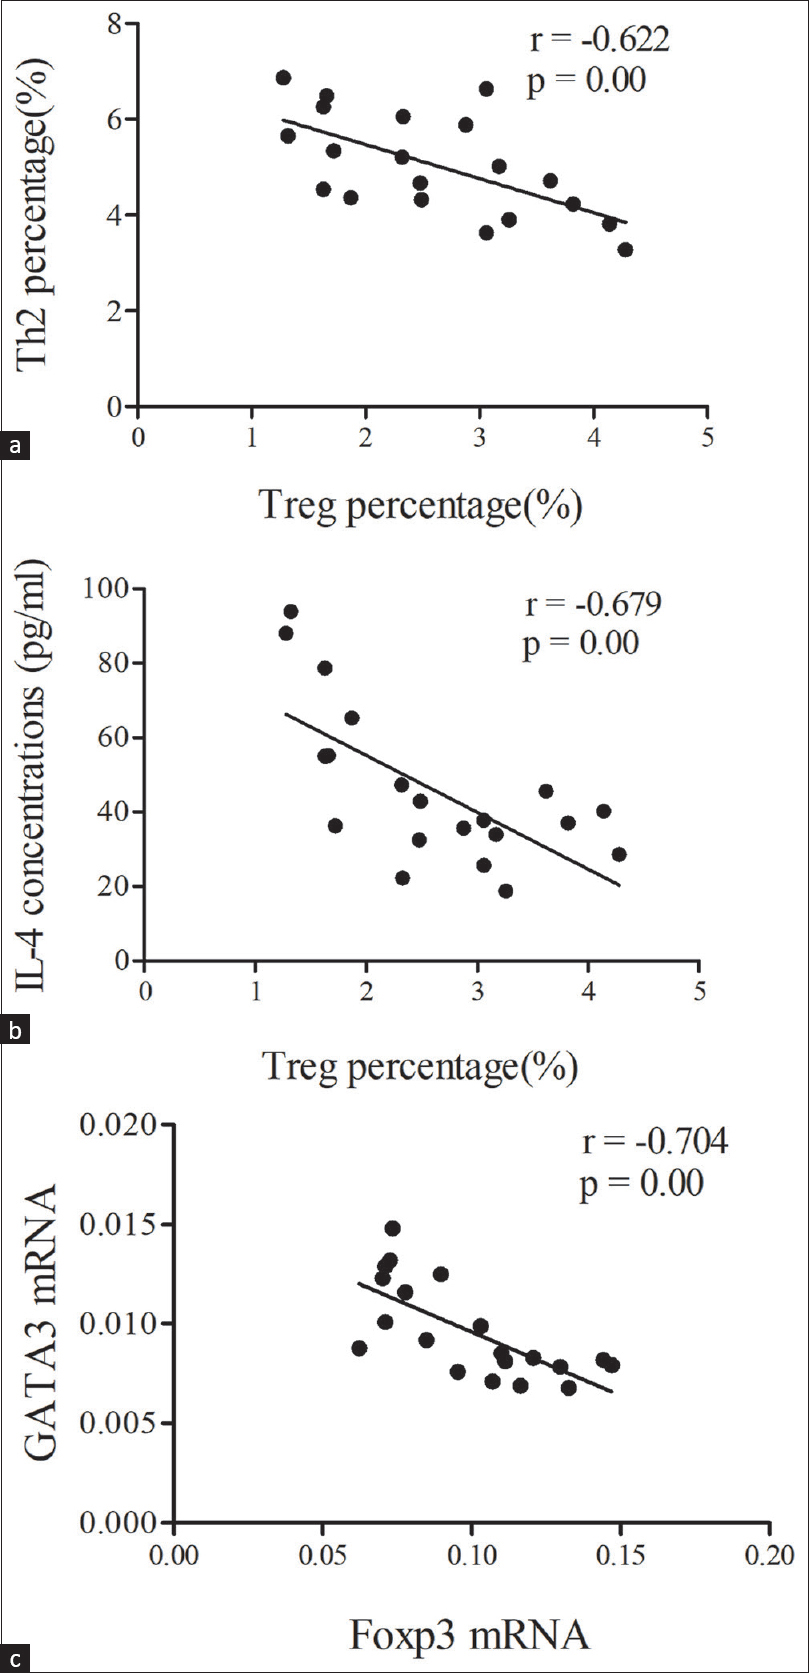
- (a) Correlation of Treg cells with Th2cells; (b) Correlation of Treg cells with IL-4 concentration; (c) Correlation of Foxp3 wtih GATA3 mRNAs in the INS group. Data were analyzed by Pearson correlation analysis. IL-4 = interleukin-4, INS = idiopathicnephrotic syndrome, Th2 = T helper type2, Treg cells = regulatory T cells
Expression of mTOR signaling molecules (PI3K/AKT/mTOR/p70S6K)
mTOR signaling regulates the differentiation of Th2 and Treg cells. We, therefore, used real-time PCR to determine the mRNA levels of genes in this signaling pathway in CD4+CD25+ T cells and CD4+CD25− T cells in the three groups of children [Figure 4]. The results indicated that the levels of PI3K, AKT, mTOR, mTORC1, and p70S6K were significantly greater in the INS group than in the Ctrl group in CD4+CD25+ T cells (all P < 0.01) and CD4+CD25− T cells (all P < 0.01), but were significantly lower in the INS-R group in the CD4+CD25+ T cells (all P < 0.01) and CD4+CD25− cells (all P < 0.01).
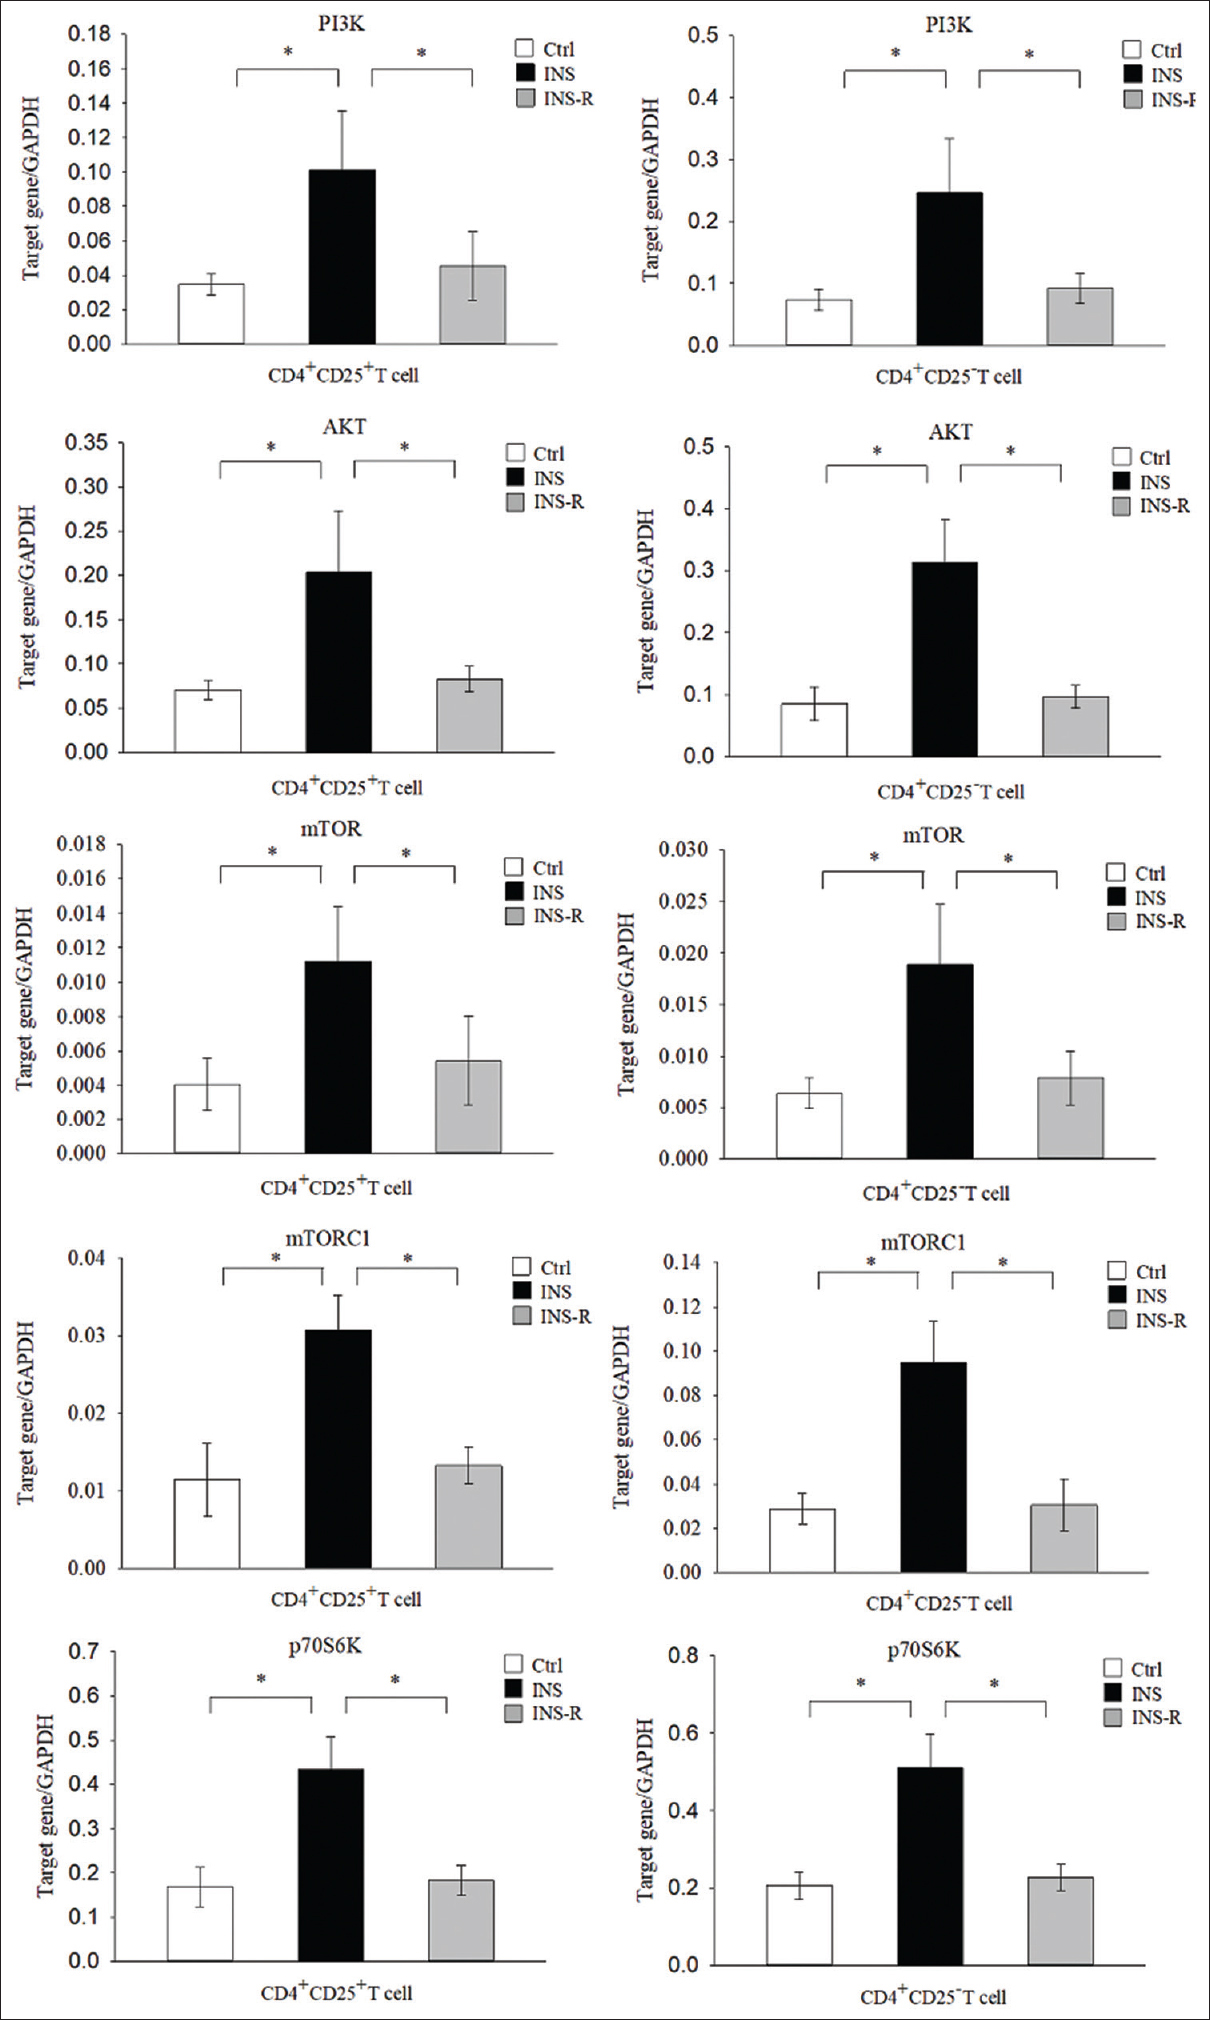
- Expression of mTOR signaling molecules in the three groups. Expression of mTOR signaling molecules (PI3K, AKT, mTOR, mTORC1, and p70S6K) was measured in purified CD4+CD25+ cells and CD4+CD25− T cells using real-time PCR with GAPDH as an endogenous reference. mTOR = mechanistic target of rapamycin, PCR = polymerase chain reaction
Discussion
There is significant evidence that dysregulation of the immune system contributes to the pathogenesis of INS,[3-8] although there are many uncertainties in its pathogenesis. Some researchers suggested that INS is caused by an abnormal response or dysregulation of T cells.[5-8] Some results provide support for the hypothesis that the pathogenesis of INS occurs as a “two-hit” mechanism. In this hypothesis, the “first hit” is glomerular damage due to microbes or their products, allergens, or T-cell cytokines (such as the Th2-related factor IL-13), which induce podocytes to overexpress CD80 and lead to increased proteinuria.[19] If a patient is otherwise healthy, Tregs produce regulatory cytokines that block CD80 overexpression, and this reduces the proteinuria.[19-21] However, if a patient has MCD, this “second hit” prevents blockage of CD80 expression, because there are dysfunctional autoregulatory responses of Tregs and podocytes. The continuously elevated level of CD80 in these patients leads to NS.[21] The presence of immune dysregulation underlines the clinical significance of the relationship of Th2/Tregs cells with NS.
Tregs can inhibit the maturation of Th2 cells,[11] possibly by reducing IL-4 production,[12] but the relationship of Treg cells and Th2 cells in INS is unclear. We, therefore, measured the levels of Th2/Treg cells and related factors in peripheral blood samples of patients with active INS, patients in remission from INS, and healthy controls. The INS group had a greater proportion of circulating Th2 cells and increased expression of IL-4, but fewer Treg cells among CD4 + CD25 + T cells. GATA3 is a zinc-finger transcription factor that functions as a master regulator of Th2 cell differentiation by controlling the expression of IL-4.[22] Foxp3 functions as a master molecule that controls the development of CD4 + CD25 + Foxp3 + Treg cells, and its inhibition in type 1 Treg cells induces a Th2-like phenotype.[23] The present study indicated that INS patients had an increased level of GATA3 and a decreased level of Foxp3. Moreover, our analysis of patients with active INS indicated a negative correlation between GATA3 and Foxp3 expression, and that the proportion of Treg cells was negatively correlated with the proportion of Th2 cells and the level of plasma IL-4 in CD4 + T cells. These results are consistent with our hypothesis that a preexisting imbalance of Th2/Treg cells might contribute to the pathogenesis of INS. However, further research is needed to identify the precise mechanisms that cause the pathological development of Th2 cells and Treg cells in patients with INS.
The mTOR pathway (PI3K/AKT/mTOR/p70S6K) has an important function in the pathogenesis of autoimmune diseases such as rheumatoid arthritis (RA), SLE, and pemphigus vulgaris (PV).[24,25] Inflammation and certain stimuli can activate PI3K, leading to phosphorylation of AKT, activation of the AKT/mTORC1 pathway,[26] and activation of its downstream effector p70S6K. Because mTORC1 targets p70S6K, the phosphorylation status of p70S6K is an indicator of mTORC1 activity.[27] In this study, we found that the expression of PI3K, AKT, mTOR, mTORC1, and p70S6K was much greater in the INS group than in the Ctrl group, but their levels were reduced in the INS-R group. This indicates that the mTOR pathway (PI3K/AKT/mTOR/p70S6K) is overactivated in active INS patients and suggests that this pathway may function in the pathogenesis of INS, although additional experiments are required for confirmation.
The PI3K/AKT/mTORC1 pathway functions in T-cell activation, cell survival, and cell proliferation following stimulation via the TCR and costimulatory molecule CD28.[28] TCR signaling through the mTOR pathway may have a critical function in Th2 cell differentiation by specific enhancement of GATA3 translation.[29] Aberrant activation of the mTOR pathway causes activation of effector T and B cells, increases the production of IL-4, and downregulates the expression of Foxp3, and thus depletes CD4+CD25+Foxp3+ Treg cells in SLE.[30] Our results indicated that patients with active INS had a greater proportion of Th2 cells, Th2-related factors, and activation of the mTOR pathway, but a reduced proportion of Treg cells and expression of Foxp3. However, these alternations were normalized in patients who were in remission due to glucocorticoid (GC) treatment. Therefore, we speculate that overactivation of the mTOR pathway (PI3K/AKT/mTOR/p70S6K) might contribute to the imbalance of Th2/Treg cells in patients with active INS.
GCs are the mainstay treatment for INS and there is evidence that they alter the pathogenesis of this disease.[31,32] Th cells secrete specific cytokines that promote immune responses, whereas GCs tamp down immune responses by blocking cytokine secretion and causing other alterations to Th cells.[33] In particular, there is evidence that GCs decrease the responsiveness of Th2 cells to IL-4.[34] Previous research reported that intravenous injection of methylprednisolone in children with lupus nephritis and severe proteinuria led to an increased level of Treg cells in their peripheral blood and to relief of proteinuria.[35] Thus, interventions that increase the level of Tregs appear to contribute to reduced proteinuria. GCs also prevent some immune-mediated diseases by increasing the number of peripheral Treg cells, but the underlying mechanism of the effect is unknown. In our study, patients in remission due to GC treatment had normalized expression of genes in the mTOR pathway and in the proportion of Th2/Treg cells. We hypothesize that GCs regulated the Th2/Treg balance in these INS patients by inhibiting the mTOR pathway. Although further studies of the detailed mechanisms are required, our novel findings provide a new understanding of the immunoregulatory effects of GCs in the treatment of INS.
In summary, our results suggested that activation of the mTOR pathway (PI3K/AKT/mTOR/p70S6K) may have an important function in the pathogenesis of INS and regulating the balance of Th2/Treg cells. We also found that GC treatment led to normalization of the ratio of Th2/Treg cells. Due to our small sample size, short study period, and cross-sectional study design, our results require further confirmation. Further longitudinal studies should examine the role of the mTOR pathway on the balance of Th2/Treg cells in INS, and more experiments are required to examine the effect of steroids, specifically on mTOR pathways.
Declaration of patient consent
The authors certify that they have obtained all appropriate patient consent forms. In the form, the patients have given their consent for their images and other clinical information to be reported in the journal. The patients understand that their names and initials will not be published, and due efforts will be made to conceal their identity, but anonymity cannot be guaranteed.
Financial support and sponsorship
Supported by Shenzhen Fund for Guangdong Provincial High-level Clinical Key Specialties (No.SZGSP012) and Project of Shenzhen Children’s Hospital (no. ynkt2020-zz11).
Conflicts of interest
There are no conflicts of interest.
Acknowledgements
This study was supported by grants from Shenzhen Children’s Hospital (no. ynkt2020-zz11). The authors are also grateful to the patients and healthy volunteers who participated in this study.
References
- [Analysis of 1268 patients with chronic renal failure in childhood: A report from 91 hospitals in China from 1990 to 2002] Zhonghua Er Ke Za Zhi. 2004;42:724-30.
- [Google Scholar]
- Molecular and cellular mechanisms for proteinuria in minimal change disease. Front Med (Lausanne). 2018;5:170.
- [Google Scholar]
- Pediatric patients with steroid-sensitive nephrotic syndrome have higher expression of T regulatory lymphocytes in comparison to steroid-resistant disease. Front Pediatr. 2019;7:114.
- [Google Scholar]
- Differential alteration in peripheral T-regulatory and T-effector cells with change in P-glycoprotein expression in childhood nephrotic syndrome:A longitudinal study. Cytokine. 2015;72:190-6.
- [Google Scholar]
- Coincident activation of Th2 T cells with onset of the disease and differential expression of GRO-gamma in peripheral blood leukocytes in minimal change disease. Am J Nephrol. 2007;27:253-61.
- [Google Scholar]
- Th2 cells predominate in idiopathic steroid-sensitive nephrotic syndrome. Clin Exp Nephrol. 2010;14:578-83.
- [Google Scholar]
- Cytokine signaling in the development and homeostasis of regulatory T cells. Cold Spring Harb Perspect Biol. 2018;10:a028597.
- [Google Scholar]
- CD4+CD25+ regulatory T cells suppress differentiation and functions of Th1 and Th2 cells leishmania major infection and colitis in mice.J Immunol. . 2003;170:394-9.
- [Google Scholar]
- The early IL-4 response to Leishmania major and the resulting Th2 cell maturation steering progressive disease in BALB/c mice are subject to the control of regulatory CD4+CD25+T cells. J Immunol. 2002;169:3232-41.
- [Google Scholar]
- Foxp3+regulatory T cells exert asymmetric control over murine helper responses by inducing Th2 cell apoptosis. Blood. 2011;118:1845-53.
- [Google Scholar]
- Central role of defective interleukin-2 production in the triggering of islet autoimmune destruction. Immunity. 2008;28:687-97.
- [Google Scholar]
- Regulation and function of mTOR signalling in T cell fate decisions. Nat Rev Immunol. 2012;12:325-38.
- [Google Scholar]
- mTOR signaling in the differentiation and function of regulatory and effector T cells. Curr Opin Immunol. 2017;46:103-11.
- [Google Scholar]
- Advances in systemic lupus erythematosus pathogenesis via mTOR signaling pathway. Semin Arthritis Rheum. 2020;50:314-20.
- [Google Scholar]
- [Evidence-based guidelines on diagnosis and treatment of childhood common renal diseases. (I) Evidence-based guideline on diagnosis and treatment of steroid-sensitive, relapsing/steroid-dependent nephrotic syndrome (for trial implementation)] Zhonghua Er Ke Za Zhi. 2009;47:167-70.
- [Google Scholar]
- Idiopathic nephrotic syndrome and atopy:Is there a common link? Am J Kidney Dis. 2009;54:945-53.
- [Google Scholar]
- Minimal change disease:A “two-hit”podocyte immune disorder? Pediatr Nephrol. 2011;26:645-9.
- [Google Scholar]
- T regulatory cell function in idiopathic minimal lesion nephrotic syndrome. Pediatr Nephrol. 2009;24:1691-8.
- [Google Scholar]
- Inhibition of the transcription factor Foxp3 converts desmoglein 3-specific type 1 regulatory T cells into Th2-like cells. J Immunol. 2006;176:3215-22.
- [Google Scholar]
- Activation of mTOR (mechanistic target of rapamycin) in rheumatic diseases. Nat Rev Rheumatol. 2016;12:169-82.
- [Google Scholar]
- mTOR pathway regulates the differentiation of peripheral blood Th2/Treg cell subsets in patients with pemphigus vulgaris. Acta Biochim Biophys Sin (Shanghai). 2021;53:438-45.
- [Google Scholar]
- PI (3,4,5) P3 and PI (3,4) P2 levels correlate with PKB/akt phosphorylation at Thr308 and Ser473, respectively;PI (3,4) P2 levels determine PKB activity. Cell Signal. 2008;20:684-94.
- [Google Scholar]
- Differential impact of mammalian target of rapamycin inhibition on CD4+CD25+Foxp3+regulatory T cells compared with conventional CD4+T cells. Blood. 2008;111:453-62.
- [Google Scholar]
- PI3K-Akt-mTORC1-S6K1/2 axis controls Th17 differentiation by regulating Gfi1 expression and nuclear translocation of RORg. Cell Rep. 2012;1:360-73.
- [Google Scholar]
- TCR-dependent translational control of GATA-3 enhances Th2 differentiation. J Immunol. 2010;185:3209-16.
- [Google Scholar]
- CaMK4-dependent activation of AKT/mTOR and CREM-a underlies autoimmunity-associated Th17 imbalance. J Clin Invest. 2014;124:2234-45.
- [Google Scholar]
- Effect of proinflammatory cytokines (IL-6, TNF-α, and IL-1β) on clinical manifestations in Indian SLE patients. Mediators Inflamm. 2014;2014:385297.
- [Google Scholar]
- Determination and clinical significance analysis of IL-6, TNF-α and TGF-β_1 in the patients with diabetic nephropathy. Chin J Immunol. 2002;333:556.
- [Google Scholar]
- A gradient of glucocorticoid sensitivity among helper T cell cytokines. Cytokine Growth Factor Rev. 2016;31:27-35.
- [Google Scholar]
- Glucocorticoids inhibit IL-4 and mitogen-induced IL-4R alpha chain expression by different posttranscriptional mechanisms. J Allergy Clin Immunol. 1998;102:968-76.
- [Google Scholar]
- Profile of human β-defensins 1,2 and proinflammatory cytokines (TNF-α, IL-6) in patients with chronic kidney disease. Kidney Blood Press Res. 2013;37:602-10.
- [Google Scholar]


