

Translate this page into:
Hemato-Renal Profile of Proliferative Glomerulonephritis with Monoclonal Immunoglobulin Deposits
 , Sabina Yusuf1, Athul Thomas1, Vinoi George David1, Santosh Varughese1, Suceena Alexander1,
Corresponding author: Suceena Alexander, Department of Nephrology, Christian Medical College Vellore, Ranipet Campus, Ranipet, India, E-mail: suceena@gmail.com
-
Received: ,
Accepted: ,
How to cite this article: Johny J, John EE, Roy S, Alam R, Mani SSR, Jose N, et al. Hemato-Renal Profile of Proliferative Glomerulonephritis with Monoclonal Immunoglobulin Deposits. Indian J Nephrol. 2025;35:355-67. doi: 10.25259/ijn_489_23
Abstract
Background
Proliferative glomerulonephritis with monoclonal immunoglobulin deposits (PGNMID) is a rare entity classified under the umbrella of monoclonal gammopathy of renal significance. The clinical implications of circulating monoclonal immunoglobulin (MIg), light chain restriction on immunofluorescence (IF) microscopy, histopathological pattern, and type of therapy on renal outcomes are not clearly defined.
Materials and Methods
Sixteen patients of PGNMID diagnosed between 2013 and 2020 were included from a biopsy registry of 11,459 patients at a single center. Follow-up data was collected from electronic medical records until June 2021.
Results
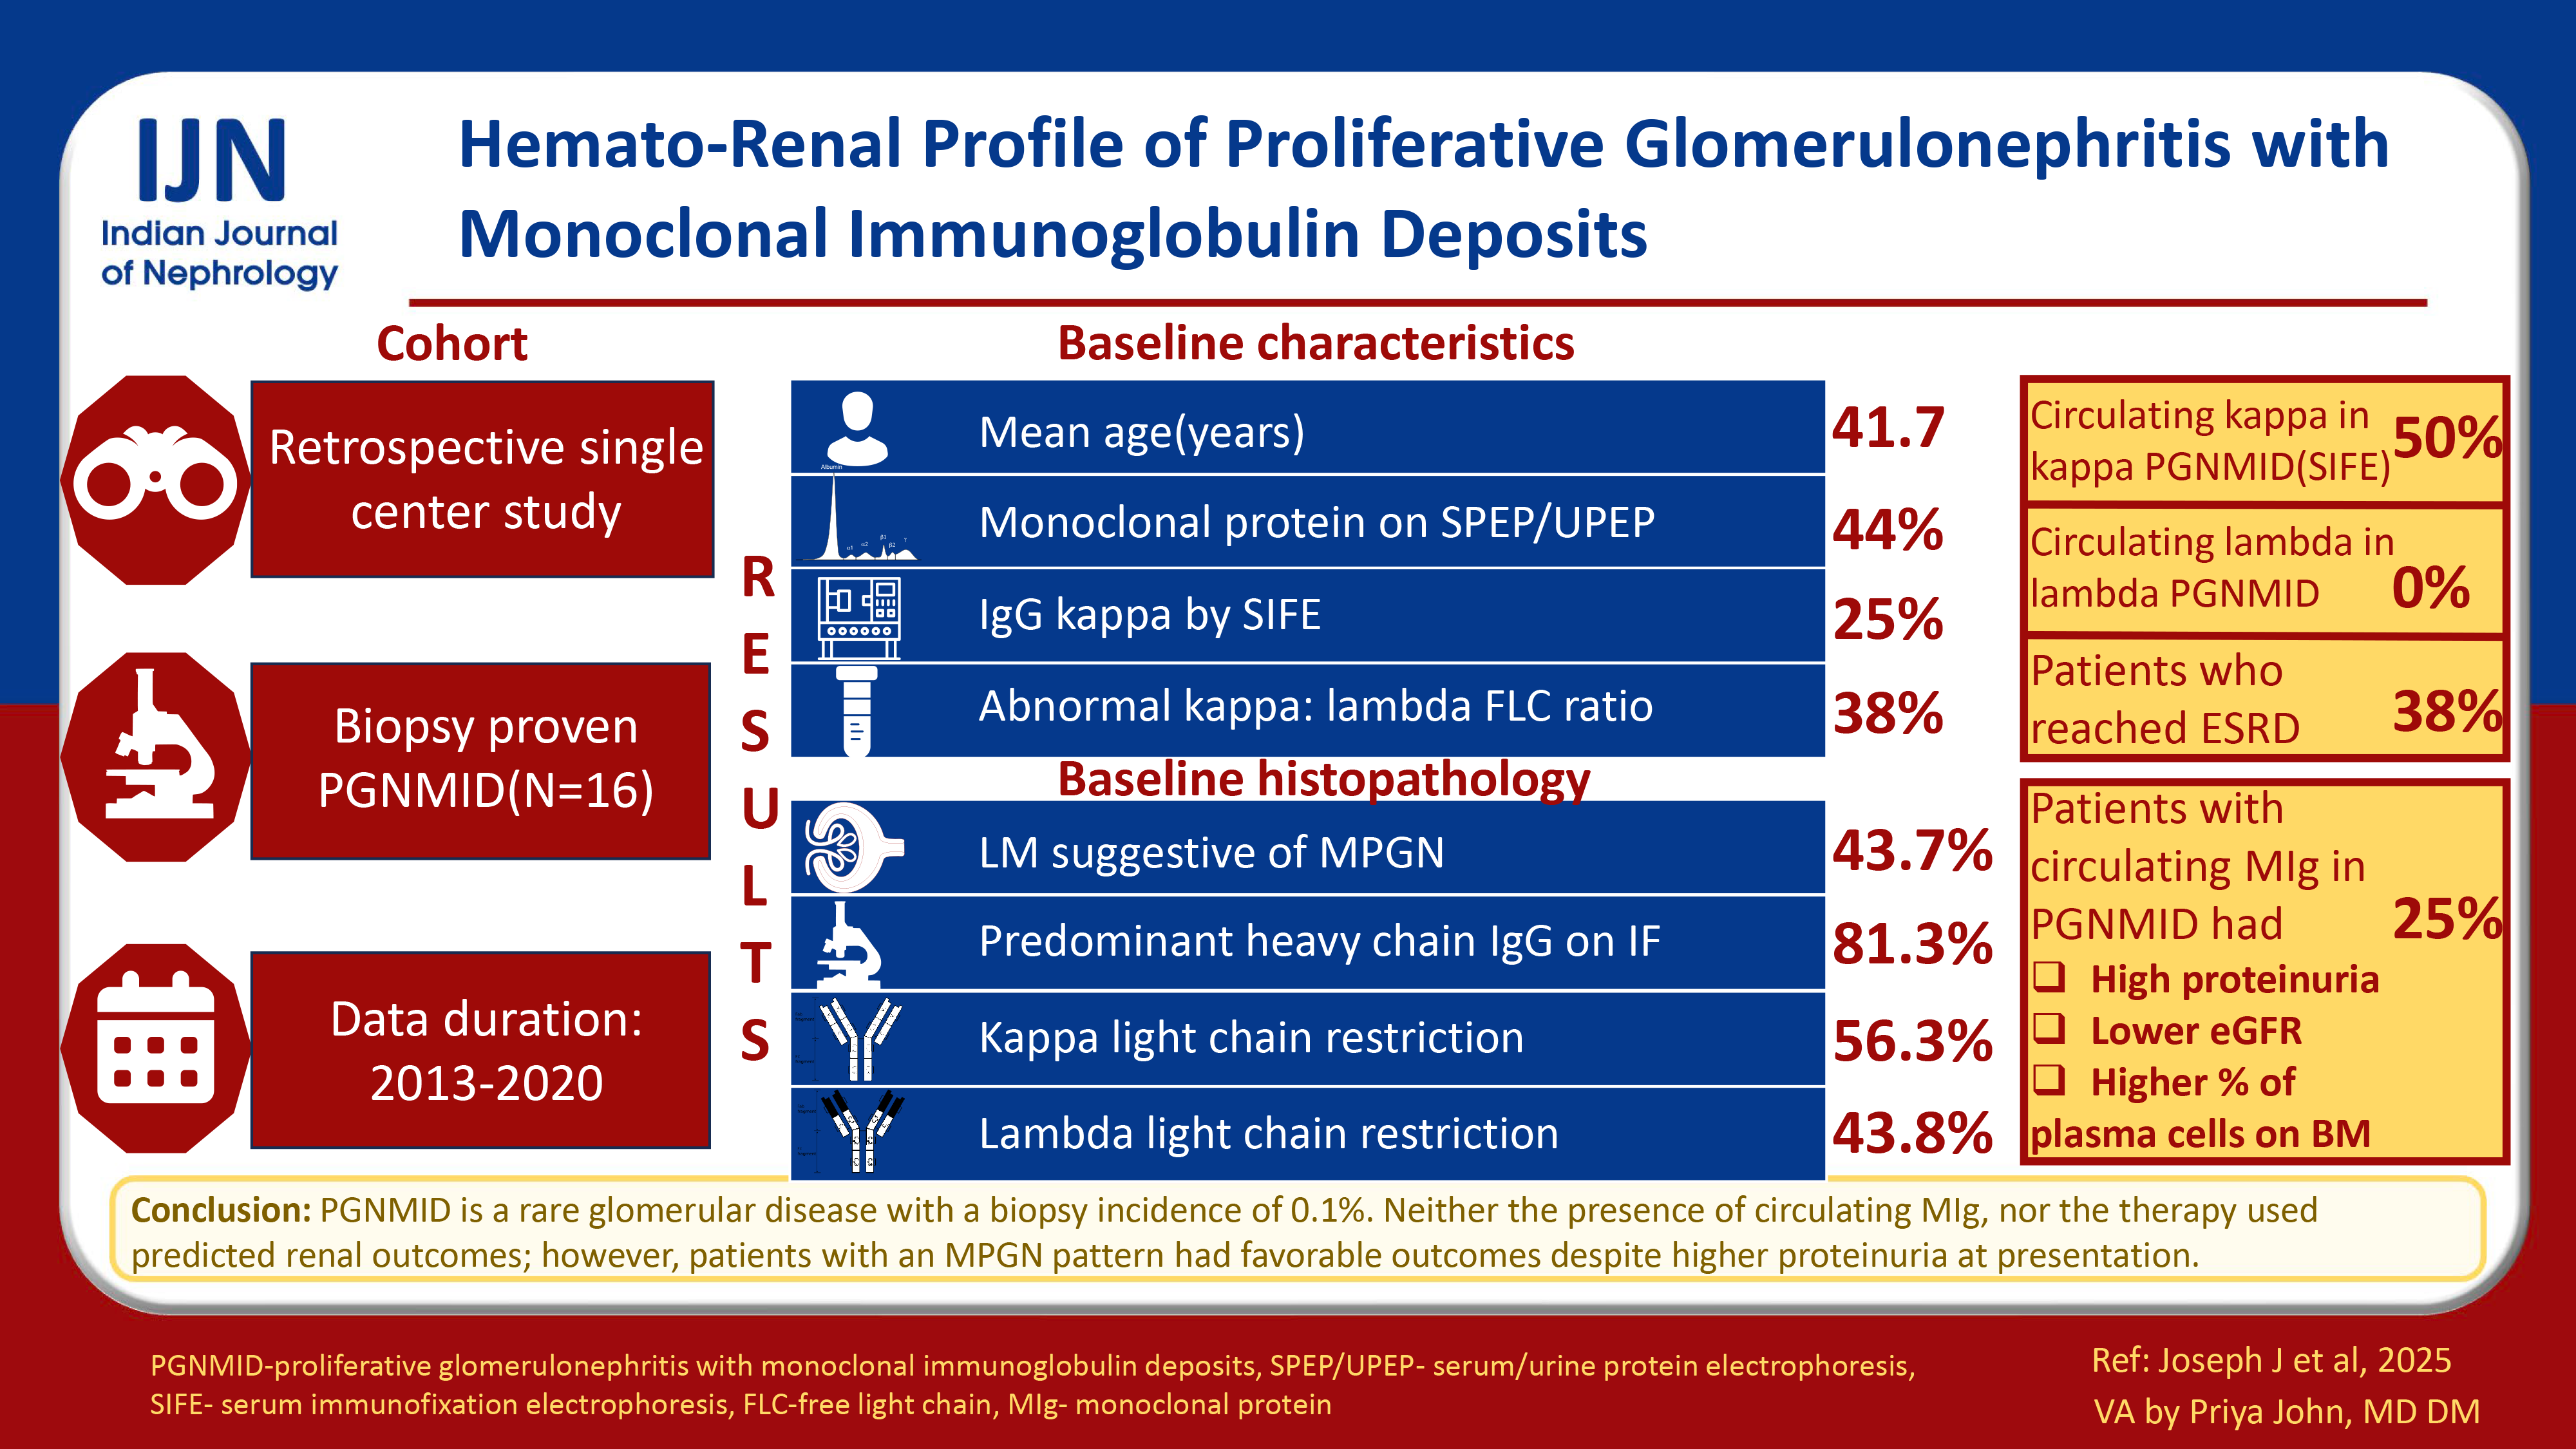
The mean age of the cohort was 41.7 ± 13.5 years. Forty-four (7/16) percent showed monoclonal protein on serum or urine electrophoresis, 25% (3/12) had IgG kappa by serum immunofixation electrophoresis (IFE) and 38% (5/13) had abnormal kappa: lambda free light chain (FLC) ratio. The predominant light microscopy pattern, membranoproliferative glomerulonephritis (MPGN) was seen in 7/16 (43.7%) patients. The predominant heavy chain detected by IF microscopy was IgG (13/16, 81.3%). Kappa and lambda light chain restriction were seen in 56.3 (9/16) and 43.8 (7/16) percent of patients respectively. Circulating monoclonal kappa light chains were detected in 50 and 29% of kappa-PGNMID patients by IFE and FLC assay respectively. None of the lambda-PGNMID patients had detectable circulating monoclonal lambda light chains. Patients with circulating MIg had more proteinuria, lower estimated glomerular filtration rate, and a higher percentage of plasma cells on bone marrow biopsy. Thirty-eight percent of our cohort (5/13) progressed to kidney failure over a median (range) period of 3 (IQR, 1-7) months. Of these, 4/5 received immunosuppression, and 1/5 were treated with plasma cell-targeted chemotherapy.
Conclusion
PGNMID is a rare disease with a biopsy incidence of 0.1%. Only a quarter of patients with PGNMID have circulating MIg. Presence of circulating MIg, type of monoclonal light chain restriction in kidney biopsy, and type of therapy did not predict renal outcomes. Patients with MPGN pattern had favorable renal outcomes despite a higher degree of proteinuria at presentation.
Keywords
Electrophoresis
Glomerulonephritis
Immunoglobulin
Nephrotic syndrome
Plasma cells

Introduction
Proliferative glomerulonephritis with monoclonal immune deposits (PGNMID) is an immune complex glomerulonephritis with monoclonal immunoglobulin deposits within glomeruli.1 These deposits are characterized by electron microscopy (EM) as nonorganized and electron-dense located in subendothelial, mesangial, or subepithelial regions.2 A quarter to one-third of patients progress to kidney failure despite immunosuppression.3 A circulating monoclonal immunoglobulin detected by immunofixation electrophoresis (IFE) or serum free light chain (FLC) assay or a nephropathic clone detected by flowcytometry is seen in only 25–30% of cases.3,4 This study reports the hemato-renal profile of PGNMID patients at a tertiary care center and aims to determine the clinical implications of circulating monoclonal immunoglobulin (MIg), histopathological pattern and type of monoclonal light chain restriction in kidney biopsy, and type of therapy on renal outcomes.
Materials and Methods
This was an observational retrospective biopsy registry cohort [Glomerular Research and Clinical Experiments—Proliferative Glomerulonephritis with Monoclonal Immunoglobulin Deposits (GRACE-PGNMID)] done among out- and inpatient services of the Department of Nephrology at Christian Medical College, Vellore. Consent was waived as it was retrospective data collection from electronic medical records. In total, 11,459 native adult kidney biopsies were performed between January 2013 and December 2020, of which 16 cases met the following diagnostic criteria of PGNMID (biopsy incidence of 0.1%) [Supplemental Figure 1]:
-
1.
Light microscopy (LM) showing a proliferative pattern like membranoproliferative or endocapillary proliferative or mesangioproliferative glomerulonephritis.
-
2.
Immunofluorescence (IF) staining for a single light chain (kappa or lambda) and heavy chain (gamma, alpha or mu) isotype indicating monoclonality.
-
3.
Granular electron-dense deposits with no substructure in mesangial, subendothelial, and/or subepithelial locations by EM.
-
4.
Absence of clinical and laboratory evidence of cryoglobulinemia.
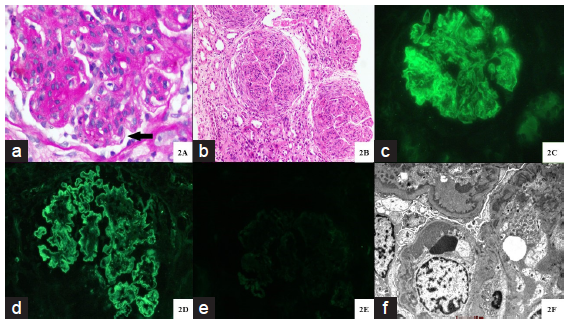
- Histopathology of proliferative glomerulonephritis with monoclonal immunoglobulin deposits. (a) Glomerulus with marked mesangial expansion, mesangial hypercellularity, segmental endocapillary hypercellularity and segments of irregular capillary wall thickening with reduplication (bold black arrow) (Periodic acid schiff stain; original magnification X 400). (b) Three glomeruli with circumferential cellular crescents with underlying glomerular capillary tuft showing global endocapillary hypercellularity with lobular accentuation. Adjacent interstitium shows edema with severe acute tubular injury. (Hematoxylin and eosin stain; original magnification X 100). (c-e) Immunofluorescence microscopy displaying global, granular capillary wall, along with mesangial staining for IgG (4+ intensity) (c) and kappa light chain (4+ intensity) (d). There is no staining for lambda light chain (e). (original magnification X 400). (f) Ultrastructural examination displaying abundant large subendothelial electron dense immune complex type deposits along with concomitant mesangial deposits. Podocytes show global effacement. A diagnostic substructure is not evident. (Transmission electron microscopy, original magnification X 6000).
Baseline assessments and treatment
Data on demographic profiles, clinical features, histopathological variables, treatment details, morbidity, and mortality were retrieved from electronic patient records. Proteinuria was assessed from 24-hour timed collection. Estimated glomerular filtration rate (eGFR) was calculated by Chronic Kidney Disease Epidemiology Collaboration (CKD-EPI) equation.
All kidney biopsy specimens were processed for LM, IF, and EM. Serial 3-μm-thick sections were stained for hematoxylin and eosin, periodic acid Schiff reagent, Masson’s trichrome, and Jones’ methenamine silver for LM. Four-micrometer cryostat sections were stained with fluorescein-tagged polyclonal rabbit anti-human antisera specific to IgG, IgA, and IgM; complement factors C3, C4, and C1q; and kappa and lambda light chains (Dako, Carpinteria) for IF. The IF staining intensity was semi-quantitatively evaluated and graded from 0 to 3+. Ultrastructural examination was done with Tecnai T12 Spirit electron microscope.
Bone involvement was assessed by skeletal survey (X-rays) of skull, pelvis, and spine in all patients. Magnetic resonance imaging (MRI) and positron emission tomography and computed tomography (PET-CT) scans were not done in any patients. Bone marrow aspiration and biopsy was done in 14 out of 16 patients. Immunohistochemistry (IHC) of marrow plasma cells for kappa and lambda light chains was done in 12 out of 14 patients who underwent bone marrow biopsy. All patients underwent both serum and urine electrophoresis. Serum IFE and FLC assays were done in 12 out of 16 and 13 out of 16 patients, respectively. Circulating MIg was defined as presence of monoclonal heavy and/or light chain by IFE. Following cut-offs for kappa: lambda FLC ratio was used: 0.26–1.65 (eGFR >60 mL/min/1.73 m2), 0.46–2.62 (eGFR 45–60 mL/min/1.73 m2), 0.48–3.38 (eGFR 30–44 mL/min/1.73 m2) and 0.54–3.30 (eGFR <30 mL/min/1.73 m2).5
Follow-up
Follow-up data was collected until June 2021. Complete remission (CR) was defined as proteinuria ≤ 0.5 g/day and last visit eGFR >90 mL/min/1.73 m2 or return to pre-morbid eGFR level. Partial remission (PR) was defined as a reduction in proteinuria by at least 50% and to <2 g/day with stable renal function (decrease in eGFR not exceeding 25% from biopsy time and last visit eGFR >15 mL/min/1.73 m2). Kidney failure was defined as last visit eGFR ≤15 mL/min/1.73 m2 or initiation of renal replacement therapy (RRT). Persistent renal dysfunction (PRD) was defined as failure to meet either CR, PR, or kidney failure.4
Statistical analysis
Data was presented as mean ± standard deviation (SD) or median (inter-quartile range [IQR]) or frequency (percentages) according to types and distribution of variables. ‘Likewise or case deletion’ approach was used to handle missing data. Differences among groups of normally distributed variables were analyzed by t-test. Differences among groups of nonparametric variables were analyzed by Mann–Whitney U test or the Kruskal–Wallis test. Categoric variables were compared using Pearson’s chi-squared test or Fisher’s exact test. Statistical analysis was performed using Statistical Package for Social Sciences software for Windows version 21.0 (SPSS Inc., Chicago, IL). A p-value of <0.05 was taken as significant.
Results
Baseline demographic and clinical characteristics
The mean age of the cohort was 42 ± 13.5 years with a male: female ratio of 1:1 [Table 1]. Three-fourths of the cohort had hypertension at presentation. The most common renal symptom was peripheral edema (94%). None of the patients had any extra-renal manifestations. Non-visible hematuria and nephrotic range proteinuria were seen in 87.5% (14/16) and 81.3% (13/16) of patients, respectively. The median eGFR at the time of kidney biopsy was 35.5 (IQR, 24–74.6) mL/min/1.73 m2 with one patient (6.3%) requiring RRT. Hypocomplementemia (low C3) was seen in 37.5% (6/16) of patients.
| Baseline characteristics at kidney biopsy |
Entire cohort (N = 16) |
|---|---|
| Baseline demographic and clinical characteristics | |
| Age, years | 41.7 ± 13.5 |
| Gender (n, %) | |
| Males | 8 (50) |
| Females | 8 (50) |
| Body mass index, kg/m2 | 23.9 ± 4.7 |
|
Comorbidities |
|
|
Diabetes mellitus (n, %) |
2 (12.5) |
|
Hypertension (n, %) |
12 (75) |
|
Systolic BP, mmHg |
137.8 ± 16.5 |
|
Diastolic BP, mmHg |
85 ± 11.1 |
|
Hypothyroidism (n, %) |
5 (31.3%) |
|
Renal manifestations (n, %) |
|
|
Edema |
15 (93.8) |
|
Oligo-anuria |
1 (6.3) |
|
Dyspnea |
3 (18.8) |
|
Visible hematuria |
0 |
|
Systemic manifestations (n, %) |
|
|
Fever |
1 (6.3) |
|
Bone pain |
0 |
|
Urine abnormalities (n, %) |
|
|
Non-visible hematuria |
14 (87.5) |
|
Leucocyturia |
8 (50) |
|
Casts |
6 (37.5) |
| Serum albumin, g/dL (mean ± SD) | 2.6 ± 0.6 |
| 24-hour urine protein, g/day [Median (IQR)] | 5.6 (3.9–8.9) |
|
Kidney function |
|
|
Baseline creatinine, mg/dL [Median (IQR)] |
1.3 (0.9–1.6) |
|
Serum creatinine at biopsy, mg/dL [Median (IQR)] |
1.9 (1–2.9) |
|
eGFR CKD-EPI at biopsy, mL/min/1.73 m2 [Median (IQR)] |
35.5 (24–74.6) |
|
Renal replacement therapy at biopsy, yes (n, %) |
1 (6.3) |
|
Serology (n, %) |
|
|
Low C3 |
6 (37.5) |
|
Low C4 |
0 |
|
ANA† |
1 (6.3) |
|
dsDNA |
0 |
|
Cryoglobulin |
0 |
|
HBsAg |
0 |
|
Anti-HCV antibody |
0 |
|
HIV |
0 |
|
MPO-ANCA† |
0 |
|
PR3-ANCA† |
0 |
| Baseline hematological parameters | |
| Hemoglobin, g/dL | 10.3 ±1.7 |
| Lytic bone lesions (n, %) | 0 |
| Hypercalcemia (n, %)† | 1 (7.7) |
|
Protein electrophoresis |
|
|
Serum protein electrophoresis |
|
|
M protein, yes (n, %) |
6 (37.5) |
|
Quantification of M protein, g/L [median (IQR)] |
10 (1–27) |
|
Urine protein electrophoresis (n, %) |
|
|
M protein, yes (n, %) |
3 (18.8) |
|
Serum or urine protein electrophoresis (%) |
|
|
M protein, yes (n, %) |
7 (43.8) |
|
Serum immunofixation electrophoresis (n, %)† |
|
|
Normal |
9 (75) |
|
IgG kappa |
3 (25) |
|
Serum free light chain assay† |
|
|
Serum kappa FLC, mg/dL [median (IQR)] |
100 (45–122) |
|
Serum lambda FLC, mg/dL [median (IQR)] |
50 (37.3–64.4) |
|
Serum kappa: lambda FLC ratio [median (IQR)] |
2.4 (1–2.5) |
|
Abnormal kappa: lambda FLC ratio†† (n, %) |
5 (38.5%) |
| Bone marrow examination† | |
| Plasma cells, % [median (IQR)] | 1 (0–4.5) |
| Plasma cells > 10% | 1 (7.6) |
| Immunohistochemistry† | |
| No restriction | 12 (100) |
| Kappa restriction | 0 |
| Lambda restriction | 0 |
ANA: Antinuclear antibody, BP: Blood pressure, IQR: Inter-quartile range, CKD-EPI: Chronic kidney disease epidemiology, dsDNA: Double stranded DNA, eGFR: Estimated glomerular filtration rate, GRACE-PGNMID: Glomerular research and clinical experiments-proliferative Glomerulonephritis with monoclonal immunoglobulin deposits, FLC: Free light chain, HBsAg: Hepatitis B surface antigen, HCV: Hepatitis C virus, HIV: Human immunodeficiency virus, MPO-ANCA: Myeloperoxidase-antineutrophil cytoplasmic antibody, PR3-ANCA: Proteinase 3-antineutrophil cytoplasmic antibody. †Evaluable patients (N) for ANA = 15, ANCA serology = 14, hypercalcemia = 13, serum immunofixation electrophoresis = 12, serum free light chain assay = 13, bone marrow examination = 13, bone marrow immunohistochemistry = 12. ††Normal kappa: lambda FLC ratio: 0.26–1.65 (eGFR > 60 mL/min/1.73 m2), 0.46–2.62 (eGFR 45–60 mL/min/1.73 m2), 0.48–3.38 (eGFR 30–44 mL/min/1.73 m2) and 0.54–3.30 (eGFR <30 mL/min/1.73 m2)
Baseline hematological parameters
Hypercalcemia, renal dysfunction, anemia, and lytic bone lesions were seen in 7.6% (1/13), 37.5% (6/16), 50% (8/16), and 0% (none of 16) of patients, respectively [Table 1]. Forty-four percent (7/16) of patients had a detectable monoclonal (M) protein by either serum or urine protein electrophoresis. However, only one of these seven (14.3%) patients had M protein quantification >30 g/L. IgG kappa was detected in serum by IFE in 3/12 (25%) patients. Thirty-eight percent (5/13) of patients had an elevated kappa: lambda FLC ratio. Bone marrow plasmacytosis >10% occurred in only one of 14 patients (7.1%). Light chain restriction of marrow plasma cells was not seen in any of the tested patients.
Baseline histopathological parameters
The mean ± SD number of glomeruli was 14.4 ± 6.4 [Table 2]. The predominant light microscopy pattern was membranoproliferative glomerulonephritis (MPGN) (7/16, 43.7%) [Figure 1a]. Twenty five percent patients (4/16) had crescents, though only one patient had crescents in >50% of glomeruli [Figure 1b]. Chronic lesions like arteriosclerosis and moderate-to-severe interstitial fibrosis and tubular atrophy (IFTA) were present in the majority of patients (14/16, 87.5%).
| Baseline histopathological characteristics | Entire cohort |
|---|---|
| Light microscopy (N = 16) | |
| Number of glomeruli | 14.4 ± 6.4 |
| Globally sclerosed glomeruli [median (IQR)] | 22.2 (7.7-33.3) |
| Glomerular lesions (n, %) | |
| Light microscopy pattern | |
| Membranoproliferative glomerulonephritis | 7 (43.8) |
| Mesangial proliferation | 5 (31.3) |
| Diffuse endocapillary proliferation | 2 (12.5) |
| Focal endocapillary proliferation | 2 (12.5) |
| Crescents | 4 (25) |
| Focal (<50%) | 3 (18.7) |
| Diffuse (>50%) | 1 (6.2) |
| Tuft necrosis | 1 (6.3) |
| Glomerular neutrophil infiltration | 6 (37.5) |
| Diabetic glomerulosclerosis | 0 |
| Tubular lesions (n, %) | |
| Acute tubular injury | 5 (31.3) |
| Interstitium (n, %) | |
| Interstitial inflammation (focal, diffuse) (n, %) | 13, 2 (81.3, 12.5) |
| IFTA moderate-severe (n, %) | 14 (87.5) |
| Vascular lesions (n, %) | |
| Arterio(lar)sclerosis | 14 (87.5) |
| Immunofluorescence staining (N = 16) | |
| Predominant immunoglobulin (n, %) | |
| IgG | 13 (81.3) |
| IgM | 2 (12.5) |
| IgA | 1 (6.3) |
| Light chain restriction (n, %) | |
| Kappa | 9 (56.3) |
| Lambda | 7 (43.8) |
| Mean staining intensity | |
| IgG | 2.2 ± 1.4 |
| IgM | 0.5 ± 0.9 |
| C3 | 1.6 ± 1 |
| C1q | 0.4 ± 0.6 |
| C4 | 0.2 ± 0.6 |
| Biclonality or mismatch between serum IFE and tissue immunofluorescence | 1 (7.7) |
| Site of immunofluorescence staining | |
| Glomerular capillary wall | 7 (43.8) |
| Mesangium | 2 (12.5) |
| Glomerular capillary wall + mesangium | 7 (43.8) |
| Texture of immunofluorescence deposits | |
| Granular | 16 (100) |
| Smudgy | 0 |
| Semi-linear | 0 |
| Electron microscopy (N = 16) | |
| Site of deposits (n, %) | |
| Mesangial deposits | 10 (62.5) |
| Subendothelial deposits | 13 (81.3) |
| Subepithelial deposits | 4 (25) |
| Type of deposits (n, %) | |
| Granular | 16 (100) |
| Focal variegated | 0 |
| Foot process effacement (focal, diffuse) (n, %) | 4, 10 (25, 62.5) |
| Rare microtubules | 1 (6.7) |
GRACE-PGNMID: Glomerular research and clinical experiments- Proliferative glomerulonephritis with monoclonal immunoglobulin deposits, IFE: Immunofixation electrophoresis, IFTA: Interstitial fibrosis and tubular atrophy, IQR: Inter-quartile range, N: total number, n: pathology present.
The predominant monoclonal immunoglobulin was IgG (13/16, 81.2%) with a mean staining intensity (MSI) of 2.2 ± 1.4 [Figure 1c]. Kappa and lambda light chain restriction were seen in 56.3% (9/16) and 43.8% (7/16) of patients, respectively [Figure 1d and 1e]. C3 staining was positive in 50% (8/16) of patients with MSI of 1.6 ± 1. C1q staining was positive in 37.5% (6/16) of patients with MSI of 0.2 ± 0.6. Ultrastructural examination was characterized by classical granular electron-dense deposits predominantly in sub-endothelial location (13/16, 81.3%) [Figure 1f]. Diffuse foot process effacement was seen in 62.5% of patients (10/16).
Treatment
Renin-angiotensin-aldosterone system inhibitors were started in 25% (4/16) of patients immediately after kidney biopsy [Supplemental Table 1]. Nineteen (3/16), sixty-nine (11/16) and twelve (2/16) percent of patients received conservative treatment, immunosuppression as per glomerulonephritis (GN) protocol, and plasma cell targeted chemotherapy, respectively. All 11 patients on GN immunosuppressive protocol regimen received oral glucocorticoid for a median (range) duration of 4 (IQR, 3–6) months. Thirty-six percent (4/11) in addition received a second immunosuppressant (mycophenolate mofetil in 3/4 and oral cyclophosphamide in 1/4 patients). Cyclophosphamide, bortezomib, and dexamethasone (CyBorD) induction regimen was given to 2/16 (16%) patients.
Outcomes
Eighty-one percent (13/16) of patients had longitudinal follow-up records of >3 months, with a median (range) duration of follow-up of 6 (3–27) months [Supplemental Table 1]. Fifteen (2/13), thirty-eight (5/13) and eight (1/13) percent patients attained CR, PR, and PRD, respectively during the follow-up period. Thirty-eight percent (5/13) of patients progressed to kidney failure over a median (range) period of 3 (IQR, 1–7) months. Of the 10 patients who received immunosuppression (with follow-up details >3 months), one (10%) attained CR, four (40%) PR, one (10%) had PRD and four (40%) progressed to kidney failure. Of the two patients who were treated with CyBorD regimen, one attained PR and the other progressed to kidney failure. Though, only one patient (8%) developed multiple myeloma during the follow-up period, 75% (3/4) of tested patients had persistence of M protein on serum electrophoresis. One patient (8%) died during the follow-up period due to infection.
PGNMID with or without circulating MIg
Patients with circulating MIg had more proteinuria [9.1 (IQR, 7.9–15) vs. 4.3 (IQR, 0.36) g/day, p = 0.013)] and lower eGFR [29 (range, 17.5–29.4) v. 61 (13.4–130) mL/min/1.73 m2, p = 0.229] at kidney biopsy [Table 3]. All the three patients with circulating MIg had either positive serum or urine electrophoresis as compared to 3 out of 9 (33.3%) patients without circulating MIg (p = 0.046). Kappa: lambda FLC ratio was higher in patients with circulating MIg [2.9 (range, 2–12) v. 1.1 (range, 0.9–2.9), p = 0.051]. Patients with a circulating MIg also had a higher median percentage of plasma cells on bone marrow biopsy [6% (range, 5–14) vs. 1% (range, 0–4), p = 0.013); and one of these three (33.3%) patients had bone marrow plasmacytosis >10%. However, renal outcomes did not differ between the two groups (kidney failure: With circulating MIg 1/3, 33.3% v. without circulating MIg 3/8, 37.5%).
| Parameter | Circulating monoclonal immunoglobulin | p value | |
|---|---|---|---|
| Present (N = 3) | Absent (N = 9) | ||
| Baseline demographic and clinical characteristics (N = 12) | |||
| Age (years) | 51.3 ± 6.6 | 42.1 ± 14.4 | 0.32 |
| Sex (n, %) | |||
| Males | 2 (66.7) | 5 (55.6) | 0.505 |
| Females | 1 (33.3) | 4 (44.4) | |
| Body mass index, kg/m2 | 23.4 ± 2.7 | 24.1 ± 6.1 | 0.861 |
| Comorbidities | |||
| Diabetes mellitus (n, %) | 1 (33.3) | 1 (11.1) | 0.455 |
| Hypertension (n, %) | 3 (100) | 6 (66.7) | 0.509 |
| Systolic BP, mmHg | 142.7 ± 6.4 | 130 ± 15 | 0.196 |
| Diastolic BP, mmHg | 91.7 ± 2.9 | 79.4 ± 10.7 | 0.086 |
| Renal manifestations (n, %) | |||
| Edema | 3 (100) | 8 (88.9) | 0.546 |
| Oligo-anuria | 0 | 1 (11.1) | 0.546 |
| Dyspnea | 0 | 2 (22.2) | 0.55 |
| Visible hematuria | 0 | 0 | |
| Systemic manifestations (n, %) | |||
| Fever | 1 (11.1) | 0 | 0.546 |
| Bone pain | 0 | 0 | |
| Urine abnormalities (n, %) | |||
| Non-visible hematuria | 2 (66.7) | 8 (88.9) | 0.455 |
| Leucocyturia | 1 (33.3) | 3 (33.3) | 0.764 |
| Casts | 1 (33.3) | 4 (44.4) | 0.636 |
| Serum albumin, g/dL | 2.3 ± 0.7 | 2.8 ± 0.6 | 0.284 |
| 24-hour urine protein, g/day [median (range)] | 9.1 (7.9–15) | 4.3 (0.3–6) | 0.013 |
| Kidney function | |||
| Baseline creatinine, mg/dL [median (range)] | 1.6 (1.5–1.65) | 1.1 (0.5–2.5) | 0.451 |
| Serum creatinine at biopsy, mg/dL [median (range)] | 2.5 (1.9–3.7) | 1.2 (0.5–4.7) | 0.229 |
| eGFR CKD-EPI at biopsy, mL/min/1.73 m2 [median (range)] | 29 (17.5–29.4) | 61 (13.4–130) | 0.229 |
| Renal replacement therapy at biopsy, yes (n, %) | 0 | 1 (11.1) | 0.75 |
| Serology (n, %) | |||
| Low C3 | 3 (100) | 3 (100) | 0.182 |
| Low C4 | 0 | 0 | |
| Baseline hematological parameters | |||
| Hemoglobin, g/dL | 9.5 ± 1.9 | 10.7 ± 1.9 | 0.358 |
| Lytic bone lesions (n, %) | 0 | 0 | |
| Hypercalcemia (n, %)† | 0 | 1 (11.1) | 0.692 |
| M protein detection by protein electrophoresis (n, %) | |||
| Serum protein electrophoresis, yes | 1 (33.3) | 3 (33.3) | 0.764 |
| Urine protein electrophoresis, yes | 2 (66.7) | 0 | 0.045 |
| Serum or urine protein electrophoresis, yes | 3 (100) | 3 (33.3) | 0.046 |
| Immunofixation electrophoresis | |||
| Normal | 0 | 9 (100) | |
| IgG kappa | 3 (100) | 0 | |
| Serum free light chain assay | |||
| Serum kappa FLC, mg/dL [median (range)] | 469 (98–705) | 100 (19–136) | 0.115 |
| Serum lambda FLC, mg/dL [median (range)] | 49 (38–246) | 50 (17.4–100) | 0.644 |
| Serum kappa: lambda FLC ratio [median (range)] | 2.9 (2–12) | 1.1 (0.9–2.9) | 0.051 |
| Abnormal kappa: lambda FLC ratio (n, %) | 3 (100) | 2 (22.2) | 0.045 |
| Bone marrow examination (n, %)† | 6 (5–14) | 1 (0–4) | 0.013 |
| Plasma cells, % [median (range)] | |||
| Plasma cells > 10% | 1 (33.3) | 0 | 0.273 |
| Immunohistochemistry† | |||
| No restriction | 3 (100) | 7 (100) | |
| Kappa restriction | 0 | 0 | |
| Lambda restriction | 0 | 0 | |
| Baseline histopathological parameters (N = 12) | |||
| Light microscopy (N = 12) | |||
| Number of glomeruli | 13.3 ± 6.1 | 16.4 ± 7.5 | 0.313 |
| Globally sclerosed glomeruli [median (range)] | 27.8 (10-33.3) | 10.5 (0-71.4) | 0.459 |
| Glomerular lesions (n, %) | |||
| Light microscopy patterns | 0.5 | ||
| Membranoproliferative pattern | 2 (66.7) | 3 (33.3) | |
| Mesangial proliferation | 0 | 4 (44.4) | |
| Diffuse endocapillary proliferation | 0 | 1 (11.1) | |
| Focal endocapillary proliferation | 1 (33.3) | 1 (11.1) | |
| Crescents | 1 (33.3) | 2 (22.2) | 0.618 |
| Tuft necrosis | 1 (11.1) | 0 | 0.75 |
| Glomerular neutrophil infiltration | 0 | 4 (44.4) | 0.491 |
| Tubular Lesions (n, %) | |||
| Acute tubular injury | 2 (66.7) | 2 (22.2) | 0.236 |
| Interstitium (n, %) | |||
| Interstitial inflammation (focal, diffuse) (n, %) | 3, 0 (100, 0) | 7, 1 (77.8, 11.1) | 0.67 |
| IFTA moderate-severe (n, %) | 2 (66.7) | 8 (88.9) | 0.455 |
| Vascular lesions (n, %) | |||
| Arterio(lar)sclerosis | 3 (100) | 7 (77.8) | 0.545 |
| Immunofluorescence staining (N = 12) | |||
| Heavy chain (n, %) | 0.75 | ||
| IgG | 3 (100) | 8 (88.9) | |
| IgM | 0 | 1 (11.1) | |
| IgA | 0 | 0 | |
| Light chain restriction (n, %) | 0.636 | ||
| Kappa | 2 (66.7) | 5 (55.6) | |
| Lambda | 1 (33.3) | 4 (44.4) | |
| Site of IF staining | 0.036 | ||
| Glomerular capillary wall | 1 (33.3) | 3 (33.3) | |
| Mesangium | 2 (66.7) | 0 | |
| Glomerular capillary wall + mesangium | 0 | 6 (66.7) | |
| Electron microscopy (N = 12) | |||
| Site of deposits (n, %) | |||
| Mesangial deposits | 2 (66.7) | 7 (77.8) | 0.618 |
| Sub-endothelial deposits | 2 (66.7) | 8 (88.9) | 0.455 |
| Sub-epithelial deposits | 0 | 3 (33.3) | 0.509 |
| Foot process effacement (focal diffuse) (n, %) | 0, 2 (0, 66.7) | 3, 6 (33.3, 66.7) | 0.364 |
| Treatment characteristics (N = 12) | |||
| Renin-angiotensin system inhibitors (n, %) | 1 (33.3) | 3 (33.3) | 0.764 |
| Type of therapy (n, %) | |||
| Conservative therapy | 0 | 2 (22.2) | 0.368 |
| Immunosuppression | 3 (100) | 5 (55.6) | |
| Plasma cell targeted chemotherapy | 0 | 2 (22.2) | |
| Outcome at last follow-up (N = 11) | |||
| >3 months of follow-up (n, %) | 3 (100) | 8 (88.9) | |
| Duration of follow-up, months [median (range)] | 6.5 (3-27) | 30 (4-35) | 0.182 |
| Renal outcomes (n, %) | 0.821 | ||
| Complete remission | 1 (33.3) | 1 (12.5) | |
| Partial remission | 1 (33.3) | 3 (37.5) | |
| Persistent renal dysfunction | 0 | 1 (12.5) | |
| Kidney failure | 1 (33.3) | 3 (37.5) | |
| Other outcomes (n, %) | |||
| Infections | 2 (33.3) | 1 (12.5) | 0.667 |
| Death | 1 (33.3) | 0 | 0.273 |
BP: Blood pressure, CKD-EPI: Chronic kidney disease-epidemiology collaboration, eGFR, eGFR: Estimated glomerular filtration rate, FLC: Free light chain, IF: Immunofluorescence, IFTA: Interstitial fibrosis and tubular atrophy, IQR: Inter-quartile range, PGNMID: Proliferative glomerulonephritis with monoclonal immunoglobulin deposits. † Evaluable patients (N) for hypercalcemia (13), bone marrow examination = 11, bone marrow immunohistochemistry = 10, N= total number, n=pathology present.
Light microscopy patterns of PGNMID
As compared to other patterns, patients with MPGN pattern had more proteinuria (7.9 (IQR, 5.8–9) g vs. 4.2 (IQR, 3.1–8.5) g, p = 0.071) and hypocomplementemia (4/7, 57.1% vs. 2/9, 22.2%, p = 0.302) at kidney biopsy [Table 4]. However, all patients with MPGN patterns attained either complete or partial remission during the follow-up period. As compared to this, 71.4% (5/7) of patients with other patterns progressed to kidney failure (p = 0.003).
| Parameter | MPGN pattern (N = 7) | Other LM patterns (N = 9) | p value |
|---|---|---|---|
| Baseline demographic and clinical characteristics (N = 16) | |||
| Age (years) | 47.3 ± 12.6 | 37.3 ± 13.2 | 0.589 |
| Sex (n, %) | |||
| Males | 3 (42.9) | 5 (55.6) | 0.614 |
| Females | 4 (57.1) | 4 (44.4) | |
| Body mass index, kg/m2 | 24 ± 5.2 | 23.9 ± 4.7 | 0.948 |
| Comorbidities | |||
| Diabetes mellitus (n, %) | 1 (14.3) | 1 (11.1) | 0.849 |
| Hypertension (n, %) | 6 (85.7) | 6 (66.7) | 0.585 |
| Systolic BP, mmHg | 142.6 ± 18.1 | 134.1 ± 15.2 | 0.326 |
| Diastolic BP, mmHg | 86.1 ± 10.8 | 84.1 ± 11.8 | 0.729 |
| Renal manifestations (n, %) | |||
| Edema | 7 (100) | 8 (88.9) | 0.362 |
| Oligo-anuria | 1 (14.3) | 0 | 0.438 |
| Dyspnea | 2 (28.6) | 1 (11.1) | 0.55 |
| Visible hematuria | 0 | 0 | |
| Systemic manifestations (n, %) | |||
| Fever | 1 (14.3) | 0 | 0.438 |
| Bone pain | 0 | 0 | |
| Urine abnormalities (n, %) | |||
| Non-visible hematuria | 7 (100) | 7 (77.8) | 0.475 |
| Leucocyturia | 4 (57.1) | 4 (44.4) | 0.614 |
| Casts | 1 (14.3) | 5 (55.6) | 0.145 |
| Serum albumin, g/dL | 2.4 ± 0.4 | 2.8 ± 0.8 | 0.261 |
| 24-hour urine protein, g/day [median (IQR)] | 7.9 (5.8–9) | 4.2 (3.1–8.5) | 0.071 |
| Kidney function | |||
| Baseline creatinine, mg/dL [median (IQR)] | 1.2 (0.8–1.6) | 1.4 (1–1.7) | 0.451 |
| Serum creatinine at biopsy, mg/dL [median (IQR)] | 1.9 (0.8–2.5) | 2 (1.1–3.4) | 0.337 |
| eGFR CKD-EPI at biopsy, mL/min/1.73 m2 [median (IQR)] | 41 (29–74.8) | 33 (20.5–70.5) | 0.606 |
| Renal replacement therapy at biopsy, yes (n, %) | 1 (14.3) | 0 | 0.438 |
| Serology (n, %) | |||
| Low C3 | 4 (57.1) | 2 (22.2) | 0.302 |
| Low C4 | 0 | 0 | |
| Baseline hematological parameters | |||
| Hemoglobin, g/dL | 9.8 ± 1.7 | 10.6 ± 1.7 | 0.34 |
| Lytic bone lesions (n, %) | 0 | 0 | |
| Hypercalcemia (n, %)† | 0 | 1 (11.1) | 0.692 |
| M protein detection by protein electrophoresis (n, %) | |||
| Serum protein electrophoresis, yes | 3 (42.9) | 3 (33.3) | 0.696 |
| Urine protein electrophoresis, yes | 3 (42.9) | 0 | 0.063 |
| Serum or urine protein electrophoresis, yes | 4 (57.1) | 3 (33.3) | 0.615 |
| Serum immunofixation electrophoresis (n, %)† | |||
| Normal | 3 (60) | 6 (85.7) | 0.523 |
| IgG kappa | 2 (40) | 1 (14.3) | |
| Serum free light chain assay† | |||
| Serum kappa FLC, mg/dL [median (IQR)] | 98 (36–289) | 100 (51.3–28.5) | 0.913 |
| Serum lambda FLC, mg/dL [median (IQR)] | 49 (29–58) | 55 (38.8–90.8) | 0.546 |
| Serum kappa: lambda FLC ratio [median (IQR)] | 1.6 (1–7) | 1.6 (1–2.7) | 0.981 |
| Abnormal kappa: lambda FLC ratio (n, %) | 2 (40) | 3 (37.5) | 0.928 |
| Bone marrow examination (n, %)† | |||
| Plasma cells, % [Median (range)] | 2.5 (0–6) | 0 (0–14) | 0.33 |
| Plasma cells > 10% | 0 | 1 (14.3) | 0.335 |
| Immunohistochemistry† | |||
| No restriction | 6 (100) | 6 (100) | |
| Kappa restriction | 0 | 0 | |
| Lambda restriction | 0 | 0 | |
| Baseline histopathological parameters (N = 16) | |||
| Light microscopy (N = 16) | |||
| Number of glomeruli | 13.6 ± 4.9 | 15.1 ± 7.6 | 0.652 |
| Globally sclerosed glomeruli [median (IQR)] | 10 (6.7–33.3) | 26.7 (15.1–31.9) | 0.366 |
| Glomerular lesions (n, %) | |||
| Light microscopy patterns | <0.001 | ||
| Membranoproliferative pattern | 7 (100) | 0 | |
| Mesangial proliferation | 0 | 5 (55.6) | |
| Diffuse endocapillary proliferation | 0 | 2 (22.2) | |
| Focal endocapillary proliferation | 0 | 2 (22.2) | |
| Crescents | 2 (28.6) | 2 (22.2) | 0.772 |
| Tuft necrosis | 1 (14.3) | 0 | 0.438 |
| Glomerular neutrophil infiltration | 4 (57.1) | 2 (22.2) | 0.302 |
| Tubular lesions (n, %) | |||
| Acute tubular injury | 2 (28.6) | 3 (33.3) | 0.838 |
| Interstitium (n, %) | |||
| Interstitial inflammation (focal, diffuse) (n, %) | 7, 0 (100, 0) | 6, 2 (66.7, 22.2) | 0.475 |
| IFTA moderate-severe (n, %) | 6 (85.7) | 8 (88.9) | 0.849 |
| Vascular lesions (n, %) | |||
| Arterio(lar)sclerosis | 7 (100) | 7 (77.8) | 0.475 |
| Immunofluorescence staining (N = 16) | |||
| Heavy chain (n, %) | 0.657 | ||
| IgG | 6 (85.7) | 7 (77.8) | |
| IgM | 1 (14.3) | 1 (11.1) | |
| IgA | 0 | 1 (11.1) | |
| Light chain restriction (n, %) | 0.949 | ||
| Kappa | 4 (57.1) | 5 (55.6) | |
| Lambda | 3 (42.9) | 4 (44.4) | |
| Site of immunofluorescence staining | 0.315 | ||
| Glomerular capillary wall | 3 (42.9) | 4 (44.4) | |
| Mesangium | 2 (28.6) | 0 | |
| Glomerular capillary wall + mesangium | 2 (28.6) | 5 (55.6) | |
| Electron microscopy (N = 16) | |||
| Site of deposits (n, %) | |||
| Mesangial deposits | 5 (71.4) | 5 (55.6) | 0.633 |
| Subendothelial deposits | 7 (100) | 6 (66.7) | 0.213 |
| Subepithelial deposits | 1 (14.3) | 3 (33.3) | 0.585 |
| Foot process effacement (focal, diffuse) (n, %) | 1, 6 (14.3, 85.7) | 3, 4 (33.3, 44.4) | 0.202 |
| Treatment characteristics (N = 16) | |||
| Renin-angiotensin system inhibitors (n, %) | 1 (14.3) | 3 (33.3) | 0.585 |
| Type of therapy (n, %) | 0.915 | ||
| Conservative therapy | 1 (14.3) | 2 (22.2) | |
| Immunosuppression | 5 (71.4) | 6 (66.7) | |
| Plasma cell targeted chemotherapy | 1 (14.3) | 1 (11.1) | |
| Outcome at last follow-up (N = 13) | |||
| >3 months of follow-up (n, %) | 6 (85.7) | 7 (77.8) | 0.127 |
| Duration of follow-up, months [median (range)] | 25 (3-35) | 4 (3-27) | |
| Renal outcomes (n, %) | 0.003 | ||
| Complete remission | 1 (16.7) | 1 (14.3) | |
| Partial remission | 5 (83.3) | 0 | |
| Persistent renal dysfunction | 0 | 1 (14.3) | |
| Kidney failure | 0 | 5 (71.4) | |
| Other outcomes (n, %) | |||
| Infections | 2 (33.3) | 1 (14.3) | 0.333 |
| Death | 0 | 1 (16.7) | 0.296 |
BP: Blood pressure, CKD-EPI: Chronic kidney disease-Epidemiology collaboration, eGFR: Estimated glomerular filtration rate, FLC: Free light chain, IFTA: Interstitial fibrosis and tubular atrophy, IQR: Inter-quartile range, LM: Light microscopy, MPGN: Membranoproliferative glomerulonephritis, PGNMID: Proliferative glomerulonephritis with monoclonal immunoglobulin deposits. †Evaluable patients (N) for hypercalcemia = 13, serum immunofixation electrophoresis = 12, serum free light chain assay = 13, bone marrow examination = 13, bone marrow immunohistochemistry = 12, N= total number, n=pathology present.
Type of light chain restriction on immunofluorescence
Patients with kappa light chain restriction (kappa-PGNMID) were younger (36.4 ± 13.3 vs. 48.4 ± 11.2 years, p = 0.077) with a male preponderance (M:F ratio 2:1 vs. 0.4:1, p = 0.315) [Supplemental Table 2]. Baseline proteinuria, eGFR, and serum complement levels were comparable between patients with kappa and lambda light chain restriction (lambda-PGNMID). Twenty-nine and fifty percent of kappa-PGNMID patients had a circulating monoclonal kappa light chain detected by serum IFE and FLC assay, respectively. Whereas none of the lambda-PGNMID patients had circulating monoclonal lambda light chain. One of these seven patients with lambda restriction had a circulating kappa monoclonal light chain. Subepithelial granular electron-dense deposits were more commonly seen in kappa-PGNMID (4/9, 44.4% vs. 0/7, p = 0.088). However, renal outcomes did not differ between the two groups (kidney failure: kappa-PGNMID 3/8, 37.5% vs. lambda-PGNMID 2/5, 40%, p = 0.862).
Discussion
PGNMID is a rare entity classified under the umbrella of monoclonal gammopathy of renal significance (MGRS) (biopsy incidence of 0.1%). To our knowledge, this is the largest case series of PGNMID from Indian subcontinent. The mean age of our cohort was much lower than previous studies3-13 with an equal incidence in males and females [Supplemental Table 2]. This is in contrast to the study by Nasr et al. who first described this entity primarily in elderly white female population.4 We observed that kappa-PGNMID patients were younger with a male preponderance. In a series of 17 cases of “light chain only” variant PGNMID described by Nasr et al., majority (71%) had kappa restricted deposits. The median age at presentation however was 62 (range, 44–84) years, with majority (76%) being males.13
The most common presentation was nephritic-nephrotic syndrome (69%). The median eGFR at presentation was 36 (IQR, 24–75) mL/min/1.73 m2, which was comparable to previous studies.3,4 We observed that patients with MPGN patterns and those with detectable circulating MIg had more proteinuria at presentation. None of our patients had extra-renal involvement as reported in previous studies.6
A circulating MIg by IFE was detected in only 25% cases, which was similar to previous studies (20–37%) [Supplemental Table 2].4,8 An abnormal serum kappa: lambda FLC ratio was observed in 38% of our cases. None of the seven lambda-PGNMID patients had circulating monoclonal lambda light chain, whereas, half of the kappa-PGNMID patients had detectable circulating monoclonal kappa light chain. This may be explained by the low rate of monoclonal protein production in PGNMID which may be below the diagnostic threshold of currently available tools.6 PGNMID patients who undergo kidney transplantation experience high rates of early recurrence after renal transplantation with almost half of the patients losing their graft over a median period of three years.9-11 And again only 20% of these patients with recurrent PGNMID have a detectable circulating MIg (10). The other possible hypothesis is a “glomerular sieving phenomenon” due to the ability of IgG3 (the predominant heavy chain in PGNMID) to bind to negatively charged glomerular basement membrane and self-aggregate leading to high intraglomerular concentration.7,12 This explains why patients with “light chain only” variant of PGNMID have higher rates of detectable serum paraprotein (73% by serum electrophoresis and 83% by serum FLC assays).13
Only 8% (1/13) of our patients had bone marrow plasmacytosis >10% as reported in previous studies (0–17%).3 Patients with circulating MIg had a higher median percentage of plasma cells on bone marrow biopsy. None of our patients showed monoclonal restriction of marrow plasma cells by IHC. In contrast, half of the patients of “light chain only” variant of PGNMID had bone marrow plasmacytosis >10% with monoclonal light chain restriction.13 Bhutani et al. detected a nephropathic clone in 25% of PGNMID patients by bone marrow flow cytometry and in 11% by peripheral blood flow cytometry. The nephropathic clones detected were plasma cell (60%), B cell (30%), and lymphoplasmacytic cell (10%).3 In a study by Gumber et al., a nephropathic clone was detected in 32% of patients by bone marrow flow cytometry. The detected clones were plasma cell (50%), B cell (33%), and lymphoplasmacytic cell (17%).8
MPGN was the most common light microscopy pattern seen in our study, similar to previous studies [Supplemental Table 2].4,8 Nasr et al. classified PGNMID into four stages based on the timing of kidney biopsy from the onset of disease. Stage 1 is a latent phase associated with monoclonal deposits in kidney with no mesangial proliferation and is clinically silent. Stage 2 is characterized by mesangial proliferation and mild proteinuria. Stages 3 and 4 PGNMID patients have endocapillary proliferative and membranoproliferative glomerulonephritis, respectively.9 None of our patients had membranous nephropathy, which is a rare pattern of PGNMID.14,15 In a series of 26 patients with allograft PGNMID, MPGN pattern was one of the predictors of allograft loss.10 We observed that patients with MPGN pattern had better renal outcomes despite higher degree of proteinuria at presentation.
In our study, IgG was the predominant monoclonal immunoglobulin detected in kidney, as reported in previous studies.3,4 There was almost an equal distribution of kappa and lambda PGNMID cases in our series unlike kappa predisposition seen in adults3-7,16 and lambda predisposition seen in pediatric series.17,18 Biclonality (mismatch in monoclonal light chain detected in circulation and kidney biopsy) was seen in 8% of patients, similar to previous studies (7–14%).3,8,13 Subepithelial granular electron-dense deposits were more commonly seen in kappa-PGNMID patients.
One-third of patients in our cohort progressed to kidney failure (18–67% in previous studies) despite majority (81%) receiving some form of immunosuppression.3,8,13,16 Clone-directed therapy in PGNMID is gaining a lot of interest in recent years.8,19-21 In a case series of the eight ‘light chain only’ variant PGNMID cases treated with plasma cell targeted chemotherapy, six attained complete hematological and renal remission, one attained partial hematological remission with worsening kidney function and one had neither hematological nor renal remission.13 In a cohort of 64 PGNMID patients from China, Zhou et al. reported CR rates of 23%, 53%, and 50% with steroid, immunomodulatory drugs (thalidomide or lenalidomide) along with dexamethasone, and bortezomib-based plasma cell chemotherapy, respectively.22 Complete or partial renal remission was attained in 73%, 54%, and 29% of PGNMID patients (65 patients from 3 case series) treated with clone-directed, immunosuppressive, and conservative therapy, respectively.23 In a series of 10 PGNMID patients treated with daratumumab (monoclonal anti-CD38 antibody), four attained CR, and remaining six attained PR. There was a significant decline in proteinuria from 4.3 g/day at baseline to 1.2 g/day at the end of 12 months.24 In a series of five cases of bortezomib-resistant PGNMID treated with daratumumab for a median duration of 11.2 (range 5–19.1) months, one attained complete renal and hematological remission, two attained PR and two had no remission (of which one patient had histological improvement of immune deposits).25 The other mjor cohorts are compared with this study in Supplementary Table 3. The major limitations of clone-directed therapy are low detection rate of nephropathic clones (25–32%), therapy-related toxicity, and absence of detectable clone to assess response to therapy.6,24-27 Supplemental Table 4 summarizes the recommended workup in PGNMID and the currently available treatment options. Supplementary Figure 2 summarizes the current treatment recommendations of PGNMID.
Our study is not without limitations. The small size of our cohort and short duration of follow-up is a major limitation of our study. IgG subtyping is not routinely done at our center due to resource limitations. All our patients showed a clear light chain restriction by IF microscopy and each antibody testing was repeated at least twice by different technicians and interpreted by two renal pathologists to confirm concordance in reporting. All patients had typical granular electron-dense deposits without substructure in mesangial, subendothelial, and/or subepithelial locations on EM. Almost 70% of our patients received immunosuppression tailored to regimens used in glomerulonephritis (27–81% in previously reported cohorts). This depicts the real-world scenario wherein nephrologists and hematologists shy away from using toxic chemotherapeutic regimens in absence of detectable clones. Zhou et al. reported lower rates of M protein detection in PGNMID patients treated with steroid (3%) as compared to those treated with bortezomib-based plasma cell chemotherapy (40%).22 Bone marrow flow cytometry was not done in any of our patients, which could have increased the likelihood of detecting small pathogenic clones.
PGNMID is a rare renal disease with a biopsy incidence of 0.1% in our registry data spanning over 8 years. Only a quarter of patients with PGNMID had circulating MIg. The presence of circulating MIg, type of monoclonal light chain restriction in kidney biopsy, and type of therapy did not predict renal outcomes. Patients with MPGN pattern had favorable renal outcomes despite a higher degree of proteinuria at presentation. One-third of patients progressed to kidney failure despite immunosuppressive therapy necessitating the need for aggressive clone-directed chemotherapy. The future directions would be to develop sophisticated diagnostic techniques sensitive to pick up small nephropathic clones, unravel the patho-mechanisms of renal injury, and need for a combined hemato-renal clinic for early diagnosis and initiation of clone-directed chemotherapy.
Conflicts of interest
There are no conflicts of interest.
References
- Paraprotein–related kidney disease: Glomerular diseases associated with paraproteinemias. Clin J Am Soc Nephrol. 2016;11:2260-72.
- [CrossRef] [PubMed] [PubMed Central] [Google Scholar]
- The complexity and heterogeneity of monoclonal immunoglobulin-associated renal diseases. J Am Soc Nephrol JASN. 2018;29:1810-23.
- [CrossRef] [PubMed] [PubMed Central] [Google Scholar]
- Hematologic characteristics of proliferative glomerulonephritis with nonorganized monoclonal immunoglobulin deposits. Mayo Clin Proc. 2015;90:587-96.
- [CrossRef] [PubMed] [Google Scholar]
- Proliferative glomerulonephritis with monoclonal IgG deposits. J Am Soc Nephrol. 2009;20:2055-64.
- [CrossRef] [PubMed] [PubMed Central] [Google Scholar]
- Defining new reference intervals for serum free light chains in individuals with chronic kidney disease: Results of the iStopMM study. Blood Cancer J. 2022;12:1-8.
- [CrossRef] [PubMed] [PubMed Central] [Google Scholar]
- Bridging the divide: An onco-nephrologic approach to the monoclonal gammopathies of renal significance. Clin J Am Soc Nephrol. 2016;11:1681-91.
- [CrossRef] [PubMed] [PubMed Central] [Google Scholar]
- A tale of monoclonal immunoglobulin: Clinicopathological analysis of proliferative glomerulonephritis with monoclonal immunoglobulin deposit. Indian J Pathol Microbiol. 2021;64:282-7.
- [CrossRef] [PubMed] [Google Scholar]
- A clone-directed approach may improve diagnosis and treatment of proliferative glomerulonephritis with monoclonal immunoglobulin deposits. Kidney Int. 2018;94:199-205.
- [CrossRef] [PubMed] [Google Scholar]
- Proliferative glomerulonephritis with monoclonal IgG deposits recurs in the allograft. Clin J Am Soc Nephrol CJASN. 2011;6:122-32.
- [CrossRef] [PubMed] [PubMed Central] [Google Scholar]
- Proliferative glomerulonephritis with monoclonal immunoglobulin G deposits is associated with high rate of early recurrence in the allograft. Kidney Int. 2018;94:159-69.
- [CrossRef] [PubMed] [Google Scholar]
- Recurrence of proliferative glomerulonephritis with monoclonal immunoglobulin G deposits with a striated ultrastructure. Nephron. 2020;144:43-8.
- [CrossRef] [PubMed] [Google Scholar]
- Proliferative glomerulonephritis with monoclonal IgG deposits: A distinct entity mimicking immune-complex glomerulonephritis. Kidney Int. 2004;65:85-96.
- [CrossRef] [PubMed] [Google Scholar]
- Light chain only variant of proliferative glomerulonephritis with monoclonal immunoglobulin deposits is associated with a high detection rate of the pathogenic plasma cell clone. Kidney Int. 2020;97:589-601.
- [CrossRef] [PubMed] [Google Scholar]
- A Case of proliferative glomerulonephritis with monoclonal IgG deposits that showed predominantly membranous features. Case Rep Nephrol. 2017;2017:e1027376.
- [CrossRef] [PubMed] [PubMed Central] [Google Scholar]
- Membranous-like glomerulopathy with masked IgG kappa deposits. Kidney Int. 2014;86:154-61.
- [CrossRef] [PubMed] [Google Scholar]
- Proliferative glomerulonephritis with monoclonal immunoglobulin deposition disease: The utility of routine staining with immunoglobulin light chains. Indian J Nephrol. 2015;25:344-8.
- [CrossRef] [PubMed] [PubMed Central] [Google Scholar]
- Progression of proliferative glomerulonephritis with monoclonal IgG deposits in pediatric patients. Pediatr Nephrol. 2021;36:927-38.
- [CrossRef] [PubMed] [PubMed Central] [Google Scholar]
- Proliferative glomerulonephritis with monoclonal immunoglobulin G lambda deposits: Report of the first pediatric case. Case Rep Nephrol Dial. 2018;8:70-5.
- [CrossRef] [PubMed] [PubMed Central] [Google Scholar]
- Proliferative glomerulonephritis with monoclonal immunoglobulin deposits: Successful treatment for new and rare entity. Clin Case Rep. 2021;9:80-5.
- [CrossRef] [PubMed] [PubMed Central] [Google Scholar]
- Successful treatment with bortezomib and dexamethasone for proliferative glomerulonephritis with monoclonal IgG deposits in multiple myeloma: A case report. BMC Nephrol. 2017;18:127.
- [CrossRef] [PubMed] [PubMed Central] [Google Scholar]
- Treatment with bortezomib for recurrent proliferative glomerulonephritis with monoclonal IgG deposits in kidney allograft. Case report and review of the literature. J Nephrol. 2022;35:1289-93.
- [CrossRef] [PubMed] [PubMed Central] [Google Scholar]
- Efficacy of immunomodulatory drugs in combination with dexamethasone in proliferative glomerulonephritis with monoclonal immunoglobulin deposits. Kidney Int Rep. 2022;7:2166-75.
- [CrossRef] [PubMed] [PubMed Central] [Google Scholar]
- Clone-directed therapy for proliferative glomerulonephritis with monoclonal immunoglobulin depositions: Is it always necessary? : Two case reports and literature review. J Nephrol. 2020;33:611-7.
- [CrossRef] [PubMed] [PubMed Central] [Google Scholar]
- Daratumumab in patients with bortezomib-refractory proliferative glomerulonephritis with monoclonal immunoglobulin deposits. Kidney Int Rep. 2021;6:2203-6.
- [CrossRef] [PubMed] [PubMed Central] [Google Scholar]
- Diagnosis of monoclonal gammopathy of renal significance. Kidney Int. 2015;87:698-711.
- [CrossRef] [PubMed] [Google Scholar]
- Patterns of noncryoglobulinemic glomerulonephritis with monoclonal ig deposits: Correlation with IgG subclass and response to rituximab. Clin J Am Soc Nephrol. 2011;6:1609-16.
- [CrossRef] [PubMed] [Google Scholar]
- The clinicopathologic characteristics of kidney diseases related to monotypic IgA deposits. Kidney Int. 2017;91:720-8.
- [CrossRef] [PubMed] [Google Scholar]


