

Translate this page into:
Longitudinal Assessment of Health-Related Quality of Life in Three Different Hyperphosphatemia Management Groups of Stage III and IV Chronic Kidney Disease Patients
Corresponding author: Prof. Himansu S. Mahapatra, 307, Admn Block, PGIMER Building, ABVIMS, Dr. R.M.L.Hospital, New Delhi, India. E-mail: hsmnephro@gmail.com
-
Received: ,
Accepted: ,
How to cite this article: Kaur N, Mahapatra HS, Pursnani L, Muthukumar B, Singh M, Gupta YP. Longitudinal Assessment of Health-Related Quality of Life in Three Different Hyperphosphatemia Management Groups of Stage III and IV Chronic Kidney Disease Patients. Indian J Nephrol. 2024;34:119–28. doi: 10.4103/ijn.ijn_6_23
Abstract
Introduction:
Health-related quality of life (HRQoL) has emerged as an important outcome measure inpatients with CKD. The lack of prospective studies on HRQoL and its relation with hyperphosphatemia control measures among pre-dialysis patients necessitated the need for this study.
Methods:
This is a prospective, randomized, controlled, open-labelled studythat was conducted for one year on 120 CKD stages III and IV patients divided equally into three groups: Group 1, in which patients under went dietary phosphorus modification; Group 2, in which they were administered calcium-based phosphate binders; and Group 3, in which they were administered non-calcium-based phosphate binders. Patients were assessed for HRQoL, fibroblast growth factor 23 (FGF 23), intact parathyroid hormone (iPTH), phosphorus, and nutritional status, and dietary phosphorus control strategies at 0, 6, and 12 months. HRQoL was measured by using the 36-item Short Form Survey (SF-36) that included a physical component score (PCS) and mental component score (MCS). The scores is ranging from 0 to 100. Higher scores indicate better health status. Usingthe two-wayand one-way repeated measure ANOVA, we analyzed equality of group means, time intervals, and interactions.
Results:
At baseline, the mean PCS and MCS were equal in three groups. PCS improved significantly (P < 0.00) from baseline to one year in all the three groups: ingroup 1, the PCS score was 66.5 ± 13.5to 75.1 ± 9.76; in group 2, it was 68.9 ± 11.80 to 77.2 ± 7.50; and in group 3, it was 66.2 ± 12.16 to 73.8 ± 9.27. Initially, MCS declined substantially on the sixth month but recovered afterone year. Multiple regression analysis in 13 associated parameters yielded R2 of 13.7% and 18.1% in PCS and MCS, respectively, indicating little contribution of various parameters.
Conclusion:
There has been a significant positive change in PCSs in three hyperphosphatemia management groups over a period of 12 months. Among the three study groups, the incremental changes in PCS and MCS scores were insignificant.
Keywords
Chronic kidney disease
low phosphorus diet
mental component score (MCS)
physical component score (PCS)
quality of life SF36 questionnaire

Introduction
Health-related quality of life (HRQoL) has emerged as an important outcome measure in patients with chronic kidney disease (CKD).1,2 HRQoL impairment shows increased risks of adverse clinical outcomes such as cardiovascular (CV) events and death.3 Several clinical and non-clinical factors affect HRQoL in CKD patients, andthe manipulation of these factors improves HRQoL, which in turn increases overall health outcomes.4 The HRQoL allows for the quantification of the disease consequences according to the patients’ subjective perception and helps in the adjustment of medical decisions according to the patient’s physical, emotional, and social needs.5
CKD mineral and bone disorder (CKD–MBD) is considered to be an important factor that affects the patient’s physical functioning and HRQoL; particularly, it declines progressively in more advanced stages of CKD.6 Suboptimal serum phosphorus, intact parathyroid hormone (iPTH) levels, and high pill burden from phosphate binders have been associated with poor HRQoL in hemodialysis (HD) patients. High or low iPTH levels are associated with a low HRQoL.6 A majority of the studies on HRQoL and its determinants in patients with CKD have been conducted on patients with end-stage renal disease (ESRD) undergoing renal replacement therapy (RRT). Conditions like malnutrition, anemia, cognitive dysfunction, depression, sleep disorders, reduced social interaction, decreased physical and sexual functioning, diabetes, and cardiovascular disease (CVD) impair HRQoL in late CKD patients.7 On the contrary, Wee et al.8 showed that neither MBD nor anemia was associated with HRQoL in pre-dialysis patients. Luo et al.9 showed that when the recommended iPTH levels were attained, patients with mildly low serum calciumand mildly high serum phosphorus had better quality of life (QoL) scores. Although a few cross-sectional studies have revealed that QoL decreased across all CKD stages; there is a lack of evidence on the importance of QoL in early CKD patients.10
A high mortality rate and a prevalence of comorbid conditions even in patients in early stages of CKD have raised concerns that their HRQoL could also be affected. The lack of prospective studies on HRQoL and its relation with a phosphorus-restricted diet among the hyperphosphatemia management patients necessitated the need for this study. Our earlier study showed an association between serum phosphorus level and fibroblast growth factor 23 (FGF23) in three different hyperphosphatemia management groups of stage III and IV CKD patients longitudinally over one year.11 In this study, we have evaluated the change in QoL and its components in relation to different low phosphorus treatment methods and the progression of the disease activity.
Materials and Methods
Study design
This longitudinal, interventional study was a single-center, parallel arm, randomized, and open-labelled study that was conducted from January 2019 to August 2020 at a tertiary hospital after receving approval from the institute’s ethics committee. Study participants were patients with CKD stage III and IV, having serum phosphorus levels between 3.5 and 7.0 mg/dl.
Out of a total of 330 patients screened, 150 were randomized; but only 120 patients completed one year. These patients were allocated into three groups based on the computer-based randomization with an equal allocation. The patients in Group 1 were prescribed a normal phosphorus diet of 700–800 mg per day during the first six months followed by a low phosphorus diet in the next six months; Group 2 patients were prescribed calcium-based phosphate binders (starting dose was tab. calcium acetate 667mg b.d.) and phosphorus restricted diet (500–700mg/day); and Group 3 were prescribed a non-calcium-based phosphate binder (starting dose was tab. sevelamer 400 mg twice daily) with restricted dietary phosphorus.
A dietician used the food records to counsel participants to follow a diet tailored to their randomization group. Participants assigned to the phosphate-restricted group were counseled for a daily phosphate intake of 500–700 mg, as per CKD guidelines.12 Participants assigned to the unrestricted diet received advice about healthy eating and weight maintenance and were advised to follow their usual diets. All the patients were followed up telephonically to confirm their controlled dietary protein and phosphorus intake.
HRQoL was assessed by using the 36-item Short Form Survey (SF-36) version 1.0 from the RAND Corporation (https://www.rand.org/healthcare.html). The same questionnaire has been tested in the Indian population in their local language.7 In the survey, there are 36 questions that pertain to eight components: physical functioning,10 role physical,4 general health,5 bodily pain,2 mental health/emotional wellbeing,5 role emotional,3 social functioning,2 vitality (energy and fatigue),4 and health change.1 Of these, PCS comprises 21 components and MCS comprises 14 components of questions. Tne question on health change was eliminated. The scoring was done as per standard procedures; each question was scored between 0 and 100. Finally, PCS and MCS were scaled down to vary between 0 and 100 each. Higher scores indicate better health status.
Investigations
Relevant clinical data associated with anemia, serum hemoglobin, phosphorus, and adjusted calcium and albumin concentrations were also collected from their electronic medical records. The enrolled patients underwent complete hemogram, urea, creatinine, phosphorus, calcium, iPTH, alkaline phosphatase, Modification of Diet in Renal Disease (MDRD)-based estimated glomerular filtration rate (eGFR), and intact FGF 23 at the start of the study and subsequently six-monthly forone year. iPTH was measured by third-generation immunoassay.
Patients were followed up six-monthly for one year. Each participant was interviewed regarding HRQoL, the SF-36, basic investigations, and dietary record during this period.
Statistical analysis
All statistical analyses were performed using the IBM SPSS Statistics software version 23. Quantitative data were expressed in mean and standard deviation, and qualitative data in percentage. Assumption of normality was tested using the Kolmogorov–Smirnov test. Two-way repeated measures ANOVA was done to test for mean variations in the three groups across three time periods with PCS and MCS separately. The variables meeting normality assumption were further tested for second assumption of sphericity by using Mauchly’s sphericity test. If the significance of Mauchly’s test was greater than or equal to 0.05, it was concluded that the data set met the assumption, and we looked at “Sphericity Assumed” in the output table. The corresponding F-value has been reported. If the P-value of F was less than 0.05, we looked for Greenhouse–Geisser/Huynh–Feldt correction. Greenhouse–Geisser correction was used when its ∈ (epsilon) value was <0.75; otherwise, the Huynh–Feldt correction was used. If P value was less than 0.05, it was concluded that there was a significant difference on average in at least one of the three paired samples. Multiple comparisons using Bonferroni corrections were performed to identify which pair showed significance. One-way repeated measures ANOVA was also done to see the mean differences in three time intervals in three groups separately. Multiple regression analyses were carried out with PCS and MCS as dependent variables and age, diabetes, hypertension, eGFR, anemia, albumin, phosphorus, intact PTH, FGF23, calories, carbohydrate, and total protein intake as dependent variables.
Results
A total of 150 patients over the age of 18 years were randomized, of which 120 completed the study. They were divided equally into three groups [Figure 1]. The mean and standard deviation (SD) of all demographic parameters and biochemical and nutritional variables are shown in Table 1.
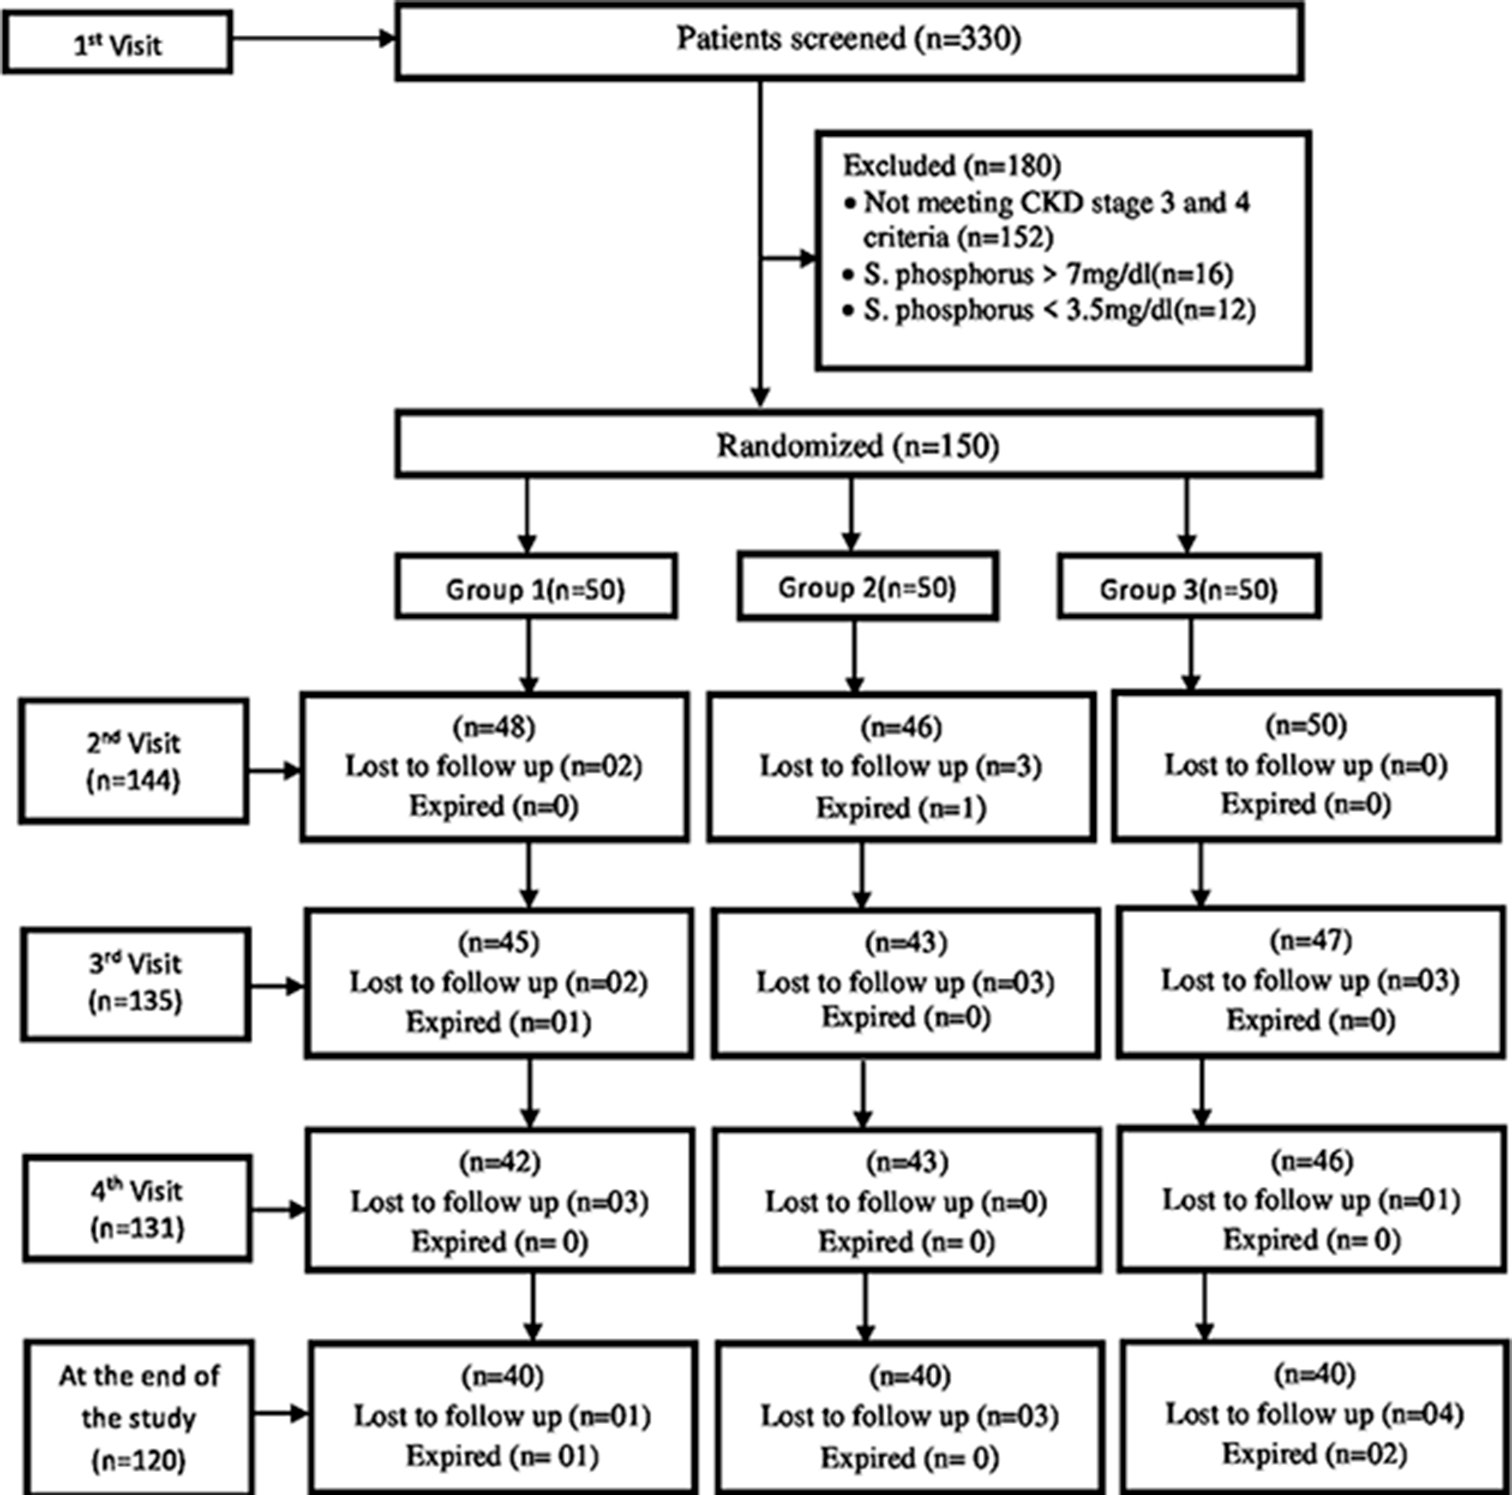
- Flow chart. CKD: chronic kidney disease.
| Parameters | Group 1 (n=40) | Group 2 (n=40) | Group 3 (n=40) | P |
|---|---|---|---|---|
| Mean±SD and % | Mean+SD and % | Mean±SD and % | ||
| Clinical: | ||||
| Age (in years) | 54.50±13.41 | 51.93±16.26 | 51.10±16.80 | 0.60 |
| Mean BP (mmHg) | 102.59±14.77 | 102.43±11.15 | 99.79±11.61 | 0.50*** |
| Male gender | 25 (62.5) | 23 (57.5) | 23 (57.5) | 0.87** |
| Smoker | 3 (7.5) | 1 (2.5) | 0 (0) | 0.12* |
| Alcoholic | 1 (2.5) | 1 (2.5) | 0 (0) | 0.70* |
| Diabetes | 15 (37.5) | 16 (40.0) | 12 (30.0) | 0.624** |
| Hypertension | 32 (80.0) | 35 (87.5) | 29 (72.5) | 0.245** |
| CKD Stage: | ||||
| III | 21 (52.5) | 21 (52.5) | 26 (65.0) | 0.206** |
| IV | 19 (47.5) | 19 (47.5) | 14 (35.5) | |
| H/o CVS disease | 3 (7.5) | 5 (12.5) | 2 (5.0) | 0.601* |
| H/o CVA | 0 | 2 (5.0) | 1 (2.5) | 0.772* |
| Nutritional intake: | ||||
| Total calories (kcal/day) | 1540.63±205.64 | 1487.55±304.53 | 1489.33±294.80 | 0.613* |
| Protein (g/day) | 60.23±9.36 | 33.80±14.67 | 34.77±14.90 | <0.0001* |
| Phosphorous (mg/day) | 722.70±112.29 | 405.60±176.05 | 417.28±178.99 | <0.0001* |
Data presented as mean±SD or number (percentage).*Fisher’s exact test,**chi-squared test, ***Kruskal–Wallis test. CKD=Chronic kidney disease, CVS=cardiovascular, SD=standard deviation, CHA= cerebrovascular accident, BP= blood pressure.
We analyzed the PCS and MCS scores in Tables 2 and 3; where in the differences of the parameters in relation to three groups and two stages of CKD have been described. We also analyzed other parameters such as serum albumin, serum phosphorus, eGFR, FGF 23, calorie, protein, and phosphorus intake in both the stages during study period.
| #Group 1 (n=40) | |||||
| Parameter | 0th month | 6th month | 12th month | Common *P | **P (B/w months) |
| Mean±SD. | Mean±SD. | Mean±SD. | |||
| PCS | 64.4±16.12 | 73.7±14.11 | 74.3±11.89 | 0.000 | a-0.000, |
| b-0.000 | |||||
| MCS | 85.5±9.64 | 53.1±11.96 | 82.7±7.84 | 0.000 | a-0.000, |
| c-0.000 | |||||
| Total calories | 1540.62±205.53 | 1443.32±134.99 | 1514.35±139.56 | 0.020 | a-0.053 |
| c-0.004 | |||||
| Protein | 60.22±9.35 | 40.35±8.99 | 39.85±8.49 | 0.000 | a-0.000 |
| b-0.000 | |||||
| Phosphorus | 722.70±112.29 | 484.20±107.899 | 478.31±101.95 | 0.000 | a-0.000 |
| b-0.000 | |||||
| #Group 2 (n=40) | |||||
| Parameter | 0th month | 6th month | 12th month | Common *P | **P (B/w months) |
| Mean±SD | Mean±SD | Mean±SD | |||
| PCS | 68.9±11.80 | 77.7±10.19 | 77.2±7.50 | 0.000 | a-0.000, |
| b-0.000, | |||||
| MCS | 84.5±12.33 | 54.0±13.39 | 83.8±6.88 | 0.000 | a-0.000, |
| c-0.000 | |||||
| Total calories | 1487.55±304.53 | 1463.75±126.48 | 1560.12±152.20 | 0.111 | -- |
| Protein | 33.80±14.67 | 43.28±11.64 | 43.92±10.76 | 0.000 | a-0.004 |
| b-0.001 | |||||
| Phosphorus | 405.60±176.05 | 519.36±139.68 | 527.10±129.22 | 0.000 | a-0.004 |
| b-0.001 | |||||
| #Group 3 (n=40) | |||||
| Parameter | 0th month | 6th month | 12th month | Common *P | **P (B/w months) |
| Mean±SD | Mean±SD | Mean±SD | |||
| PCS | 66.2±12.16 | 74.2±10.81 | 73.8±9.27 | 0.000 | a-0.000, |
| b-0.000, | |||||
| MCS | 84.8±8.41 | 54.0±10.72 | 82.2±5.53 | 0.000 | a-0.000, |
| c-0.000 | |||||
| Total calories | 1489.32±294.80 | 1470.00±139.26 | 1525.12±129.06 | 0.287 | c-0.034 |
| Protein | 34.77±14.91 | 43.34±19.61 | 42.05±9.85 | 0.021 | b-0.010 |
| Phosphorus | 417.27±178.98 | 520.14±235.38 | 504.66±118.20 | 0.021 | b-0.010 |
| ##Total Participants (n=120) | |||||
| Parameter | 0th month | 6th month | 12th month | Common *P | **P (B/w months) |
| Mean±SD. | Mean±SD. | Mean±SD. | |||
| PCS | 66.5±13.52 | 75.2±11.87 | 75.1±9.76 | 0.000 | a-0.000, |
| b-0.000 | |||||
| MCS | 84.9±10.18 | 53.7±11.98 | 82.9±6.79 | 0.000 | a-0.000, |
| c-0.000 | |||||
| Total calories | 1505.83±270.82 | 1459.02±133.05 | 1533.20±140.78 | 0.009 | c-0.000 |
| Protein | 42.93±17.97 | 42.32±14.10 | 41.94±9.81 | 0.754 | -- |
| Phosphorus | 515.19±215.69 | 507.90±169.26 | 503.35±117.72 | 0.754 | -- |
| Parameters | Stage III | Stage IV | ***P (B/w Stages) |
||||||||
|---|---|---|---|---|---|---|---|---|---|---|---|
| 0th month | 6th month | 12th month | *Common | **P (B/w months) |
0th month | 6th month | 12th month | *Common | **P (B/w months) |
||
| Mean±SD | Mean±SD | Mean±SD | P | Mean±SD | Mean±SD | Mean±SD | P | ||||
| PCS | 67.3±12.72 | 76.2±11.53 | 74.8±10.96 | 0.000 | a-0.000 b-0.000 c-0.156 |
65.5±14.55 | 73.9±12.29 | 75.4±8.00 | 0.000 | a-0.000 b-0.000 c-0.632 |
0.557 |
| MCS | 85.1±10.63 | 52.6±12.79 | 82.5±6.68 | 0.000 | a-0.000 b-0.149 c-0.000 |
84.7±9.66 | 55.2±10.78 | 83.5±6.95 | 0.000 | a-0.000 b-1.000 c-0.000 |
0.422 |
| eGFR | 40.75±10.37 | 39.60±14.35 | 38.57±12.28 | 0.112 | a-0.948 b-0.130 c-0.682 |
26.03±7.78 | 28.45±13.74 | 27.22±10.73 | 0.140 | a-0.333 b-0.684 c-0.650 |
0.000 |
| S.albumin | 3.98±0.53 | 4.24±0.56 | 4.17±0.27 | 0.000 | a-0.001 b-0.010 c-0.563 |
4.05±0.58 | 4.12±0.41 | 4.19±0.34 | 0.299 | a-1.000 b-0.512 c-0.850 |
0.890 |
| Phosphorus | 4.21±0.76 | 4.07±0.61 | 3.99±0.51 | 0.030 | a-0.317 b-0.060 c-0.314 |
4.35±0.71 | 4.13±0.64 | 4.11±0.67 | 0.018 | a-0.052 b-0.064 c-1.000 |
0.296 |
| iPTH | 298.00±277.73 | 260.68±171.18 | 262.85±177.49 | 0.236 | a-0.592 b-0.060 c-1.000 |
352.88±330.34 | 293.25±239.75 | 328.13±254.42 | 0.132 | a-0.165 b-1.000 c-0.198 |
0.198 |
| FGF23 | 88.41±416.09 | 13.99±29.93 | 64.03±241.13 | 0.248 | a-0.377 b-1.000 c-0.253 |
53.59±266.28 | 12.29±10.89 | 21.34±68.36 | 0.331 | a-0.796 b-1.000 c-0.922 |
0.328 |
| T. Calories | 1508.72±307.92 | 143.51±124.03 | 1528.13±136.38 | 0.026 | a-0.170 b-1.000 c-0.000 |
1502.05±215.74 | 1488.46±139.76 | 1539.82±147.41 | 0.183 | a-1.000 b-0.844 c-0.007 |
0.442 |
| Carbohydrates | 259.82±70.16 | 254.56±39.85 | 269.20±54.10 | 0.257 | a-1.000 b-1.000 c-0.149 |
260.83±50.82 | 275.48±37.67 | 273.22±59.72 | 0.250 | a-0.273 b-0.699 c-1.000 |
0.174 |
| Protein | 41.77±19.74 | 42.88±16.28 | 42.22±10.18 | 0.876 | a-1.000 b-1.000 c-1.000 |
44.44±15.41 | 41.59±10.71 | 41.58±9.38 | 0.253 | a-0.597 b-0.704 c-1.000 |
0.887 |
| Phosphorus | 501.35±236.91 | 514.58±195.46 | 506.71±122.24 | 0.876 | a-1.000 b-1.000 c-1.000 |
533.28±185.00 | 499.15±128.54 | 498.96±112.57 | 0.253 | a-0.597 b-0.704 c-1.000 |
0.726 |
Two-way repeated measures(ANOVA) showing mean±SD in different timelines from 0 to 12 months and *P-value, and **P-value is estimated using univariate and pair-wise comparison in repeated measures:(a) 0th vs. 6th month,(b) 0th vs. 12th month,(c) 6th vs. 12th month. Two-way repeated measure(ANOVA) showing ***P-value is estimated using post hocin repeated measures between two stages of CKD. PCS=physical component score, MCS=mental component score, eGFR=estimated glomerular filtration rate, iPTH=Intact Parathyroid Hormone & FGF23=fibroblast growth factor 23, SD=standard deviation.
PCS and Groups: A two-way repeated measures ANOVA determined mean value of PCS which is statistically significant between time intervals (F = 82.96, df = 1.769 and 206.96, P < .001). A post-hoc test using Bonferroni correction revealed about 9% increase in the average PCS score from 0 to 6 months (66.5 ± 13.52 and 75.2 ± 11.87; P < 0. 001). Thereafter, the mean PCS plateauedat 75.1 ± 9.76 after 12 months. The three group means, however, did not show any significance among themselves over the three time periods. Also, we did not find any association between time and the groups. In one-way repeated measures ANOVA, the mean differences of PCS during the three time intervals showed a significant difference between the 0th and 6th month and the 0th and 12th months. However, the difference was not significant between all groups [Table 2 and Figure 2a].

- Two-way repeated measure (ANOVA), P-value is estimated using post hoc in (a and b) among groups and (c and d) between stages of CKD. CKD: chronic kidney disease, PCS: physical component score, MCS: mental component score.
MCS and Groups: Two-way repeated measures ANOVA revealed a significant lower mean MCS during the sixth month (84.9 ± 10.18, 53.7 ± 11.17); it rose again to 82.9 ± 6.79, levelling off the baseline level. Here again, the three groups remained in significant among themselves across every time period (P > 0.05). In one-way repeated measures ANOVA, the mean differences of MCS during the three time intervals showed significant difference between 0th and 6th month and the 6th and 12th month. However, the difference was not significant between all groups [Table 2 and Figure 2b]. Similar to PCS, we did not find any association between time and the groups.
Nutrition and Groups: The mean calorie values did not change between the 0th and 6th months, but rose significantly from 6 months to 1 year to level off the initial values. Group 1 shows a significant decline of means from 0 to 6 months, with no change there after. Group 2 showed no significant difference during the study period; in group 3, the mean value increased significantly in 12 months’ time. The mean value of both dietary intake of protein and phosphorus showed a similar trend across the time intervals. Whilethe overall mean values did not differ significantly across the three time intervals, group differences were seen. All three groups means of both the protein and phosphorus intake initially declined significantly but recovered to the original value at 12 months.
PCS and CKD Stages: Two-way repeated measures ANOVA indicated the existence of significant differences among different timelines across two CKD stages (F = 83.992, P < 0.001). There was a significant increase in mean values from the 0th month to the 6th month (66.5 ± 13.51 to 75.2 ± 11.87, P < 0.001); thereafter it remained the same at 12 months (75.1 ± 9.76, P > 0.05). We did not find any association between time and stages (F = 1.593, P = 0.209) [Table 3 and Figure 2c].
MCS and CKD Stages: Two-way repeated measures ANOVA suggested the existence of a significant difference in mean MCS across timelines (F = 486.99, P < 0.001). Post-hoc analysis revealed significant differences between the 0th month and the 6th month, when the mean of MCS decreased from 84.3 to 53.7 (P < 0.001), and later it increased to 82.9 in the 12th month (P < 0.001).The stages did not come out with significant differences among themselves at any time line. Again, we did not find any association between groups and timeline (F = 0.923, P = 0.366) [Table 3 and Figure 2d].
Other Parameters and CKD Stages: There was no significant difference in eGFR observed in both the stages. The biochemical parameters, namely, serum albumin, serum phosphorus, iPTH, and FGF23 did not show any difference across timelines in both the stages. Similarly, the nutritional parameters, namely, carbohydrate, protein, and phosphorus did not show any difference across timelines in both the stages. However the total mean calorie values increased significantly at the 12th month in both the stages [Table 3].
Multiple regression analysis in age, diabetes, hypertension, eGFR, anemia, albumin, phosphorus, iPTH, FGF23, calories, carbohydrate, phosphorus, and total protein intake as dependent variables yielded R2 of 13.7% and 18.1% in PCS and MCS, respectively.
Discussion
The present study assessed the pattern of HRQoL progression and its relation with three hyperphosphatemia management groups in early CKD patients. All three groups showed better progression of PCS over the study period; however, there were decrease in MCS during the initial six-month period, which improved over time. There was no significant difference of HRQoL between stage 3 and stage 4 CKD.
The SF-36, Kidney Disease Quality of Life 36 (KDQoL-36), and EuroQoL (EQ-5D questionnaires are commonly used to assess the quality of life changes in aCKD population.13,14 Here, the SF-36 version 1 was used to assess HRQoL by considering an early CKD of mean eGFR 34.8 ± 11.84 ml/min. This study has not used version 1.3 which contains 11 questions pertaining to late-stage CKD and/or dialysis patients. Version 1 is the partial of version 1.3 questionnaire which had already been used in both local language and in English.7,15 In past, we had studied the QOL by using an easier tool of 12 questions instead of 35 questions of SF-36 among 1019 outpatient kidney disease patients. By doing a factorial analysis, we concluded there were 69.3% of variances from the original questionnaire with our 12 questionnaire based study. Each factor was categorized as physical, mental, bodily pain, vitality, resigned to fate, and vulnerability.16 Pagels et al. also commented that a less time-consuming set of 12 questions can be considered as adequate to measure the quality of life instead of the standard 36 questions.17
We observed a significant improvement in mean PCS over the period of 12 months in all three groups; this may have been because of better control of calcium and phosphorus, as shown in a Malaysian study.18 In the Malaysian study Khor BH et al.18 also showed that older age, women, and anemia were associated with lower quality of life. But there was a significant improvement in hemoglobin levels over a period of 12 months, which might have also improved the PCS. Furthermore, all the three methods of hyperphosphatemia management may have also been responsible for the improving PCS. These results, therefore, show that assessment of HRQoL from the early stage of CKD could be a useful tool in order to improve physical health and well-being.
Contrary to the PCS, MCS did not show increasing trends in our study. The reason that MCS initially decrease din the first six months (rising to baseline level later) could be due to fear and anxiety of worsening the very disease. Higher MCS scores were found, as expected, perhaps because the symptoms of kidney disease appear at the late stages. It will be too much to expect any significant increase in MCS after any form of hyperphosphatemia management because the basal scores were already on the higher side about 85% in both the stages. As shown in our study, Alam et al.19 also observed that symptoms at CKD stages III and IV had the least effect on the MCS, as the mean scores ranged higher above 66.7%. Singh et al.20 found that 44% of participants with low mental health score and 17.5% of those with a high mental health score were not correlated with survey outcomes in 92 Maintenance Heamodialysis patients. Federica Guerra et al.21 showed that end-stage renal disease patients could experience more overload towards poor health outcomes and that integrated biological and psychological measurements could prevent increased negative mental health through a patient-centered approach.
The general population enjoys higher HRQoL in all the domains than patients with CKD. Social disparities, CKD-related factors, and severity grade of CKD canalso influence HRQoL. There are many factors that negatively impact HRQoL in CKD, such as depression, anxiety, cognitive impairment, inactivity, and frailty.22 A Brazilian report found worse quality of life with old age, women, lower education, lower income, being professionally inactive, and having anemia. Interestingly, the stage of CKD, even being on dialysis, was not found to have a major effect.23 Pre-dialysis and kidney transplant patients have better HRQoL than the dialysis population. This was shown by Mujais et al.24 in their prospective study of 1186 patients; lower scores were associated with the severity of CKD, women, diabetes, and a history of cardiovascular comorbidities. Our previous study11 and Park et al.22 showed that renal transplant patients scored better than pre-dialysis patients. Also patients with CKD stages IV and V and not on dialysis had a better score compared to those on dialysis.16,22 Due to early stages of CKD, we did not find the influence of these factors in the present study. In a cross-sectional study from India, Aggarwal et al.2 showed that patients with CKD and not on dialysis hadlow QoL scores in patients with eGFR <30 ml/min per 1.73 m2 and found significant deteriorating eGFR over time. As against the above-mentioned study, our study population had a selection bias of relatively younger, male-predominant population and higher level mean eGFR. In literature, it has been presumed that scores more than one standard deviation below the mean may signify a degree of health risk, but this assessment was not possible in our study.7 Hong et al.25 investigated the association between the severity of CKD on HRQoL in DM patients of Korean population in a cross-sectional study by applying self-administered European Quality of Life Questionnaire. They concluded that assessment of HRQoL is necessary for management at early stages of Diabetic kidney disease.
The association of serum phosphorus with HRQoL was not the way it was expected, because of early CKD patients included in this study. In the literature, too, there is a lack of definitive high-grade evidence for the impact of phosphate-binding therapies on quality of life. Moreover, KDIGO also emphasized on the need forevaluation to assess the impact of serum calcium and phosphorus on HRQoL.10 However, the target level of calcium and phosphorus was not achieved due to the short period of the study.
Similar to our findings in early-stage CKD population, the presence of diabetes, hypertension, high serum phosphorus, low albumin, and elevated parathyroid hormone had no impact on the PCS or MCS at the baseline.7 Other relevant variables like iPTH, FGF23, total calories, carbohydrate, phosphorus, and total protein intake also have little association with PCS and MCS. Pagels et al.17 has shown that all HRQoL dimensions deteriorated significantly with CKD stages. Similar to our study, Wee et al.8 also showed that anemia had not much impact on HRQoL among 69 pre-dialysis CKD patients. While it is encouraging that pre-dialysis patients with anemia can carry out as many physical activities as and feel as energetic as those without anemia, we need to be aware of its potential impact on adherence to anemia treatment.
Strengths: We studied the treatment effects of hyperphosphatemia on HRQoL. Since MBD develops as early as at moderate CKD, knowledge of its effects on the HRQoL of patients with stages III and IV CKD would be useful.
Limitations
The cohort was small as it was a single-center study of short duration. Therefore, we may not extrapolate our findings to other geographical regions. The long-term compliance of intervention would have been guided for better quality of life scores related to the management of hyperphosphatemia. We did not consider the socioeconomic and clinical phenotype assessments and the other therapeutic modalities that might impact the HRQoL. The individuals’ assessment of their health status is strongly subjective and should be kept in mind when interpreting the results.
Conclusion
This longitudinal study showed a significant positive change in PCS scores in all hyperphosphatemia management groups over a period of 12 months. Furthermore, among the three groups the incremental changes in PCS and MCS scores were insignificant. Future studies on QoL based on the latest version of the SF-36 questionnaire and specifically analyzing both the scores are required for assessment and prognosticate to all CKD patients. A randomized control trial is needed to study different hyperphosphatemia treatment with the quality of life assessment.
Conflicts of interest
There are no conflicts of interest.
Financial support and sponsorship
Nil.
References
- Health-related quality of life impacts mortality but not progression to end-stage renal disease in pre-dialysis chronic kidney disease: A prospective observational study. PLoS One. 2016;11:e0165675.
- [CrossRef] [PubMed] [Google Scholar]
- Health-related quality of life in different stages of chronic kidney disease. QJM. 2016;109:711-6.
- [CrossRef] [PubMed] [Google Scholar]
- Predictors and outcomes of health-related quality of life in adults with CKD. Clin J Am Soc Nephrol. 2016;11:1154-62.
- [CrossRef] [PubMed] [Google Scholar]
- Why does quality of life remain an under-investigated issue in chronic kidney disease and why is it rarely set as an outcome measure in trials in this population? Nephrol Dial Transplant. 2017;32(suppl_2):ii47-52. doi: 10.1093/ndt/gfw399
- [CrossRef] [PubMed] [Google Scholar]
- EBOOK: Handbook of health research methods: Investigation, measurement and analysis McGraw-Hill Education (UK); 2005. p. :639.
- [Google Scholar]
- Quality of life and its predictors among patients with chronic kidney disease: A hospital-based cross sectional study. PLoS One. 2019;14:e0212184.
- [CrossRef] [PubMed] [Google Scholar]
- Assessment of health-related quality of life and its determinants in patients with chronic kidney disease. Indian J Nephrol. 2017;27:37-43.
- [CrossRef] [PubMed] [Google Scholar]
- Association of anemia and mineral and bone disorder with health-related quality of life in Asian pre-dialysis patients. Health Qual Life Outcomes. 2016;14:94.
- [CrossRef] [PubMed] [Google Scholar]
- Effect of CKD-MBD phenotype on health-related quality of life in patients receiving maintenance hemodialysis: A cross-sectional study. J Int Med Res. 2020;48:300060519895844.
- [CrossRef] [PubMed] [Google Scholar]
- Executive summary of the 2017 KDIGO chronic kidney disease-mineral and bone disorder (CKD-MBD) guideline update: What's changed and why it matters. Kidney Int. 2017;92:26-36.
- [CrossRef] [PubMed] [Google Scholar]
- Longitudinal Study to find the association of serum phosphorus level with FGF 23 in three different hyperphosphatemia managements groups of stage 3 and 4 chronic kidney disease (CKD) patients. Indian J Nephrol. 2022;32:574-81.
- [CrossRef] [PubMed] [Google Scholar]
- The “phosphorus pyramid”: A visual tool for dietary phosphate management in dialysis and CKD patients. BMC Nephrol. 2015;16:9.
- [CrossRef] [PubMed] [Google Scholar]
- Definition and classification of chronic kidney disease: A position statement from kidney disease: Improving global outcomes (KDIGO) Kidney Int. 2005;67:2089-100.
- [CrossRef] [PubMed] [Google Scholar]
- Quality of Life in Chronic Kidney Disease In: Arici M, ed. Management of Chronic Kidney Disease. Berlin, Heidelberg: Springer; 2014. 10.1007/978-3642-54637-2_37
- [CrossRef] [Google Scholar]
- Assessment of quality of life in patients of end stage renal disease on different modalities of treatment. JNMA J Nepal Med Assoc. 2008;47:1-6.
- [CrossRef] [PubMed] [Google Scholar]
- Poster presentations. Indian J Nephrol. 2018;28(Suppl 1):S28-122.
- [CrossRef] [PubMed] [Google Scholar]
- Health-related quality of life in different stages of chronic kidney disease and at initiation of dialysis treatment. Health Qual Life Outcomes. 2012;10:71.
- [CrossRef] [PubMed] [Google Scholar]
- Association of dietary patterns with serum phosphorus in maintenance haemodialysis patients: A cross-sectional study. Sci Rep. 2020;10:12278.
- [CrossRef] [PubMed] [Google Scholar]
- Assessment of quality of life of chronic kidney disease patients receiving hemodialysis with kidney disease quality of lifeTM-36 scale. Mymensingh Med J. 2019;28:906-13.
- [Google Scholar]
- Physical health score assessment may not predict mental health score of dialysis patients. Natl Kidney Foundation J Nephrol Soc Work. 2017;41:19-21.
- [CrossRef] [Google Scholar]
- Chronic kidney disease and its relationship with mental health: Allostatic load perspective for integrated care. J Pers Med. 2021;11:1367.
- [CrossRef] [PubMed] [Google Scholar]
- CKD and health-related quality of life: The Korea National health and nutrition examination survey. Am J Kidney Dis. 2016;67:851-60.
- [CrossRef] [PubMed] [Google Scholar]
- Quality of life in patients with chronic kidney disease. Clinics. 2011;66:991-5.
- [CrossRef] [PubMed] [Google Scholar]
- Health-related quality of life in CKD Patients: Correlates and evolution over time. Clin J Am Soc Nephrol. 2009;4:1293-301.
- [CrossRef] [PubMed] [Google Scholar]
- Chronic kidney disease on health-related quality of life in patients with diabetes mellitus: A national representative study. J Clin Med. 2021;10:4639.
- [CrossRef] [PubMed] [Google Scholar]


