

Translate this page into:
Metformin Versus Standard of Care in Patients with Autosomal Dominant Polycystic Kidney Disease – A Randomized Control Trial
Corresponding author: Jasmine Sethi, Department of Nephrology, Postgraduate Institute of Medical Education and Research, Chandigarh, India. E-mail: jasmine227021@gmail.com
-
Received: ,
Accepted: ,
How to cite this article: Venkatasubramanian V, Sethi J, Kumar V, Yadav AK, Lal A, Kohli HS. Metformin Versus Standard of Care in Patients with Autosomal Dominant Polycystic Kidney Disease – A Randomized Control Trial. Indian J Nephrol. 2025;35:410-6. doi: 10.25259/IJN_100_2024
Abstract
Background:
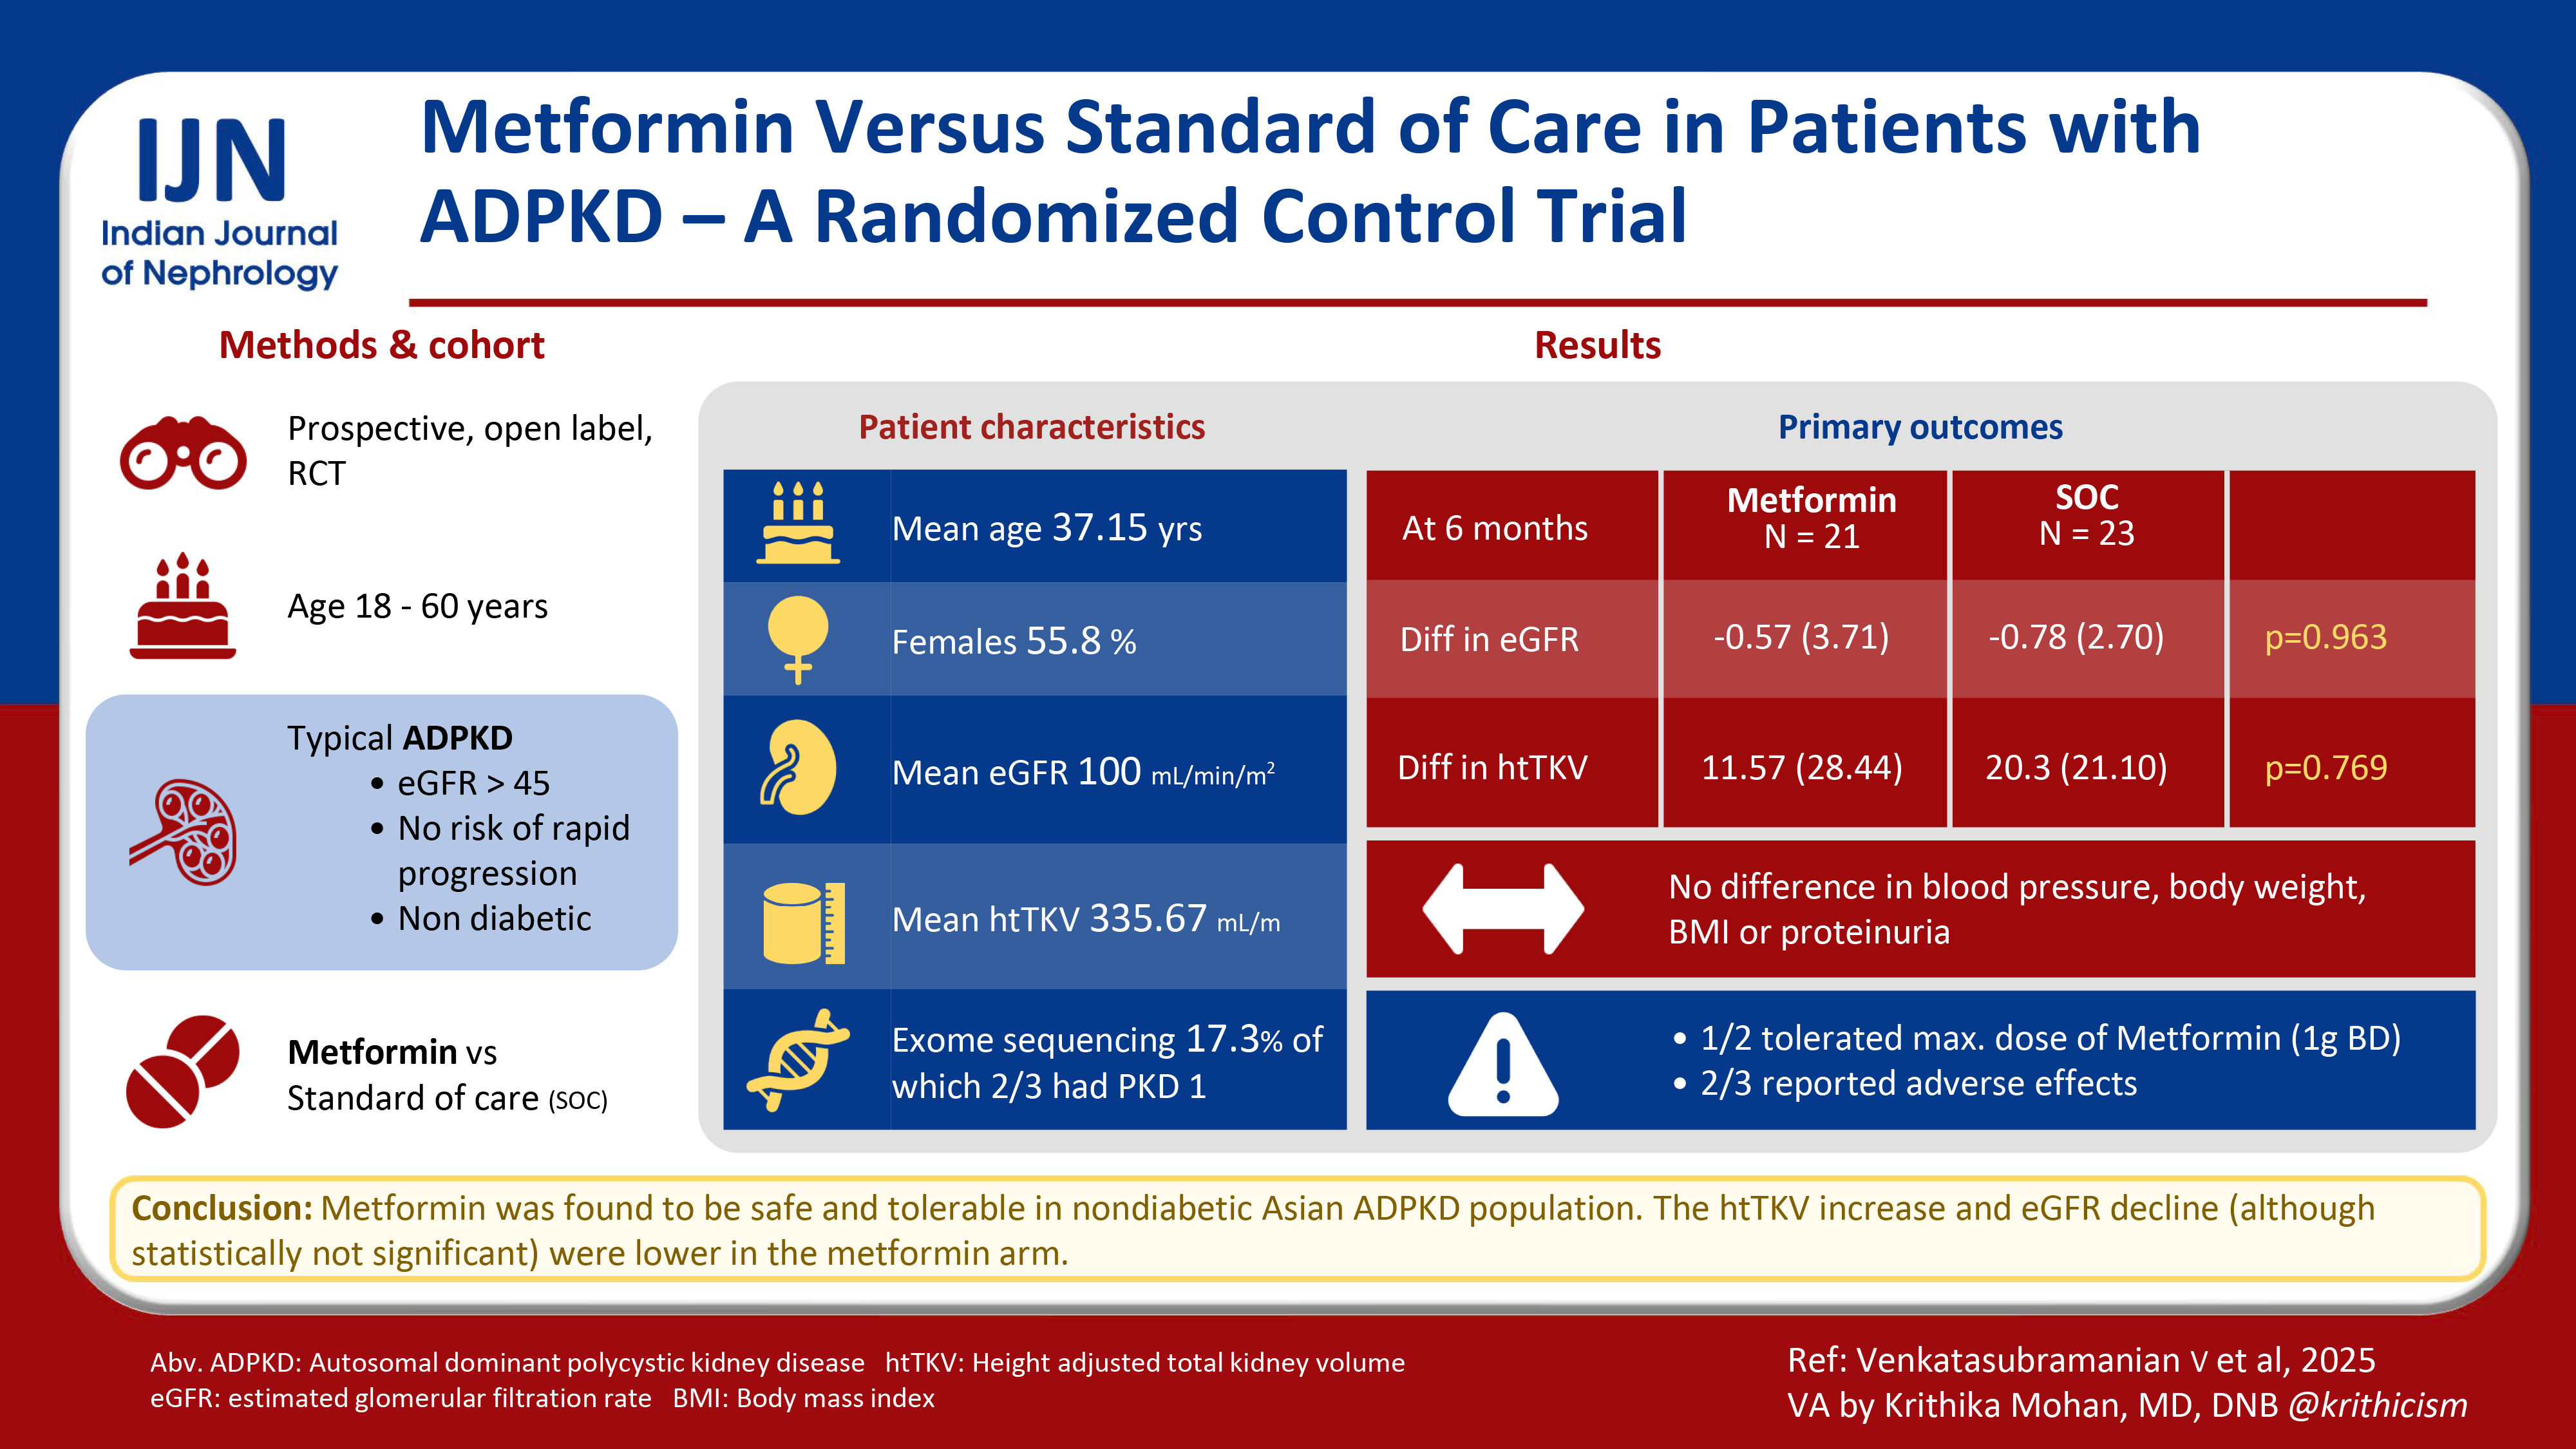
Autosomal dominant kidney disease (ADPKD) is the most common monogenic disorder leading to renal failure with limited therapeutic options. We aimed to assess the efficacy and safety of metformin in nondiabetic ADPKD patients and its role in slowing disease progression.
Materials and Methods:
We conducted a prospective, randomized controlled, open labelled clinical trial and enrolled 52 nondiabetic adults aged 18–60 years with typical ADPKD, estimated glomerular filtration rate (eGFR) > 45 mL/min/m2, and no risk factors of rapid disease progression. Participants were randomized in a 1:1 ratio by a computer-generated random number table into metformin + standard of care group (metformin arm) and standard of care group (Control arm). Primary outcome of the study was to evaluate the effects of metformin versus control arm on the percentage and absolute change in eGFR over a 6-month period.
Results:
Mean (SD) age of the cohort was 37.15 (10.16) years with half of them being females. The mean (SD) baseline htTKV and eGFR were 335.67 (153.3) mL/m and 100.23 (25.95) mL/min/m2, respectively. Clinical exome sequencing was available in nine (17.3%) patients of which two-thirds had PKD1 mutation. Baseline characteristics were distributed equally across randomized groups. Baseline proteinuria was significantly higher in the metformin arm (p = 0.014). The eGFR difference and percentage change in eGFR was not different between the groups at 6 months (p = 0.53 and 0.48, respectively). There was no statistically significant difference in htTKV and percentage change in htTKV at 6 months between the groups, although an increase in htTKV was numerically smaller in the metformin group (p = 0.769, 0.805). Blood pressure, body weight, body mass index (BMI), and proteinuria also did not differ between the two groups. Only half of the cohort tolerated the maximum dose of metformin. Around two-thirds of patients reported adverse effects, most commonly asthenia.
Conclusion:
Metformin appears to be safe and well tolerated in nondiabetic patients with ADPKD.
Keywords
ADPKD
Kidney volume
Metformin

Introduction
Autosomal dominant polycystic kidney disease (ADPKD) is a monogenic disorder characterized by multiple cysts in both kidneys leading to increased kidney volume and progressive renal dysfunction. PKD1 and PKD2 gene mutations cause majority of the cases.1 Apart from lifestyle modifications and control of hypertension, tolvaptan is the only disease-modifying drug that has been approved. Tolvaptan has demonstrated therapeutic benefits in slowing total kidney volume (TKV) growth and reducing estimated glomerular filtration rate (eGFR) decline in rapidly progressive forms of ADPKD (Mayo Class 1C-E).2 Its aquaretic effects, potential hepatotoxicity, and associated costs underscore the necessity for the development of novel therapies. Metformin has displayed promise in inhibiting cystogenesis based on preclinical studies.3,4 Its proposed mechanism of action in ADPKD involves the activation of AMP-activated protein kinase (AMPK), which negatively regulates key factors in cyst development, including the chloride channel cystic fibrosis transmembrane conductance regulator (CFTR) and the mammalian target of rapamycin signalling (mTOR) pathway.5,6 In addition, activated AMPK counteracts transforming growth factor-beta and inhibits epithelial-mesenchymal transition, both contributors to tubulointerstitial fibrosis. The safety and tolerability of metformin is well established in the previous trials. The trial of administration of metformin to tame ADPKD (TAME PKD)7 was a multicenter phase 2 randomized double-blind trial that showed that metformin is safe, effective, and tolerable with slight reduction in eGFR decline at 2 years which was not statistically significant. The trial was not designed to detect any meaningful difference in the rate of kidney function decline between the two groups. Brosnahan et al.8 recently published a randomized feasibility 1 year trial where they compared metformin to control in nondiabetic adult ADPKD patients. Only 50% of the metformin-treated participants completed the trial on full metformin dose, i.e., 1 g bid, and gastrointestinal symptoms were the most common reason for dose reduction. Among the secondary end points, change in htTKV and eGFR were not significantly different in the groups although numerical eGFR decline was less in metformin-treated arm. Both the above trials were mainly safety and tolerability trials and included a heterogeneous cohort with both low- and high-risk Mayo classes. We report our results where we compared the efficacy of metformin versus control in slowing the disease progression in nondiabetic adult low-risk ADPKD participants [Mayo Class (1A-C)] as measured by percentage change in htTKV and eGFR.
Materials and Methods
This pilot study was a parallel group prospective randomized open label study conducted at a tertiary center in Post Graduate Institute of Medical Education and Research Chandigarh, Northern India between January 2022 and July 2023. As it was a pilot trial, a sample size of 20 patients in each group (metformin and control) was taken. Key inclusion criteria of our study were age between 15 and 60 years, diagnosis of ADPKD based on the updated Ravine criteria, eGFR ≥ 45 mL/min/1.73 m2, ability to provide informed consent, and controlled blood pressure <130/80 on a stable regimen of antihypertensive drugs.9 Key exclusion criteria were ADPKD patients who fulfill the criteria of likely rapid disease progression at baseline (Mayo Class 1D and 1E, truncating mutations with PRO-PKD score >6, and lastly Mayo Class 1C with either hematuria/hypertension onset <35 years or kidney length ≥16.5 cm in persons aged < 45 years).9 Other exclusion criteria were diabetes mellitus, intolerance to metformin, uncontrolled hypertension, pregnancy/lactation, systemic diseases that contribute to renal disease other than hypertension, acute or chronic disease-causing tissue hypoxia (like myocardial failure, severe arrhythmia, myocardial infarction, respiratory failure, liver failure, alcohol acute intoxication, alcoholism, and dehydration), and systemic infection. Prediabetic participants as diagnosed by HbA1c levels between 5.7 and 6.5% were included in the study.
Description of intervention
Participants who fulfilled inclusion and exclusion criteria were randomized in a 1:1 ratio by a computer-generated random number table into metformin + standard of care group SOC (metformin arm) and standard of care group (control arm). Allocation concealment was done using sequentially numbered envelopes by a third person. In the metformin arm, the starting metformin (Glycomet) dose was 500 mg twice daily (bid). If the dose was tolerated well, it was up-titrated every 2 weeks to a maximum dose of 1,000 mg twice daily. For participants who could not tolerate the higher dose, the dose was reduced to a previously tolerated dose. In addition to metformin, these participants continued to receive the SOC including antihypertensive (Angiotensin receptor blocker/Angiotensin converting enzyme inhibitor (ACEi/ARB)) to target a blood pressure of 110/75 mm Hg and adequate fluid intake of at least 3 L per day with avoidance of caffeine/tea. For participants whose eGFR decreased below 45 mL/min/1.73m2 during the study duration, metformin was discontinued. Metformin was also discontinued in cases of severe gastrointestinal symptoms, symptomatic hypoglycemia despite dose reduction, and lactic acidosis (defined as lactate levels > 4 mmol/L). The study participants in the control arm continued to receive the standard of care treatment including antihypertensive [Angiotensin receptor blocker/Angiotensin converting enzyme inhibitor (ACEi/ARB)] to target a blood pressure of 110/75 mm Hg and adequate fluid intake of at least 3 L per day with avoidance of caffeine/tea.
Safety, monitoring, and measurements
Patient demographics, comorbidities, and detailed family history were obtained from the patients’ hospital records. Blood pressure was measured at baseline and during each follow-up visit in a seated position, after at least 5 minutes of rest, with automated sphygmomanometers, using the calculated average of two measures. Serum creatinine was measured with an isotope dilution mass spectrometry–traceable assay, and eGFR was estimated using the creatinine-based chronic kidney disease epidemiology collaboration (CKD–EPI) equation.10 Mayo imaging classification for each patient was assigned on the basis of htTKV and age, after initial classification of kidney cyst pattern as typical (class 1) or atypical (Class 2) based on noncontrast CT. The typical imaging (Class 1) pattern for the Mayo clinic imaging classification is defined as bilateral and diffuse cyst distribution, where all cysts similarly contribute to TKV.11 htTKV was estimated at baseline and 6 months using the ellipsoid equation using noncontrast CT.12 Genetic testing was done at baseline by clinical exome sequencing for targeted ADPKD genes. Patients were followed up at 4, 8, 12, and 24 weeks. Fasting blood sugar was measured at baseline, biweekly in the first month, and then at 8, 12, and 24 weeks. Serum lactate level was measured at baseline, 4, and 8 weeks.
Primary and secondary outcomes
The primary outcome of the study was to evaluate the effects of metformin versus control on the percentage and absolute change in eGFR over a 6-month period. Secondary outcomes were to evaluate the percentage and absolute change in TKV (htTKV mL/m) from baseline over a 6-month period; evaluate metformin tolerability; evaluate the effects of metformin versus control on the changes in body weight, BMI, blood pressure, and urine protein excretion from the baseline over a 6-month period.
Study oversight
The study was approved by the Institute Ethics Committee and was registered with Clinical Trial Registry – India (CTRI) (CTRI/2022/05/042904). Informed consent was obtained from all study participants or their parents/legal guardians in accordance with the declaration of Helenski, and the procedures followed were in accordance with the ethical standards of the responsible committees on human experimentation (institutional and national) and with the declaration of Helenski principles 1975, as revised in 2000. All the participants in the study received a standard of care. The study was conducted without any delay in the management of the patient.
Statistical analysis
All the collected data were entered with the help of MS Excel and exported to a separate software for statistical analysis. The descriptive statistics for categorical data was presented with the help of percentage/proportions/bar chart/pie chart, or with a combination of techniques, and continuous data were described by mean/median and standard deviation/interquartile range. For normally distributed data, paired t-test was used to perform analysis within the groups and unpaired t-test was used for analysis between the groups. Nonnormally distributed data were analyzed using Mann––Whitney U test. Categorical variables were analyzed using fisher’s exact test or chi-square test. A two-tailed p value ≤ 0.05 was used to declare the statistical significance.
Results
A total of 65 patients were screened and 52 were randomized into the metformin arm (N=26) and a control arm (N=26). A total of 5 patients in the metformin arm and 3 patients in the control arm were lost to follow-up prior to the final visit at 6 months. At 6 months, a total of 44 patients (21 in the metformin arm, and 23 in the control arm) were included for final analysis, as shown in the consort diagram [Figure 1].
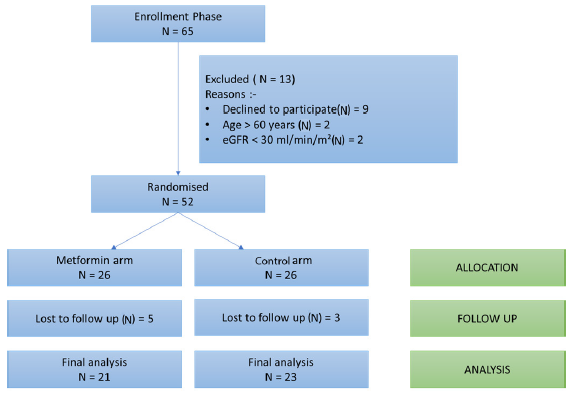
- CONSORT diagram to show the flow of study participants from screening to final analysis. eGFR: Estimated glomerular filtration rate, CONSORT: Consolidated standards of reporting trials.
Mean (SD) age of the study population was 37.15 (10.16) years, and 55.8% were females. Hypertension was present in around one-half of the cohort and around 77% of them were taking ACEi/ARB. Around a quarter of the cohort was prediabetic; the prediabetics were equally distributed in the control and metformin arms. Around two-thirds (61.5%) of the patients had a positive family history of ADPKD. Clinical presenting symptoms were abdominal pain in about two-thirds of the patients (63.5%) followed by renal stone disease (17%) and hematuria (5.8%). Around one-third of the participants (32.7%) were incidentally detected during a routine ultrasonography or as a part of family screening. Mean (SD) serum creatinine was 0.87 (0.25) mg/dl and mean eGFR by CKD EPI equation was 100.23 (25.95) mL/min/m2. Around 14% patients had moderately increased proteinuria (A2). The mean (SD) baseline htTKV was 335.67 (153.3) mL/m with 17.3% of the patients in Mayo 1C Class. Baseline proteinuria was significantly higher in the metformin arm (p = 0.014) [Table 1]. Clinical exome sequencing was available in nine (17.3%) patients of which two-thirds had PKD1 mutation (two-thirds with truncating PKD1 mutation) followed by PKD2 and Col A4 in one (11.1%) patient each.
| Parameter | Total (N = 52) | Control arm (N= 26) | Metformin arm (N = 26) | p value |
|---|---|---|---|---|
| Age (years) | 37.15 ± 10.16 | 36.08 ± 9.2 | 38.23 ± 11.1 | 0.450 |
| Male | 23 (44.2) | 11 (42.3) | 12 (46.1) | 0.78 |
| Abdominal pain | 33 (63.5) | 16(61.5) | 17 (65.3) | 0.773 |
| Abdominal distension | 2 (3.8) | 0 | 2 (7.6) | 0.149 |
| RSD | 9 (17.3) | 4 (15.3) | 5 (19.2) | 0.714 |
| Hematuria | 3 (5.8) | 1 (3.8) | 2 (7.6) | 0.552 |
| Incidentally detected | 17 (32.7) | 9 (34.6) | 8 (30.7) | 0.768 |
| Smoking | 1 (1.9) | 0 | 1 (3.8) | 0.313 |
| Alcohol | 1 (1.9) | 0 | 1 (3.8) | 0.313 |
| Hypertension | 26 (50) | 12 (46.1) | 14 (53.8) | 0.579 |
| Prediabetic | 13 (25) | 6 (23.1) | 7 (26.9) | 1.000 |
| ACEi/ARB | 40 (76.9) | 19 (73.1) | 21 (80.7) | 0.510 |
| Family history | 32 (61.5) | 16 (61.5) | 16 (61.5) | 1.000 |
| SBP (mm Hg) | 125.42 ± 12.5 | 123.08 ± 11.1 | 127.77 ± 13.68 | 0.122 |
| DBP (mm Hg) | 78.3 ± 7.97 | 77 ± 7.35 | 79.62 ± 8.48 | 0.198 |
| MAP (mm Hg) | 94.01 ± 9.05 | 92.35 ± 7.9 | 95.66 ± 9.8 | 0.190 |
| Weight (Kg) | 63.15 ± 11.39 | 64.42 ± 12.60 | 61.88 ± 10.14 | 0.427 |
| BMI (Kg/m2) | 23.87 ± 3.53 | 24.09 ± 3.6 | 23.6 ± 3.4 | 0.662 |
| Liver cysts | 33 (63.5) | 16 (61.5) | 17 (65.3) | 0.773 |
| Serum creatinine (mg/dl) | 0.87 ± 0.25 | 0.87 ± 0.22 | 0.86 ± 0.27 | 0.905 |
| CKD EPI eGFR (mL/min/m2) | 100.23 ± 25.95 | 100.34 ± 26.49 | 100.11 ± 25.93 | 0.927 |
| eGFR < 60 mL/min/m2 | 2 (3.8) | 1 (3.8) | 1 (3.8) | 1.000 |
| Baseline proteinuria (mg/24 hours) | 180.34 ± 124.02 | 141.98 ± 93.24 | 218.71 ± 140.08 | 0.014 |
| A1 | 45 (86.5) | 25 (96.1) | 20 (76.9) | 0.099 |
| A2 | 7 (13.5) | 1 (3.8) | 6 (23.1) | |
| A3 | 0 | 0 | 0 | |
| htTKV (mL/m) | 335.67 ± 153.03 | 332.56 ± 154.04 | 338.83 ± 155.0 | 0.985 |
| Mayo Class 1A | 20 (38.4) | 10 (38.4) | 10 (38.4) | 0.731 |
| Mayo Class 1B | 22 (42.3) | 12 (46.1) | 10 (38.4) | |
| Mayo Class 1C | 9 (17.3) | 4 (15.3) | 5 (19.2) | |
| Mayo Class 1D | 1 (1.9) | 0 | 1 (3.8) | |
| Genetic testing available | 9 (17.3) | 5 (19.2) | 4 (15.3) | 0.350 |
| Types of mutation | ||||
| PKD1 | 6 (66.7) | 2 (40) | 4 (100) | |
| PKD2 | 1 (11.1) | 1 (20) | 0 | |
| Other | 2 (22.2) | 2 (40) | 0 | |
| High risk genetic mutation | 4 (7.6) | 1 (3.8) | 3 (11.5) | 0.206 |
RSD: Renal stone disease, ACEi/ARB: Angiotensin-converting enzyme inhibitor/Angiotensin receptor blocker, SBP: Systolic blood pressure, DBP: Diastolic blood pressure, MAP: Mean arterial pressure, BMI: Body mass index, htTKV: Height adjusted total kidney volume, eGFR: Estimated glomerular filtration rate, proteinuria < 300 my/24 hours: A1, 300–3,500 mg/24 hours: A2, > 3.5g/24 hours: A3, CKD EPI: Chronic kidney disease epidemiology collaboration, eGFR: Estimated glomerular filtration rate, PKD: Polycystic kidney disease.
Study outcomes
The mean 6 monthly decline in eGFR was −0.7 mL/min per 1.73 m2 in the control group and −0.57 mL/min per 1.73 m2 in the metformin group (mean difference −0.21 mL/min per 1.73 m2; p = 0.96, 95% CI: −9.31–8.53). The mean 6 monthly percentage change in eGFR was not statistically significant between the two groups; however, the 6 monthly decline in eGFR was much smaller in the metformin arm. The mean 6 monthly percent change in htTKV was 6.3% and 3.5% in the control and metformin arm, respectively (mean difference 2.73, p = 0.80, 95% CI: −16.5–21.9) [Table 2, Figure 2]. Mean htTKV difference at 6 months from baseline was not significantly different between the two groups although htTKV increase was numerically smaller in the metformin arm (20.3 mL/m and 11.5 mL/m in the control and metformin group, respectively, p = 0.769). Figure 3 shows the line diagram comparing the mean eGFR and 24-hour urine protein between the two groups at baseline and at 6 months. Blood pressure, body weight, and body mass index (BMI) were not significantly different at 6 months as compared to baseline in both groups. Fasting lipid profile and proteinuria were also not significantly different at 6 months from baseline among groups.
| Parameter | Control arm (n= 23) Mean (SE) | Metformin arm (n = 21) Mean (SE) | p-value |
|---|---|---|---|
| eGFR difference at 6 months | −0.783 (2.70) | −0.57 (3.71) | 0.963 |
| Percentage eGFR change | 0.92 (3.08) | 1.52 (4.29) | 0.910 |
| htTKV difference | 20.3 (21.10) | 11.57 (28.44) | 0.769 |
| % Change in htTKV | 6.3 (6.29) | 3.5 (7.67) | 0.805 |
htTKV: height adjusted total kidney volume, eGFR: Estimated glomerular filtration rate
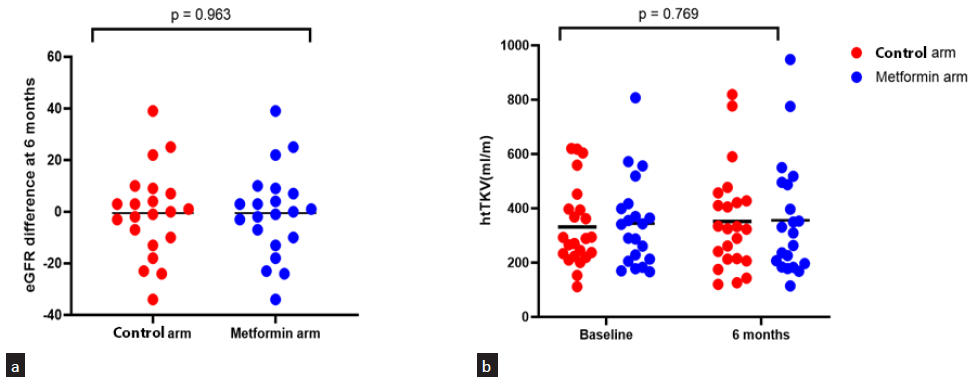
- Scatter plot showing (a) eGFR and (b) htTKV difference between 2 groups at 6 months (Line depicts mean). htTKV: height adjusted total kidney volume, eGFR: Estimated glomerular filtration rate.
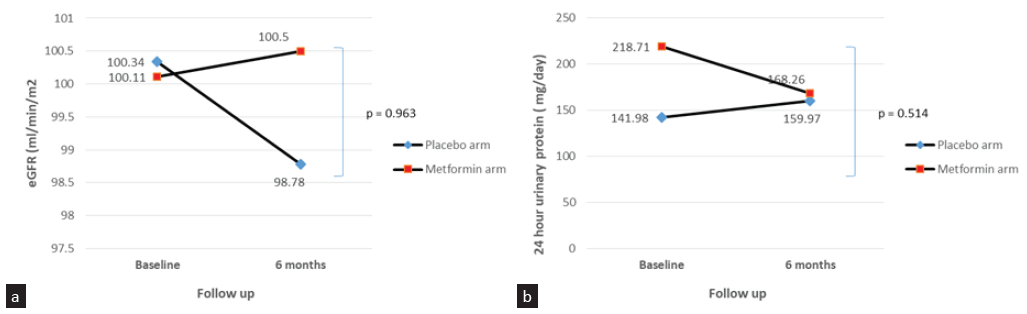
- Line diagram comparing (a) mean eGFR and (b) proteinuria at baseline and 6 months between 2 groups. eGFR: Estimated glomerular filtration rate.
To explore further any potential signal for efficacy, we repeated the analyses for patients who completed the study on full-dose metformin (1 g BD), patients with htTKV > 300 mL/m, and patients with Mayo Class 1C. HtTKV percentage change was numerically smaller in the metformin arm in patients who completed the study on metformin full dose (6.3 (6.29) vs 9.9 (6.5), p = 0.085) and those with Mayo Class 1C at baseline (8.4 (10.2) vs 6.6 (8.5), p = 0.421) [Table 3]. Only two patients completed the study on minimal metformin dose, i.e., 500 mg twice daily. We didn’t compare the outcome measures as the number was too small for any meaningful difference.
| Subgroup who completed study with full dose of metformin versus control arm | |||
|---|---|---|---|
| Parameter | Control arm (n=23) | Metformin arm (n=12) | p-value |
| htTKV difference | 25.66 (21.10) | −38.84 (21.16) | 0.068 |
| Percentage change in htTKV | 6.3 (6.29) | −9.9 (6.5) | 0.085 |
| eGFR difference | −2.8 (3.2) | −5.00 (4.4) | 0.668 |
| Weight difference | −0.4 (0.38) | −1.5 (0.83) | 0.400 |
| BMI difference | −0.08 (0.12) | −0.55 (0.28) | 0.155 |
| Subgroup with htTKV > 300 mL/m | |||
| htTKV difference | 28.4 (48.12) | 21.8 (51.13) | 0.927 |
| Percentage change in htTKV | 5.6 (7.5) | 6.5 (13.3) | 0.957 |
| eGFR difference | −7.4 (5.9) | −3.6 (5.1) | 0.633 |
| Subgroup with Mayo Class 1C | |||
| htTKV difference | 50 (62.23) | −24.4 (52.14) | 0.405 |
| Percentage change in htTKV | 8.4 (10.22) | −6.6 (8.57) | 0.421 |
| eGFR difference | −16 (16.25) | −1 (9.51) | 0.312 |
htTKV: height adjusted total kidney volume, eGFR: Estimated glomerular filtration rate, BMI: Body mass index
Safety profile of metformin
Only 12 out of 21 participants tolerated the maximum dose of metformin. Six patients required dose reduction mainly due to asthenia. Of the 6 participants on reduced dose metformin, 2 were taking 1,000 mg daily and 4 were taking 500 mg daily at 6 months. Three patients required stoppage of metformin in view of nontolerance to the minimal dose. Out of the 21 patients, around two-thirds of patients (61.9%) had side effects. Most common side effect was asthenia/generalized fatigue (42.8%), followed by gastrointestinal side effects (33.3%) [Table 4]. The most common among gastrointestinal side effects was diarrhea followed by bloating sensation. None of the patients had lactic acidosis during the study duration. Two patients had clinical symptoms consistent with hypoglycemia; however, the corresponding blood glucose level was not available.
| Adverse effect | Number of patients (%) |
|---|---|
| Asthenia, generalized fatigue | 9 (42.8) |
| Gastrointestinal | 7 (33.3) |
| Diarrhea | 5 (71.4) |
| Bloating | 2 (28.5) |
| Loss of appetite | 2 (9.5) |
Discussion
Our study provides early data on the safety and tolerability of metformin amongst patients with ADPKD with few risk factors of rapid progression, for which few therapeutic options have been tested. Mean age of our cohort was 37.15 years, and 55.8% of them were females which was in concordance with the results of Brosnahan et al.8 TAME PKD study had higher percentage of females (72.1%) as compared to other studies which was mentioned as a limitation, as males tend to have more severe disease.7 Mean baseline htTKV of our cohort was 335.6 mL/m which was much lower than the previous studies as we included patients with low-risk Mayo Class 1A-C only (700 mL/m and 650 mL/m, respectively, in Perrone et al. and Brosnahan et al. study.7,8 Although the mean eGFR decline was less in the metformin arm than control over 6 months, the difference was statistically insignificant. Mean htTKV difference at 6 months from baseline was not significantly different between the two groups although htTKV increase was numerically smaller in the metformin arm (20.3 mL/m and 11.5 mL/m in the control and metformin group, respectively, p = 0.769). It could be possible that the short follow-up study period of 6 months was the reason that the results were not statistically significant in our study and a longer follow up period could have yielded positive results.
Our results were in concordance with the published literature. The results of TAME PKD study also showed no significant difference in the mean eGFR decline or htTKV progression between metformin and control arms. However, it was mainly a metformin safety and feasibility trial and baseline htTKV was 610 mL/m (as opposed to 333 mL/m in our study) with 48% of participants in high-risk Mayo Imaging Classes (1C, 1D, and 1E).7 Similarly, Brosnahan et al. also showed no significant difference in htTKV and eGFR between the metformin and control groups, but numerically the decline in eGFR was much smaller in the metformin group similar to our study. In subgroup analysis in patients with htTKV>800 mL/m, the change in htTKV was significantly different between the metformin and control arms (smaller in the metformin arm).8
Our study was different from the above two published trials. Patients had less disease severity with well-preserved eGFR and low baseline htTKV. The small sample size and short study duration might have precluded significant results, but we observed a slower eGFR decline by 0.21 mL/min/m2 and slow htTKV progression in the metformin arm. Future trials on metformin with a sufficient sample size and longer study duration and enriched with participants with a high baseline htTKV might be planned to observe meaningful results. Metformin dose titration based on body weight can be a useful approach for future trials. It will allow for personalized dosing, potentially optimizing efficacy while minimizing side effects.
Out of 21 patients in the metformin arm, only 12 (46.1 %) tolerated the full dose of metformin, i.e., 1 g twice daily metformin dose. This was in concordance with the published literature where 44% and 50% of the participants in the metformin arm completed the study on full-dose metformin in the Perrone et al. and Brosnahan et al. studies, respectively.7,8 Gastrointestinal adverse effects were the most commonly reported side effects in the previous studies as opposed to our study where asthenia and fatigue were more commonly observed. Lack of metformin meaningful beneficial effect on eGFR decline and htTKV could also be explained by the fact that only around half of the patients can tolerate the maximal tolerated dose. The remaining patients needed either dose reduction to half/one fourth or even drug discontinuation obviating the beneficial renoprotective effects of the drug.
The strengths of our study include – one of the first randomized prospective studies to evaluate the renoprotective effects of metformin in ADPKD in the Asian population. Secondly, our cohort was uniform with respect to htTKV distribution and included participants with less severe disease with low baseline htTKV as opposed to the previous published studies. Thirdly, it was designed primarily to study the effect of metformin on disease progression, i.e., eGFR decline and htTKV progression as opposed to previous studies that were mainly metformin feasibility and safety studies. Limitations of our study include small sample size and a short follow-up period. Further analysis of the study cohort is ongoing and we plan to analyze it at 12 and 24 months for any meaningful results. Secondly, for advocating metformin use in less severe ADPKD cohort, larget RCTs with long-term follow-up data.
Metformin appears to be safe and tolerable in nondiabetic Asian ADPKD population. The htTKV increase and eGFR decline were less in the metformin arm; however, it was not significantly different between the metformin and control groups. If proved effective in prolonged follow-up studies, metformin can be a useful cost-effective addition to the armamentarium of therapies for this condition.
Acknowledgements
We would like to acknowledge the participating patients and coauthors of our study team.
Conflicts of interest
There are no conflicts of interest.
References
- ADPKD current management and ongoing trials. J Nephrol. 2020;33:223-37.
- [CrossRef] [PubMed] [Google Scholar]
- Tolvaptan in patients with autosomal dominant polycystic kidney disease. N Engl J Med. 2012;367:2407-18.
- [CrossRef] [PubMed] [PubMed Central] [Google Scholar]
- Activating AMP-activated protein kinase (AMPK) slows renal cystogenesis. Proc Natl Acad Sci U S A. 2011;108:2462-7.
- [CrossRef] [PubMed] [PubMed Central] [Google Scholar]
- The combination of metformin and 2-deoxyglucose significantly inhibits cyst formation in miniature pigs with polycystic kidney disease. Br J Pharmacol. 2019;176:711-24.
- [CrossRef] [PubMed] [PubMed Central] [Google Scholar]
- Inhibition of cystic fibrosis transmembrane conductance regulator by novel interaction with the metabolic sensor AMP-activated protein kinase. J Clin Invest. 2000;105:1711-21.
- [CrossRef] [PubMed] [PubMed Central] [Google Scholar]
- The LKB1 tumor suppressor negatively regulates mTOR signaling. Cancer cell. 2004;6:91-9.
- [CrossRef] [PubMed] [Google Scholar]
- Primary results of the randomized trial of metformin administration in polycystic kidney disease (TAME PKD) Kidney int. 2021;100:684-96.
- [CrossRef] [PubMed] [PubMed Central] [Google Scholar]
- Metformin therapy in autosomal dominant polycystic kidney disease: A feasibility study. Am J Kidney Dis. 2022;79:518-26.
- [CrossRef] [PubMed] [PubMed Central] [Google Scholar]
- Recommendations for diagnostic and prognostic evaluation of autosomal dominant polycystic kidney disease (ADPKD) with a focus on imaging. Praxis (Bern 1994). 2018;107:158-64.
- [CrossRef] [PubMed] [Google Scholar]
- National kidney foundation laboratory engagement working group recommendations for implementing the CKD-EPI 2021 race-free equations for estimated glomerular filtration rate: Practical guidance for clinical laboratories. Clini chemistry. 2022;68:511-20.
- [CrossRef] [PubMed] [Google Scholar]
- Atypical polycystic kidney disease as defined by imaging. Sci Rep. 2023;13:2952.
- [CrossRef] [PubMed] [PubMed Central] [Google Scholar]
- Kidney volume estimations with ellipsoid equations by magnetic resonance imaging in autosomal dominant polycystic kidney disease. Nephron. 2015;129:253-62.
- [CrossRef] [PubMed] [Google Scholar]


