

Translate this page into:
Donor-Derived Cell-Free DNA and Active Rejection in Renal Allografts
Address for correspondence: Dr. Harshavardhan Trichy Sanathkumar, Department of Nephrology, Government Stanley Medical College Hospital, No 1, Old Jail road, Old Washermanpet, Chennai -600001, Tamil Nadu, India. E-mail: ts_harshavardhan@yahoo.com
-
Received: ,
Accepted: ,
This article was originally published by Wolters Kluwer - Medknow and was migrated to Scientific Scholar after the change of Publisher.
Abstract
Background:
Renal allograft rejection contributes to significant morbidity and graft loss. In this setting, early detection of rejection is of paramount importance, which currently relies on histopathology. A reliable non-invasive marker to predict rejection would make surveillance and decision-making easier. Donor-derived cell-free DNA (dd-Cf-DNA) has recently been reported as an emerging tool to predict rejection noninvasively. The utility of cell-free DNA in clinical practice has so far not been studied in an Indian setting. As it offers direct clinical application, we have chosen to investigate this biomarker as a tool to predict rejection.
Materials and Methods:
A pilot study with convenient sample size was designed, as this is the first of its kind study so far reported from India. Patients being evaluated with a graft biopsy for graft dysfunction were included. Patients with stable graft function, defined as creatinine within 10% of their best creatinine and no proteinuria for the preceding 12 months, were also included. Ten milliliters of whole blood from each of the recipients was collected in DNA isolation tubes. Two milliliters of donor blood was also obtained in ethylenediaminetetraacetic acid (EDTA) tubes. All recipients also provided a buccal swab. Total cell-free DNA was extracted from 2 ml of recipient plasma using circulating DNA isolation kit. Upon identification of the donor-specific DNA marker for each of the patients from the paired donor sample, presence of the cell-free DNA fraction in the recipient’s plasma was detected and quantified. Renal biopsy reports and clinical details were also recorded. Sensitivity, specificity, positive predictive value (PPV), and negative predictive value (NPV) were analyzed. Receiver operating characteristic (ROC) curve analysis was also performed.
Results:
A total of 31 patients were recruited. Twenty patients underwent graft biopsies for graft dysfunction, of which 12 patients had features of active rejection and eight had nonrejection causes of graft dysfunction. Eleven patients with stable graft were included in the study. In our study, dd-Cf-DNA performed best in predicting antibody-mediated rejection (ABMR) and higher grades of T-cell–mediated rejection (TCMR) (1B). It did not detect TCMR 1A accurately. It serves as a good marker to rule out rejection. It gave a NPV of 100% for TCMR 1B or ABMR, 100% for ABMR alone, and 81% for any rejection. dd-Cf-DNA percentages outperform absolute concentrations in their discriminatory ability.
Conclusion:
We have demonstrated the diagnostic accuracy of dd-Cf-DNA in predicting active rejection of the renal allograft. It performs well in ABMR and higher grades of TCMR. This is the first of its kind study reported from India, to the best of our knowledge. This tool serves as a good rule out test for ABMR and higher grades of TCMR. It performs poorly in TCMR 1A.
Keywords
Biomarker
cell-free DNA
kidney transplant
rejection

Introduction
The accurate detection of renal allograft rejection is paramount in ensuring long-term graft survival. This is usually done by monitoring serum creatinine and often involves performing graft biopsies to determine the cause of graft dysfunction or surveillance biopsies in certain transplant protocols.[1] However, this procedure is invasive and associated with evident risks. Patients often view the procedure negatively and are more inclined to postpone the procedure, leading to a delay in diagnosis and ongoing damage to the allograft. Biopsies also involve repeat admissions, cost, and loss of productivity. It has been well documented that creatinine performs poorly as a surveillance tool, both by virtue of it being a marker that rises late in the timeline of rejection and that it has poor discriminatory ability for the type of underlying pathology.[2] Despite this major limitation, most transplant programs, including ours, utilize creatinine for surveillance. Donor-derived cell-free DNA (dd-Cf-DNA) is an upcoming marker with good reported discriminatory ability to rule out acute rejection in a post kidney transplant setting.[3] Graft injury causes cell breakdown, releasing naked or free donor DNA into the blood stream of the recipient, which, at certain thresholds, can predict rejection. We chose to investigate this marker as a potential tool to diagnose renal allograft rejection and determine if it can discriminate between stable graft function, active rejection, and nonrejection pathologies.
Materials and Methods
Sample size, patient selection, and data collection
This was a prospective study to test the diagnostic accuracy of dd-Cf-DNA. A pilot study with convenient sample size was designed, as this is the first of its kind study so far reported from India and no commercial laboratory offered this testing at the time of the study initiation. Institutional Ethics Committee approval was obtained.
Live related renal transplant recipients who presented with graft dysfunction and had been planned for a graft biopsy as per unit protocol were included as a part of the study. No patients within 2 weeks of transplant or any surgical intervention of the allograft were included. This was done as previous studies have shown that dd-Cf-DNA levels reach a peak immediately after engraftment and stabilize to low levels within 1 week.[4] After the patients gave informed consent, they were subjected to interview and examination to collect baseline data.
Ten milliliters of venous blood was drawn for estimating dd-Cf-DNA levels. All samples were drawn before graft biopsy or 24 h after the biopsy. The latter cut-off was chosen because the half-life of dd-Cf-DNA is less than 1.5 h, and this 24-h delay is sufficient to eliminate the possibility of the biopsy itself elevating the levels. Previous studies have chosen a cutoff of 12 h; we preferred a longer period to have a safer time buffer.[5] Samples were also obtained before the institution of specific therapy, such as pulse steroids or intravenous antibiotics, as these could potentially dampen the dd-Cf-DNA output from the renal allograft. All samples were stored in specialized cell-free DNA (Cf-DNA) preserving tubes (PAXgene tubes) at 4°C. All recipients also provided a saliva/buccal swab sample. Donor blood samples that had been preserved at the time of transplant were utilized or in the absence of the same, 2 ml of donor blood was freshly collected in ethylenediaminetetraacetic acid (EDTA) tube for identification of donor DNA signatures.
All graft biopsies were reported by a single experienced renal pathologist as per the revised Banff 2017 criteria for diagnosis of rejection. Sequential patients being evaluated for graft dysfunction in our unit were included, which resulted in a total of 20 patients.
As controls, 11 patients with stable graft function, who attended follow-up during the same period were chosen. Stable graft function was defined as those patients with creatinine less than 1.5 mg/dl, maintaining within 10% of baseline-best creatinine over the past 12 months, and with proteinuria less than 200 mg/d. Blood and buccal swab samples were obtained from this cohort as mentioned above. All such patients were followed up for at least 12 months post inclusion in the study to confirm stable graft function. If any developed graft dysfunction or proteinuria, they were biopsied and repeat Cf-DNA samples were obtained at the time of the new graft dysfunction.
dd-Cf-DNA estimation – Laboratory work
Ten milliliters of whole blood from each of the patients was collected in PAXgene Cf-DNA tubes (cat# 768115; Qiagen, Hilden, Germany), which were stored and transported to the laboratory at 4°C. Total Cf-DNA was extracted from 2 ml of plasma using circulating DNA isolation kit (cat#MN740300.50; Macherey-Nagel, Düren Germany), and 1 μl of the eluted fraction was quantified by Qubit fluorometer Thermo Fischer Scientific, Waltham, USA). Donor-specific DNA marker was identified by screening of peripheral blood obtained from donor and recipient from an Indian population-specific polymorphism pool (developed by Enable Biolabs India Pvt Ltd, Chennai, India). This was enhanced with simultaneous analysis of recipient-specific markers from buccal swab cells obtained from the recipient. Upon identification of the donor-specific DNA marker (80–120 single-nucleotide polymorphisms) for each of the patients, the markers were given a unique patient identification barcode, which was further used to quantify presence of the marker in the Cf-DNA fraction. The quantification was performed by comparison of the percent amplification of the donor-specific DNA markers in the Cf-DNA fraction with a standard graph and was expressed as nanograms per microliter [Figure 1].
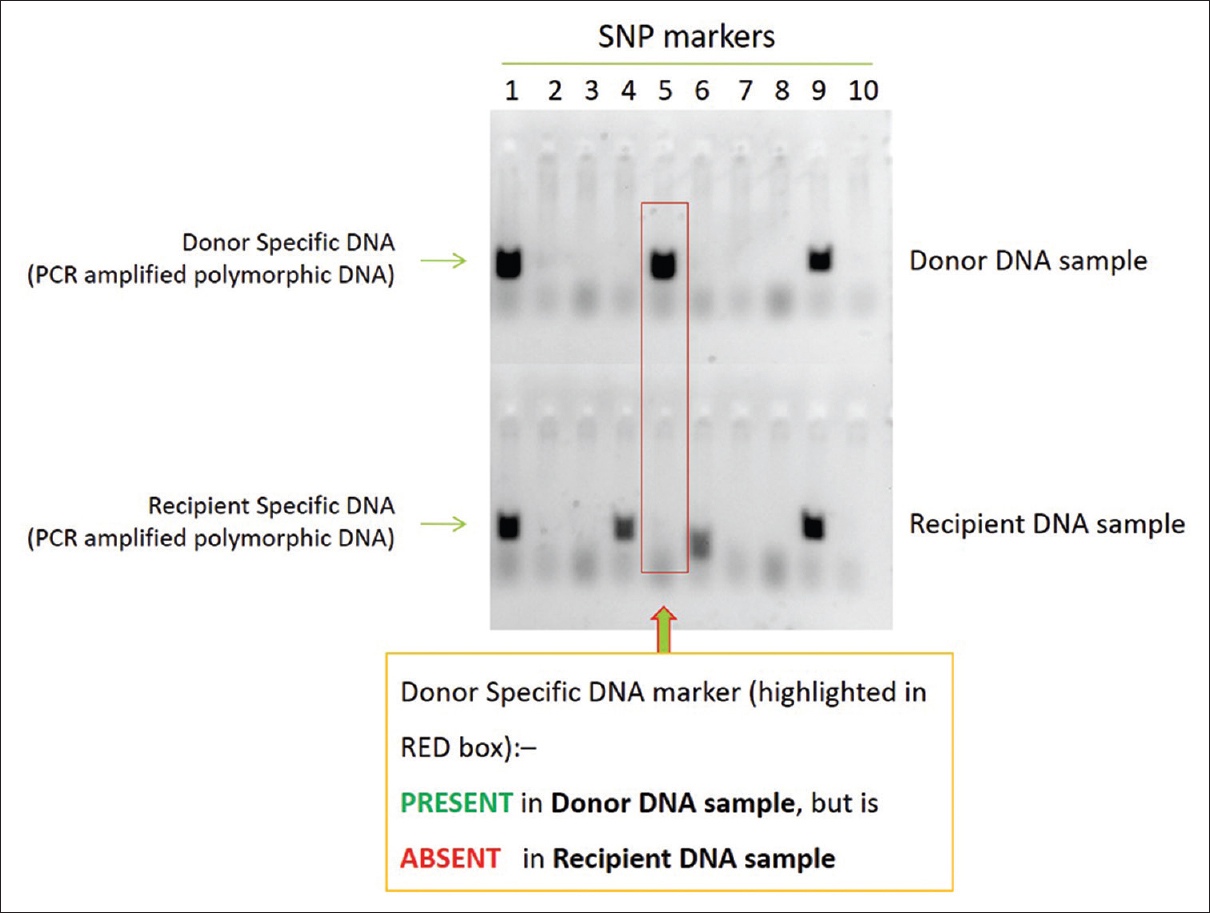
- Identification of DNA markers – bench work
Statistical analysis
Microsoft Excel and IBM Statistical Package for the Social Sciences (SPSS) software were used for analysis. Sensitivity, specificity, and positive and negative predictive values were analyzed. Receiver operating characteristic (ROC) curve analysis was performed to assess discriminatory ability. P value less than 0.05 was considered significant.
Results
Patient characteristics, biopsies, and dd-Cf-DNA samples
Thirty-one transplant recipients were included in this analysis. None of them had been implanted or had undergone surgical manipulation of the graft in the preceding 2 weeks. Twenty patients in this group had been evaluated for graft dysfunction. All underwent graft biopsies as per unit protocol. Out of these, 12 patients had features of active rejection. Eight patients had nonrejection causes of graft dysfunction, including acute tubular injury (ATI) related to calcineurin toxicity, acute pyelonephritis, and one patient with interstitial fibrosis and tubular atrophy. An additional 11 transplant recipients with stable graft function as per the previous definition given in the “Materials and methods” section were included in the study. All such recipients were followed up for a minimum period of 12 months and continued to have stable graft function. Hence, as per our protocol, none of these 11 stable recipients underwent biopsy. This resulted in two groups for comparison – ”active rejection” in 12 patients and “no rejection” in 19 patients. The details of these two groups are presented in Table 1.
| Factor | Active rejection group | No rejection group |
|---|---|---|
| Total no. | 12 | 19 |
| Male | 60% | 73% |
| Mean age in years (SD) | 28.2 (7.2) | 28.1 (6.3) |
| Mean time since transplantation in days | 814 | 649 |
| Mean creatinine (mg/dl) | 2.25 | 1.94 |
| HLA haplomatch | 90% | 73% |
| Spousal (no match) | 10% | 27% |
| Living donor | 100% | 100% |
SD=Standard deviation, HLA=Human leukocyte antigen
Histopathologic classification of graft pathology was done according to Banff Working Groups 2017. Among the 31 patients included, four had active antibody-mediated rejection (ABMR) with coexistent T-cell–mediated rejection (TCMR) and eight had any type of TCMR alone. The distribution of participants across the histopathologic subgroups is presented in Table 2. The diagnosis of calcineurin inhibitor toxicity was suggested based on the presence of single myocyte necrosis and isometric vacuolization in the proximal tubule.
| Stable graft function | 11 |
|---|---|
| Active rejection | |
| ABMR + TCMR | 4 |
| Only TCMR | 8 |
| TCMR 1A | 5 |
| TCMR 1B | 3 |
| Nonrejection graft dysfunction | |
| ATI/CNI toxicity | 4 |
| ATI + IFTA | 1 |
| Acute pyelonephritis | 3 |
ABMR=Antibody-mediated rejection, ATI=Acute tubular injury, TCMR=T-cell-mediated rejection, CNI=Calcineurin inhibitor
Cf-DNA estimation and correlation with graft status
All participants had total Cf-DNA (i.e., Cf-DNA of both recipient and donor origins present in recipient’s plasma), and dd-Cf-DNA fractions estimated from their blood samples. We first attempted to analyze if total Cf-DNA levels correlated with clinical/histopathologic diagnosis. There was no correlation noted.
Further, dd-Cf-DNA estimation in each subject’s plasma was done. This was analyzed in the following ways to assess for correlation with the clinical/biopsy diagnosis:
-
as a simple yes or no test, where the detection of dd-Cf-DNA fraction was considered a positive test;
-
as a semi-quantitative test, where the absolute concentration of dd-Cf-DNA was considered; and
-
as a semi-quantitative test, where the ratio of dd-Cf-DNA fraction to the total Cf-DNA fraction was calculated as a percentage and considered.
dd-Cf-DNA was detected successfully at quantifiable levels in all four patients with ABMR. It was positive in all higher-grade TCMRs (1B). It, however, performed less accurately in TCMR 1A. It was negative (or below the detection threshold of our assay) in three out of five patients with TCMR 1A. The values for absolute concentration of dd-Cf-DNA are shown in Figure 2.
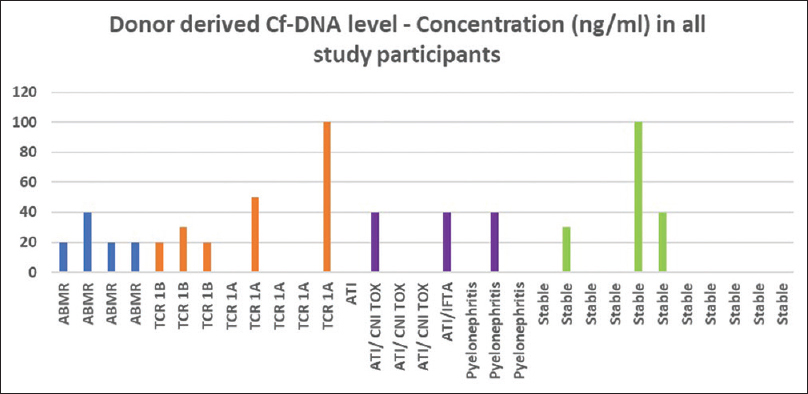
- Concentration of dd-Cf-DNA across subgroups. dd-Cf-DNA = donor-derived cell-free DNA
dd-Cf-DNA was negative in five out of eight patients with nonrejection graft dysfunction (ATI, pyelonephritis). In three patients (one pyelonephritis, one ATI due to calcineurin toxicity, and one ATI with interstitial fibrosis & tubular atrophy - IFTA), dd-Cf-DNA was detected.
Out of 11 patients with clinically stable graft function, no dd-Cf-DNA was detected in eight patients. All three patients who had detectable levels were found to have stable graft function over a period of at least 1 year on subsequent follow-up. One was 5 years posttransplant, with one rejection episode (TCMR 1A) immediately posttransplant. She has had stable graft function since then, with a creatinine of 1.1 mg/dl. The other two patients were 1 year posttransplant, with a creatinine of 1 and 1.2 mg/dl, respectively, with no prior biopsies. There was no indication to biopsy these patients otherwise at the time of the study. A cursory view of the graphical depiction of absolute concentration of dd-Cf-DNA in Figure 2 shows the clustering of detectable levels among higher grades of rejection (TCMR 1B, ABMR).
dd-Cf-DNA was also calculated as a percentage of the donor-derived fraction to the total Cf-DNA content (donor plus recipient Cf-DNA) measured in plasma and is represented in Figure 3. It is evident that even though the absolute concentration of dd-Cf-DNA was similar among many of the subgroups, when it was expressed as a percentage of the total Cf-DNA, discriminatory ability improved. All patients with ABMR had dd-Cf-DNA detection at higher percentages (>0.25%). At a cutoff of 0.25%, we could predict ABMR (four out of four) with a few false-positive hits (three out of 27). All but one of the patients with stable graft function had either undetectable or very low signals (<0.06%). TCR 1B patients had detection in the range of 0.06%–0.2%. One patient each with ATI and graft pyelonephritis also had positive signals in this range. Three outliers with values greater than 1% included one TCR 1A, one ATI with significant IFTA, and one patient with stable graft function.
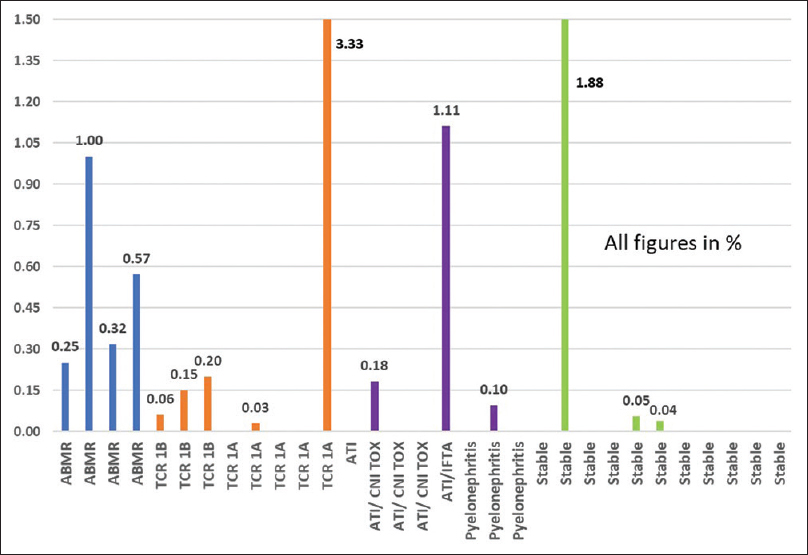
- % dd-Cf-DNA to total Cf-DNA across subgroups. Cf-DNA = cell-free DNA, dd-Cf-DNA = donor-derived cell-free DNA
Diagnostic accuracy of dd-Cf-DNA as a marker of rejection
We analyzed the diagnostic performance of dd-Cf-DNA (yes/no test) as a marker of rejection. In our first analysis, we chose to keep “any rejection” as the end point, including active ABMR or any TCMR 1A and higher. We had a total of 12 cases of “any rejection” and 19 in the “no rejection” group. A 2 × 2 table was constructed and is presented in Table 3.
| Rejection | No rejection | Total | Sensitivity | 75 | |
|---|---|---|---|---|---|
| dd-Cf-DNA + | 9 | 6 | 15 | Specificity | 68.4 |
| dd-Cf-DNA − | 3 | 13 | 16 | PPV | 60.0 |
| 12 | 19 | 31 | NPV | 81.3 | |
dd-Cf-DNA=Donor-derived cell-free DNA, NPV=Negative predictive value, PPV=Positive predictive value
The above analysis revealed modest sensitivity (75%) and specificity (68%) for predicting any rejection. As it was apparent that the dd-Cf-DNA performs less robustly at predicting milder rejection, we analyzed the same for higher grade rejections of TCR 1B and ABMR as shown in Table 4. In diagnosing higher grade TCMR or ABMR, this test had 100% sensitivity with a lower specificity (67%). In short, this will serve as a good rule out test for higher grades of rejection. When dd-Cf-DNA detection was analyzed as a yes/no test for ABMR alone [Table 5], it had high sensitivity and negative predictive values (both 100%), with a trade-off being a lower specificity (70%).
| Rejection + | Rejection − | Total | Sensitivity | 100 | |
| dd-Cf-DNA + | 7 | 8 | 15 | Specificity | 66.7 |
| dd-Cf-DNA − | 0 | 16 | 16 | PPV | 46.7 |
| 7 | 24 | 31 | NPV | 100.0 | |
ABMR=Antibody-mediated rejection, dd-Cf-DNA=Donor-derived cell-free DNA, NPV=Negative predictive value, PPV=Positive predictive value
| Rejection + | Rejection − | Total | Sensitivity | 100 | |
| dd-Cf-DNA + | 4 | 8 | 12 | Specificity | 70.4 |
| dd-Cf-DNA − | 0 | 19 | 19 | PPV | 33.3 |
| 4 | 27 | 31 | NPV | 100 | |
ABMR=Antibody-mediated rejection, dd-Cf-DNA=Donor-derived cell-free DNA, NPV=Negative predictive value, PPV=Positive predictive value
When the percentage of dd-Cf-DNA to total Cf-DNA was utilized, the discriminatory ability of the test improved. At a cutoff of 0.25%, the ability to predict ABMR was superior [Table 6] with 100% sensitivity and good specificity (89%). ROC curve analysis provided a 0.889 area under the curve (P = 0.013) [Figure 4]. If a 0.05% cutoff was used to identify any rejection, then it offered a sensitivity of 67% against a specificity of 74% [Table 7]. In diagnosing TCMR 1B or ABMR, the sensitivity improved to 100% with 75% specificity [Table 8].
| % dd-Cf DNA | ABMR + | ABMR − | Total | Sensitivity | 100.0 |
| ≥0.25% | 4 | 3 | 7 | Specificity | 88.9 |
| <0.25% | 0 | 24 | 24 | PPV | 57.1 |
| 4 | 27 | 31 | NPV | 100.0 | |
ABMR=Antibody-mediated rejection, dd-Cf-DNA=Donor-derived cell-free DNA, NPV=Negative predictive value, PPV=Positive predictive value
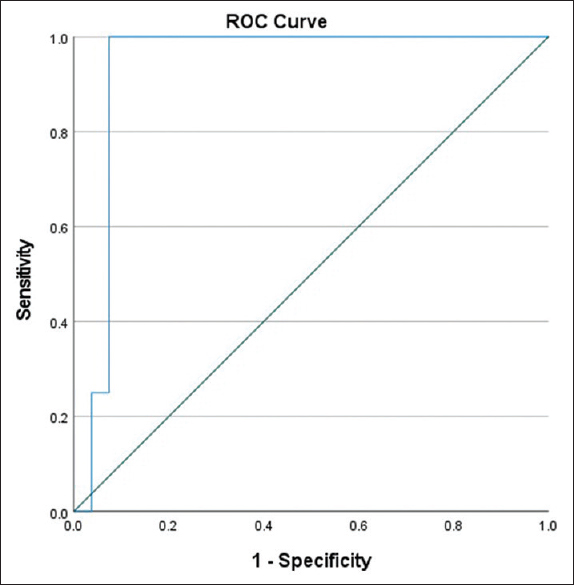
- % dd-Cf-DNA and ABMR prediction – ROC curves. ABMR = antibody-mediated rejection, dd-Cf-DNA = donor-derived cell-free DNA, ROC = receiver operating characteristic
| % dd-Cf DNA | Any rejection + | Any rejection − | Total | Sensitivity | 66.7 |
| ≥0.05% | 8 | 5 | 13 | Specificity | 73.7 |
| <0.05% | 4 | 14 | 18 | PPV | 61.5 |
| 12 | 19 | 31 | NPV | 77.8 | |
dd-Cf-DNA=Donor-derived cell-free DNA, NPV=Negative predictive value, PPV=Positive predictive value
| % dd-Cf DNA | 1B/ABMR + | 1B/ABMR − | Total | Sensitivity | 100.0 |
| ≥0.05% | 7 | 6 | 13 | Specificity | 75.0 |
| <0.05% | 0 | 18 | 18 | PPV | 53.8 |
| 7 | 24 | 31 | NPV | 100.0 | |
ABMR=Antibody-mediated rejection, dd-Cf-DNA=Donor-derived cell-free DNA, NPV=Negative predictive value, PPV=Positive predictive value
Discussion
dd-Cf-DNA is an emerging tool to predict rejection noninvasively. Graft injury causes cell breakdown, releasing naked or free donor DNA into the blood stream of the recipient.[6] The “Circulating Donor-Derived Cell-Free DNA in Blood for Diagnosing Acute Rejection in Kidney Transplant Recipients” (DART) study was a prospective, observational study conducted in 14 centers across the USA, which suggested that at certain thresholds, this marker can discriminate active rejection status.[7] However, a later research article from Belgium questioned this hypothesis with their study concluding that dd-Cf-DNA was no better than creatinine in the posttransplant setting.[8] No such marker has been studied or validated in an Indian clinical setting, to the best of our knowledge, and we chose to conduct a pilot study to determine feasibility and application of this biomarker in clinical practice.[910]
We are reporting our analysis of 31 patients who have been included in this study so far. The sample size is limited due to cost and the fact that the platform used for analysis of Cf-DNA in our study was developed de novo and standardization of the assay was time consuming. We have also ensured that the same samples were assayed multiple times to confirm reproducibility of results on our platform. Moreover, the scientists working on the laboratory processing of Cf-DNA were blinded from the clinical diagnosis or classification of patients.
Patients were classified into the group with rejection and the group without, based on histopathology and clinical follow-up. The two groups had similar age at baseline. The rejection group had a slightly longer time interval since transplant, but the difference was in terms of a few months and not significant.
Our study results validate what other studies have shown thus far: dd-Cf-DNA performs best in ruling out ABMR and higher grades of TCMR (1B). It performs poorly in discriminating lower grades of TCMR (1A). We have demonstrated a positive dd-Cf-DNA fraction in all the seven patients who fall into a higher grade of rejection category (TCMR 1B or ABMR). What is most promising is the negative predictive value of 100% for TCR 1B plus ABMR, 100% for ABMR alone, and 81% for any rejection.
Among eight patients who had a graft biopsy showing no rejection, dd-Cf-DNA represented as a percentage of the total Cf-DNA was detectable in high levels in a patient with ATI and moderate IFTA and at lower levels in a patient with ATI alone. It is conceivable that significant IFTA + ATI heightens the output of dd-Cf-DNA from the chronically injured graft. Graft pyelonephritis, another important cause for graft inflammation, did not cause detectable elevation of dd-Cf-DNA levels in two patients, but a low level elevation in one patient. Among the patients who had stable graft function, three patients (out of 11) showed a detectable donor Cf-DNA, but it was of low absolute quantity and ratio in two patients and high signal in one patient. This could mean subclinical graft injury or a true false-positive elevation. It would perhaps have been ideal to biopsy these patients and unmask any pathology. However, as mentioned previously, all three of these patients have had a stable creatinine for more than 1 year, with no evidence of proteinuria. The treating team felt it was not justified to biopsy these patients and they have been kept on follow-up.[11] Previous studies have shown low level signals of donor Cf-DNA in the blood samples of recipients with stable grafts. However, in our study, none of the samples from other recipients with stable graft (eight out of 11) showed detectable levels.[12] This probably reflects the detection threshold of our assay platform.
The landmark DART study expresses all dd-Cf-DNA as a fraction of the total Cf-DNA in recipient plasma, with more than 1% being significantly elevated. The sensitivity of dd-Cf-DNA detection was higher in the previously published studies, where they had detected donor DNA fractions in most stable kidney transplant patients. This is in contrast to our study, where the level of donor DNA in most stable graft participants (eight out of 11) is below the detection threshold of our analysis. To put it simply, we have been able to detect and quantify dd-DNA at a higher threshold than some previous landmark studies. Where other studies may present a low quantity as a very low percentage, we are only able to report it as negative. But it is prudent to note that despite the lower sensitivity of DNA detection that is inherent in our platform, our analysis seems to perform comparably well in detecting higher grades of rejection. Most previous studies have shown that dd-Cf-DNA performs with less predictability at lower degrees of TCMR, especially 1a, and borderline rejection, which is what we have encountered as well.
We hope that with more sample standardization and better and cheaper genetic tools in the near future, we would be able to reach the thresholds published in previous studies. However, we are not really sure if it would make further clinical relevance than what we think our current thresholds are able to achieve.[41314] Our data suggests that the mean dd-Cf-DNA percentage in the rejection cohort was 0.325%, in comparison to 0.124% in the no-rejection cohort. It must be kept in mind that in most participants with no rejection, this value was actually 0% in our study.
The ROC curve analysis utilized the percentage of donor Cf-DNA detected in the recipient plasma. It offered better diagnostic accuracy for discrimination of all TCMR1B or ABMR and ABMR alone (89%). The classification of any rejection versus no rejection was less accurate. When the absolute concentration of dd-Cf-DNA was tested, it performed less robustly in this regard.
It is well known that creatinine performs poorly as a surveillance tool posttransplant. Creatinine only starts to rise when significant pathology has already set in. Surveillance biopsies are, therefore, advocated in some centers, though with mixed results.[15] However, doing an invasive procedure periodically with no other apparent indication may not be acceptable to the patient. Though Cf-DNA was envisaged as a potential tool in this regard, our current experience suggests otherwise. With the current performance, if this tool were to be used for surveillance, many early TCMRs would be missed. In an appropriate setting, a significantly elevated dd-Cf-DNA would beseech the nephrologist to perform an urgent kidney biopsy to exclude higher grades of rejection. Therefore, this is yet another diagnostic tool in evolution.
Limitations
Given the high cost and time taken for standardization of the test procedure, we have included only a small, convenient sample size for this analysis. As the platform for Cf-DNA estimation has been developed independently and the sensitivity of our test varies from commercially available platforms, the cut-offs expressed in this study are not comparable with previously published literature.[16]
Future directions
As a pilot study, this biomarker seems promising and actionable even in a resource-limited setting. Further analysis with more participants and subgroups would be useful and is planned.
Conclusion
-
In this pilot study, we demonstrate the diagnostic accuracy of dd-Cf-DNA in predicting rejection of the renal allograft. It performs well in ABMR and higher grades of TCMR, but poorly in lower grades. This is the first of its kind study reported from India, to the best of our knowledge.
-
Our thresholds for detection of dd-Cf-DNA are different from those in previously published studies due to cost constraints, but it still performs comparably well across various pathologies.
-
The total concentration of dd-Cf-DNA has a lower diagnostic accuracy for rejection than its percentage to total Cf-DNA in our study.
-
Its role in surveillance needs more investigation, as it fails to detect early rejections accurately.
Declaration of patient consent
The authors certify that they have obtained all appropriate patient consent forms. In the form, the patients have given their consent for their images and other clinical information to be reported in the journal. The patients understand that their names and initials will not be published and due efforts will be made to conceal their identity, but anonymity cannot be guaranteed.
Financial support and sponsorship
Nil.
Conflicts of interest
None.
References
- Late kidney allograft loss:What we know about it, and what we can do about it. Clin J Am Soc Nephrol. 2008;3(Suppl 2):S56-67.
- [Google Scholar]
- American Society of Nephrology. Available from:https://cjasn.asnjournals.org/content/6/7/1774
- Understanding and using AlloSure donor derived cell-free DNA. Biophys Rev. 2020;12:917-24.
- [Google Scholar]
- Donor-derived cell-free dna is a novel universal biomarker for allograft rejection in solid organ transplantation. Transplant Proc. 2015;47:2400-3.
- [Google Scholar]
- Graft-derived cell-free DNA, a noninvasive early rejection and graft damage marker in liver transplantation:A prospective, observational, multicenter cohort study. PLoS Med. 2017;14:e1002286.
- [Google Scholar]
- Donor-derived cell-free DNA in kidney transplantation as a potential rejection biomarker:A systematic literature review. J Clin Med. 2021;10:193.
- [Google Scholar]
- Cell-free DNA and active rejection in kidney allografts. J Am Soc Nephrol. 2017;28:2221-32.
- [Google Scholar]
- The use of plasma donor-derived, cell-free DNA to monitor acute rejection after kidney transplantation. Nephrol Dial. 2020;35:714-21.
- [Google Scholar]
- Optimizing detection of kidney transplant injury by assessment of donor-derived cell-free DNA via massively multiplex PCR. J Clin Med. 2018;8:19.
- [Google Scholar]
- Donor-derived cell-free DNA detects kidney transplant rejection during nivolumab treatment. J Immunother Cancer. 2019;7:182.
- [Google Scholar]
- Biological variation of donor-derived cell-free DNA in renal transplant recipients:Clinical implications. J Appl Lab Med. 2017;2:309-21.
- [Google Scholar]
- Plasma donor-derived cell-free DNA kinetics after kidney transplantation using a single tube multiplex PCR assay. PLoS One. 2018;13:e0208207.
- [Google Scholar]
- The detection of donor-derived cell-free DNA may serve as a biomarker for the early detection of chronic lung allograft dysfunction. EBioMedicine. 2019;40:13-4.
- [Google Scholar]
- Donor-derived cell-free DNA identifies antibody-mediated rejection in donor specific antibody positive kidney transplant recipients. Transplant Direct. 2018;4:e379.
- [Google Scholar]
- The significance of subclinical rejection and the value of protocol biopsies. Am J Transplant. 2006;6:2006-12.
- [Google Scholar]
- Cell-free DNA:An upcoming biomarker in transplantation. Am J Transplant. 2015;15:2541-51.
- [Google Scholar]


